Feedback
Last date modified: 2026-Jul-24
Navigating the aiR for Review dashboard
When you select a project from the aiR for Review Projects tab, a dashboard displays showing the project's prompt criteria, the list of documents, and controls for editing the project. If the project has been run, it also displays the results.
Project details strip
At the top of the dashboard, the project details strip displays:

| Features | ||
|---|---|---|
| 1 | Project name | Name given to the project during set up. The Analysis Type appears underneath the name. |
| 2 | Project set type | Indicates whether the project set and criteria are Develop, Validate, or Apply. |
| 3 | Data Source Name | Name of the data source (saved search) chosen at project set up and the document count. Click the link to view the documents in the data source. |
| 4 | Version number | Version number of the prompt criteria for the set and last run or saved date. For more information, see How prompt criteria versioning works. |
| 5 | Down-arrow | Click to move between project sets to view their statistics. |
| 6 | + plus icon (Project set) |
Click to create a new project set using a different data source for the prompt criteria, to validate the prompt criteria on a target document population, or to apply it to the larger document set. See Using project sets for more information. |
| 7 | Analyze documents button |
Click to analyze the selected documents using the current version of the prompt criteria. If no documents are selected or filtered, it will analyze all documents in the data source.
|
| 8 | Feedback icon |
Click to send optional feedback to the aiR for Review development team. |
Prompt criteria panel
On the left side of the dashboard, the prompt criteria panel displays tabs that match the project type you chose when creating the project. These tabs contain fields for writing the criteria you want aiR for Review to apply when analyzing the documents.
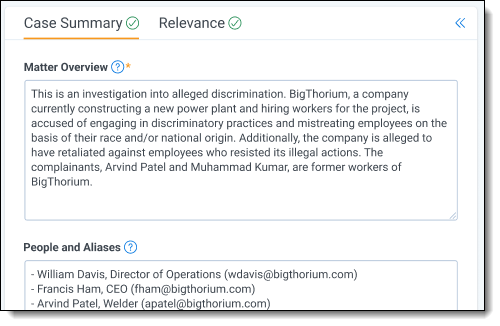
Possible tabs include:
- Case Summary—appears for Relevance, Relevance and Key Documents, and Issues analysis types.
- Relevance—appears for Relevance and Relevance and Key Documents analysis types.
- Key Documents—appears for the Relevance and Key Documents analysis type.
- Issues—appears for the Issues analysis type.
- Confidential Business Information (CBI)—appears for the Confidential Business Information analysis type.
- Custom—appears for the Custom analysis type.
For information on filling out the prompt criteria tabs, see Developing prompt criteria.
For information on building prompt criteria from existing case documents, like requests for production or review protocols, see Using prompt kickstarter (Draft with AI).
To export the prompt criteria displayed, see Exporting prompt criteria.
If you want to temporarily clear space on the dashboard, click the Collapse symbol ( ) in the upper right of the prompt criteria panel. To expand the panel, click the symbol again.
Aspect selector bar
The aspect selector bar appears in the upper middle section of the dashboard for projects that use Issues analysis or Relevance and Key Documents analysis. This lets you choose which metrics, citations, and other results to view in the document grid.
- For a Relevance and Key Documents analysis:
 Two aspect tabs appear: one for the field you selected as the Relevant Choice, and one for the field you selected as the Key Document Choice.
 - For Issues analysis:

- The All Issues tab displays first. It offers a comprehensive overview of predictions and scores for all issues and documents within the project. The total number of issue predictions displayed on the All Issues tab is calculated by multiplying the number of issues by the number of documents. For example, if you had 10 issues and 100 documents, issue predictions would equal 1000.
- A tab appears for every Issues field choice that has choice criteria. Click each to view the corresponding data. The tabs appear in order according to each choice's Order value. For information on changing the choice order, see Choice detail fields.
- The All Issues tab displays first. It offers a comprehensive overview of predictions and scores for all issues and documents within the project. The total number of issue predictions displayed on the All Issues tab is calculated by multiplying the number of issues by the number of documents. For example, if you had 10 issues and 100 documents, issue predictions would equal 1000.
When you select one of the aspect tabs in the bar, both the project metrics section and document grid update to show results related to that aspect. For example:
- If you choose the Key Document tab:
The project metrics section shows how many documents have been coded as key. The document grid updates to show predictions, rationales, citations, and all other fields related to whether the document is key. - If you choose an issue from the aspect selector:
The project metrics section and document grid both update to show results related to that specific issue. The total number of issue predictions in this section is calculated by multiplying the number of issues by the number of documents. For example, if there are five issues and 100 documents, there will be 500 issue predictions.
Project metrics section
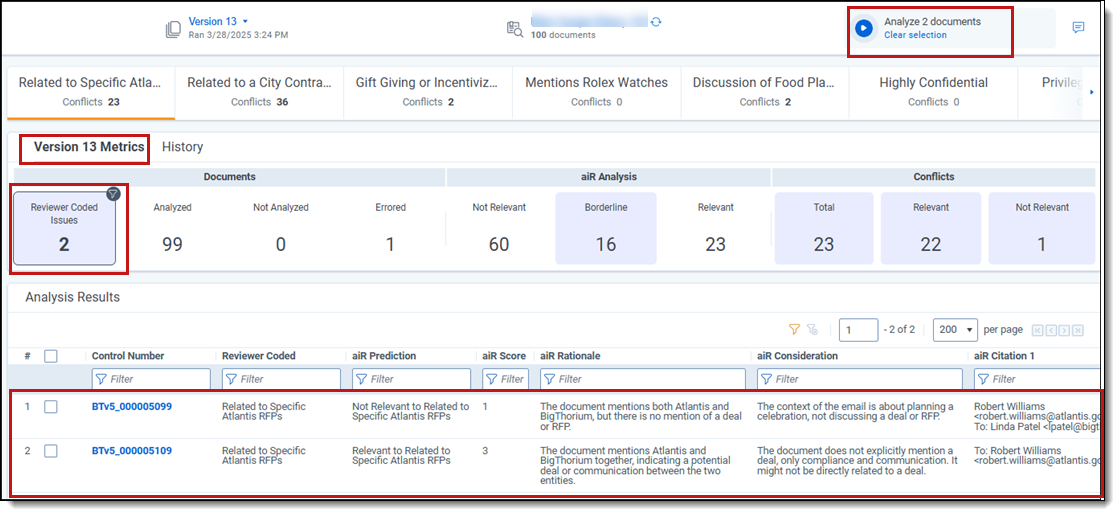
In the middle section of the dashboard, the project metrics section shows the results of previous analysis jobs. There are two tabs: one for the current version's most recent results (Version Metrics tab), and one for a list of historical results for all previous versions (History tab).
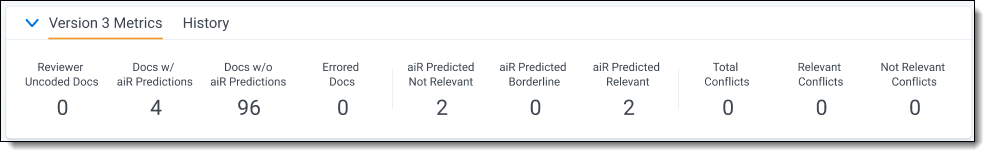
Version Metrics tab
The Version [X] Metrics tab shows metrics divided into sections:
| Section | Field Description |
|---|---|
| Documents |
|
|
Issue Predictions |
The Issue Predictions section displays for Issues analysis when the All Issues tab is selected.
|
| aiR Analysis |
|
| Conflicts |
Conflicts are not displayed after running Apply on a project set. See Applying the prompt criteria for more information on running an Apply function.
Conflicts are when the human reviewers' coding and aiR's predictions are not in alignment.
|
The metrics adjust their counts based on the type of results displayed:
- For Relevance analysis results, relevance-related metrics use the Relevance Field for their counts.
- For Key Document analysis results, relevance-related metrics use the Key Document Field for their counts.
- For Issues analysis results, relevance-related metrics count documents marked for the selected issue.
For instance, when viewing results for an issue such as Fraud, the aiR Predicted Relevant field displays documents identified as associated with Fraud. When viewing Key Document results, the aiR Predicted Relevant field displays documents identified as key documents.
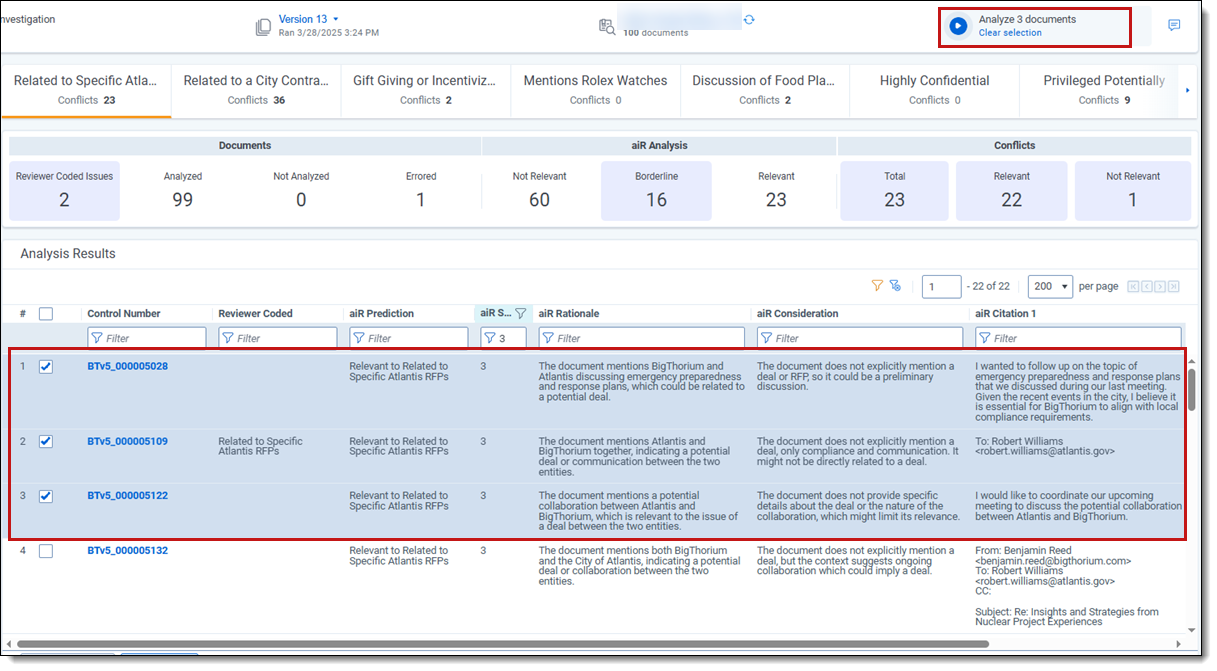
Filtering the Analysis Results using version metrics
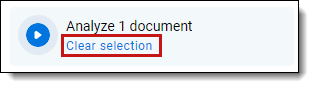
To filter the Analysis Results table based on any of the version metrics, click the desired metric in the Version Metrics banner. This narrows the results shown in the table to only documents that are part of the metric. It also auto-selects those documents for the next analysis job. The number of selected documents is reflected in the Run button's text. This makes it easier to analyze a subset of the document set instead of selecting all documents every time. To remove filtering, click Clear selection underneath the Run button.
You can also filter documents in the document grid by selecting them in the table. See Filtering and selecting documents for analysis.
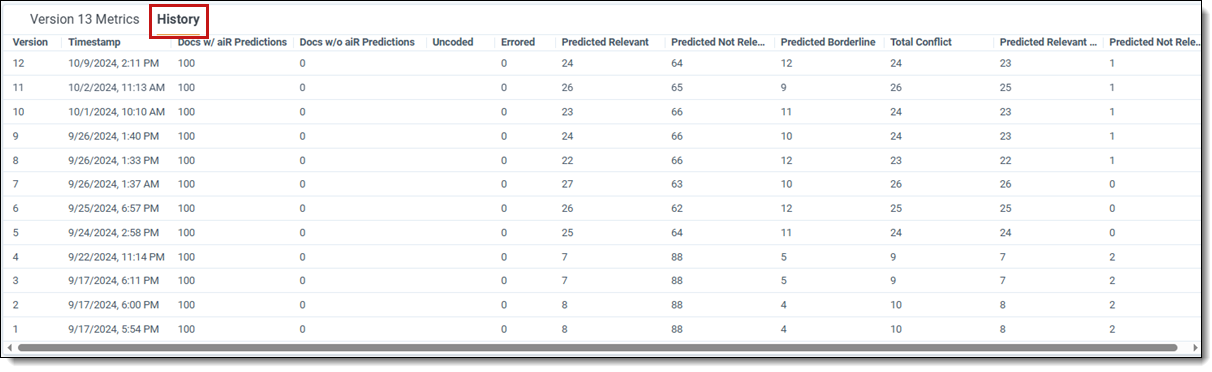
History tab
The History tab shows results for all previous versions of the prompt criteria. This table includes all fields from the Version Metrics tab, sorted into rows by version. For a list of all Version Metrics fields and their definitions, see Version Metrics tab.
It also displays two additional columns:
- Version—the prompt criteria version that was used for this row's results.
- Timestamp—the time the analysis job ran.
Results and summaries
In the middle section of the dashboard, a document grid appears with two tabs: Analysis Results and Summaries. The Analysis Results tab shows documents alongside their scores and results, while the Summaries tab shows the descriptive topics and summaries that aiR generated for each document.
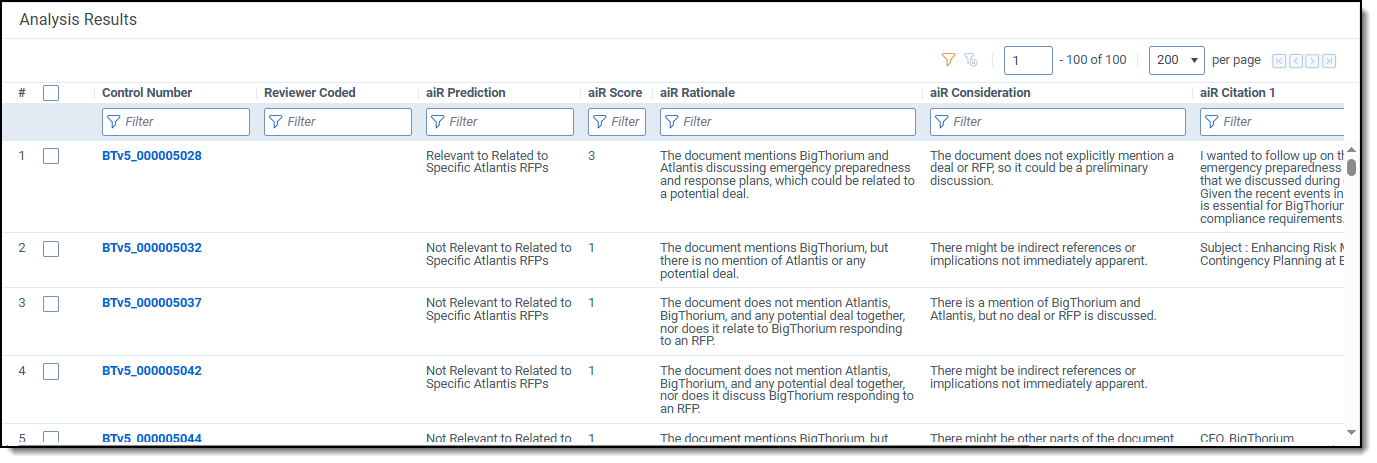
Analysis Results tab
The Analysis Results tab shows a list of all documents in the project and their results. If the documents have aiR for Review analysis results, they appear in the grid. The fields that appear in the grid vary depending on what type of analysis was chosen. For a list of all results fields and their definitions, see Analyzing aiR for Review results.
Each of the objects has a group of associated fields: a prediction, a corresponding numerical score, the rationale supporting the prediction, any considerations that might prove the prediction wrong, any citations found within the document (maximum 5) to support the prediction, and any errors encountered. Use these fields to understand why aiR scored a document a certain way, to provide insights into your documents, and to provide insights into ways you may want to iterate on the prompt criteria.
aiR for Review's predictions do not overwrite the Relevance, Key, or Issues fields chosen during prompt criteria setup. Instead, the predictions are held in other fields. This makes it easier to distinguish between human coding choices and aiR's predictions.
Summaries tab
The Summaries tab shows a list of all documents in the project and their aiR-generated topics and summaries. These topics and summaries are independent of the prompt criteria, and they are the same for each document across all projects.
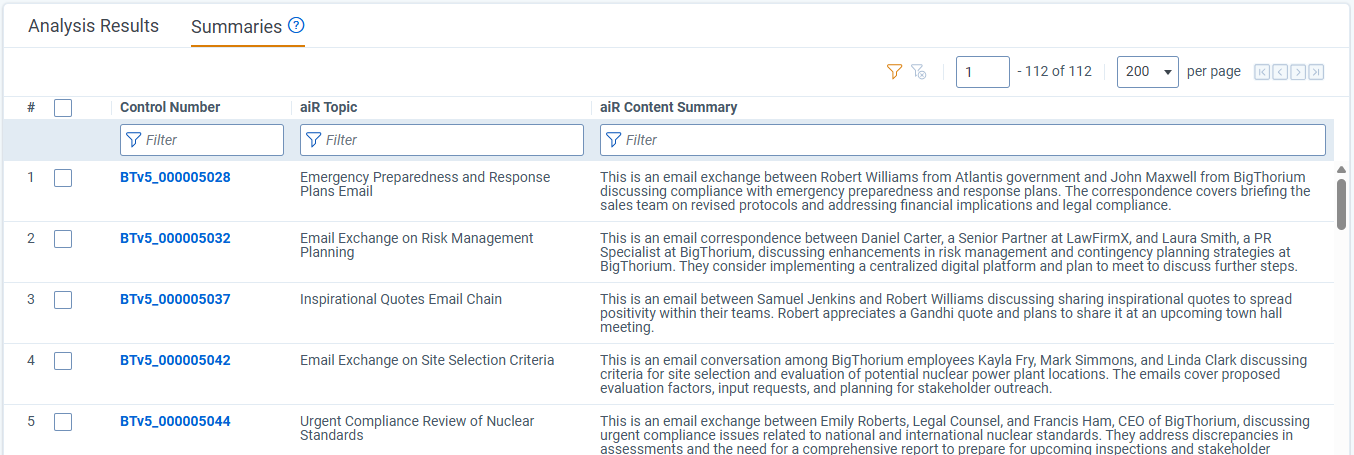
For more information on aiR topics and summaries, see Document summaries.
Viewing inline highlighting and citations in the Viewer
To view inline highlighting and citations for an individual document, click on the document Control Number link. The Viewer opens and displays results for the selected prompt criteria version. For more information on viewing aiR for Review results in the Viewer, see aiR for Review Analysis.
Filtering and selecting documents for analysis
To manually select documents to include in the next analysis run, check the box beside each individual document in the grid. The number of selected documents is reflected in the Run button's text. To remove filtering, click Clear selection underneath the Run button.
You can also filter the grid by clicking the metrics in the Version Metrics section. See Filtering the Analysis Results using version metrics.
Clearing selected documents
Click the Clear selection link below the Analyze button to deselect all documents in the grid. This resets your selections so the next analysis includes all documents in the data source.