


Feedback
Last date modified: 2026-Jun-23
Usage Reports
Usage Reports is the modern way to gather information and gain oversight across your instance. Typically, metrics presented in Usage Reports are used for end-client billing, tracking adoption, and general usage metrics. System and Client Domain Administrators can create custom reports at the instance level to report on their workspace utilization and Processing consumption metrics for billing and usage tracking.
For a complete list of fields available in the Usage Reports, see Usage Report fields, below.
Usage Reports will always include data from workspaces that have been deleted from the system. Deleting a workspace does not remove its reporting data. When you delete a workspace, it still appears in the Usage Report for that month. Its usage values reset to zero, and its Tier defaults to Review. This behavior is expected. The system continues to send zeroed-out metrics for the deleted workspace until the end of the month, so the report lists it under the Review tier. This does not affect billing accuracy.
Permissions
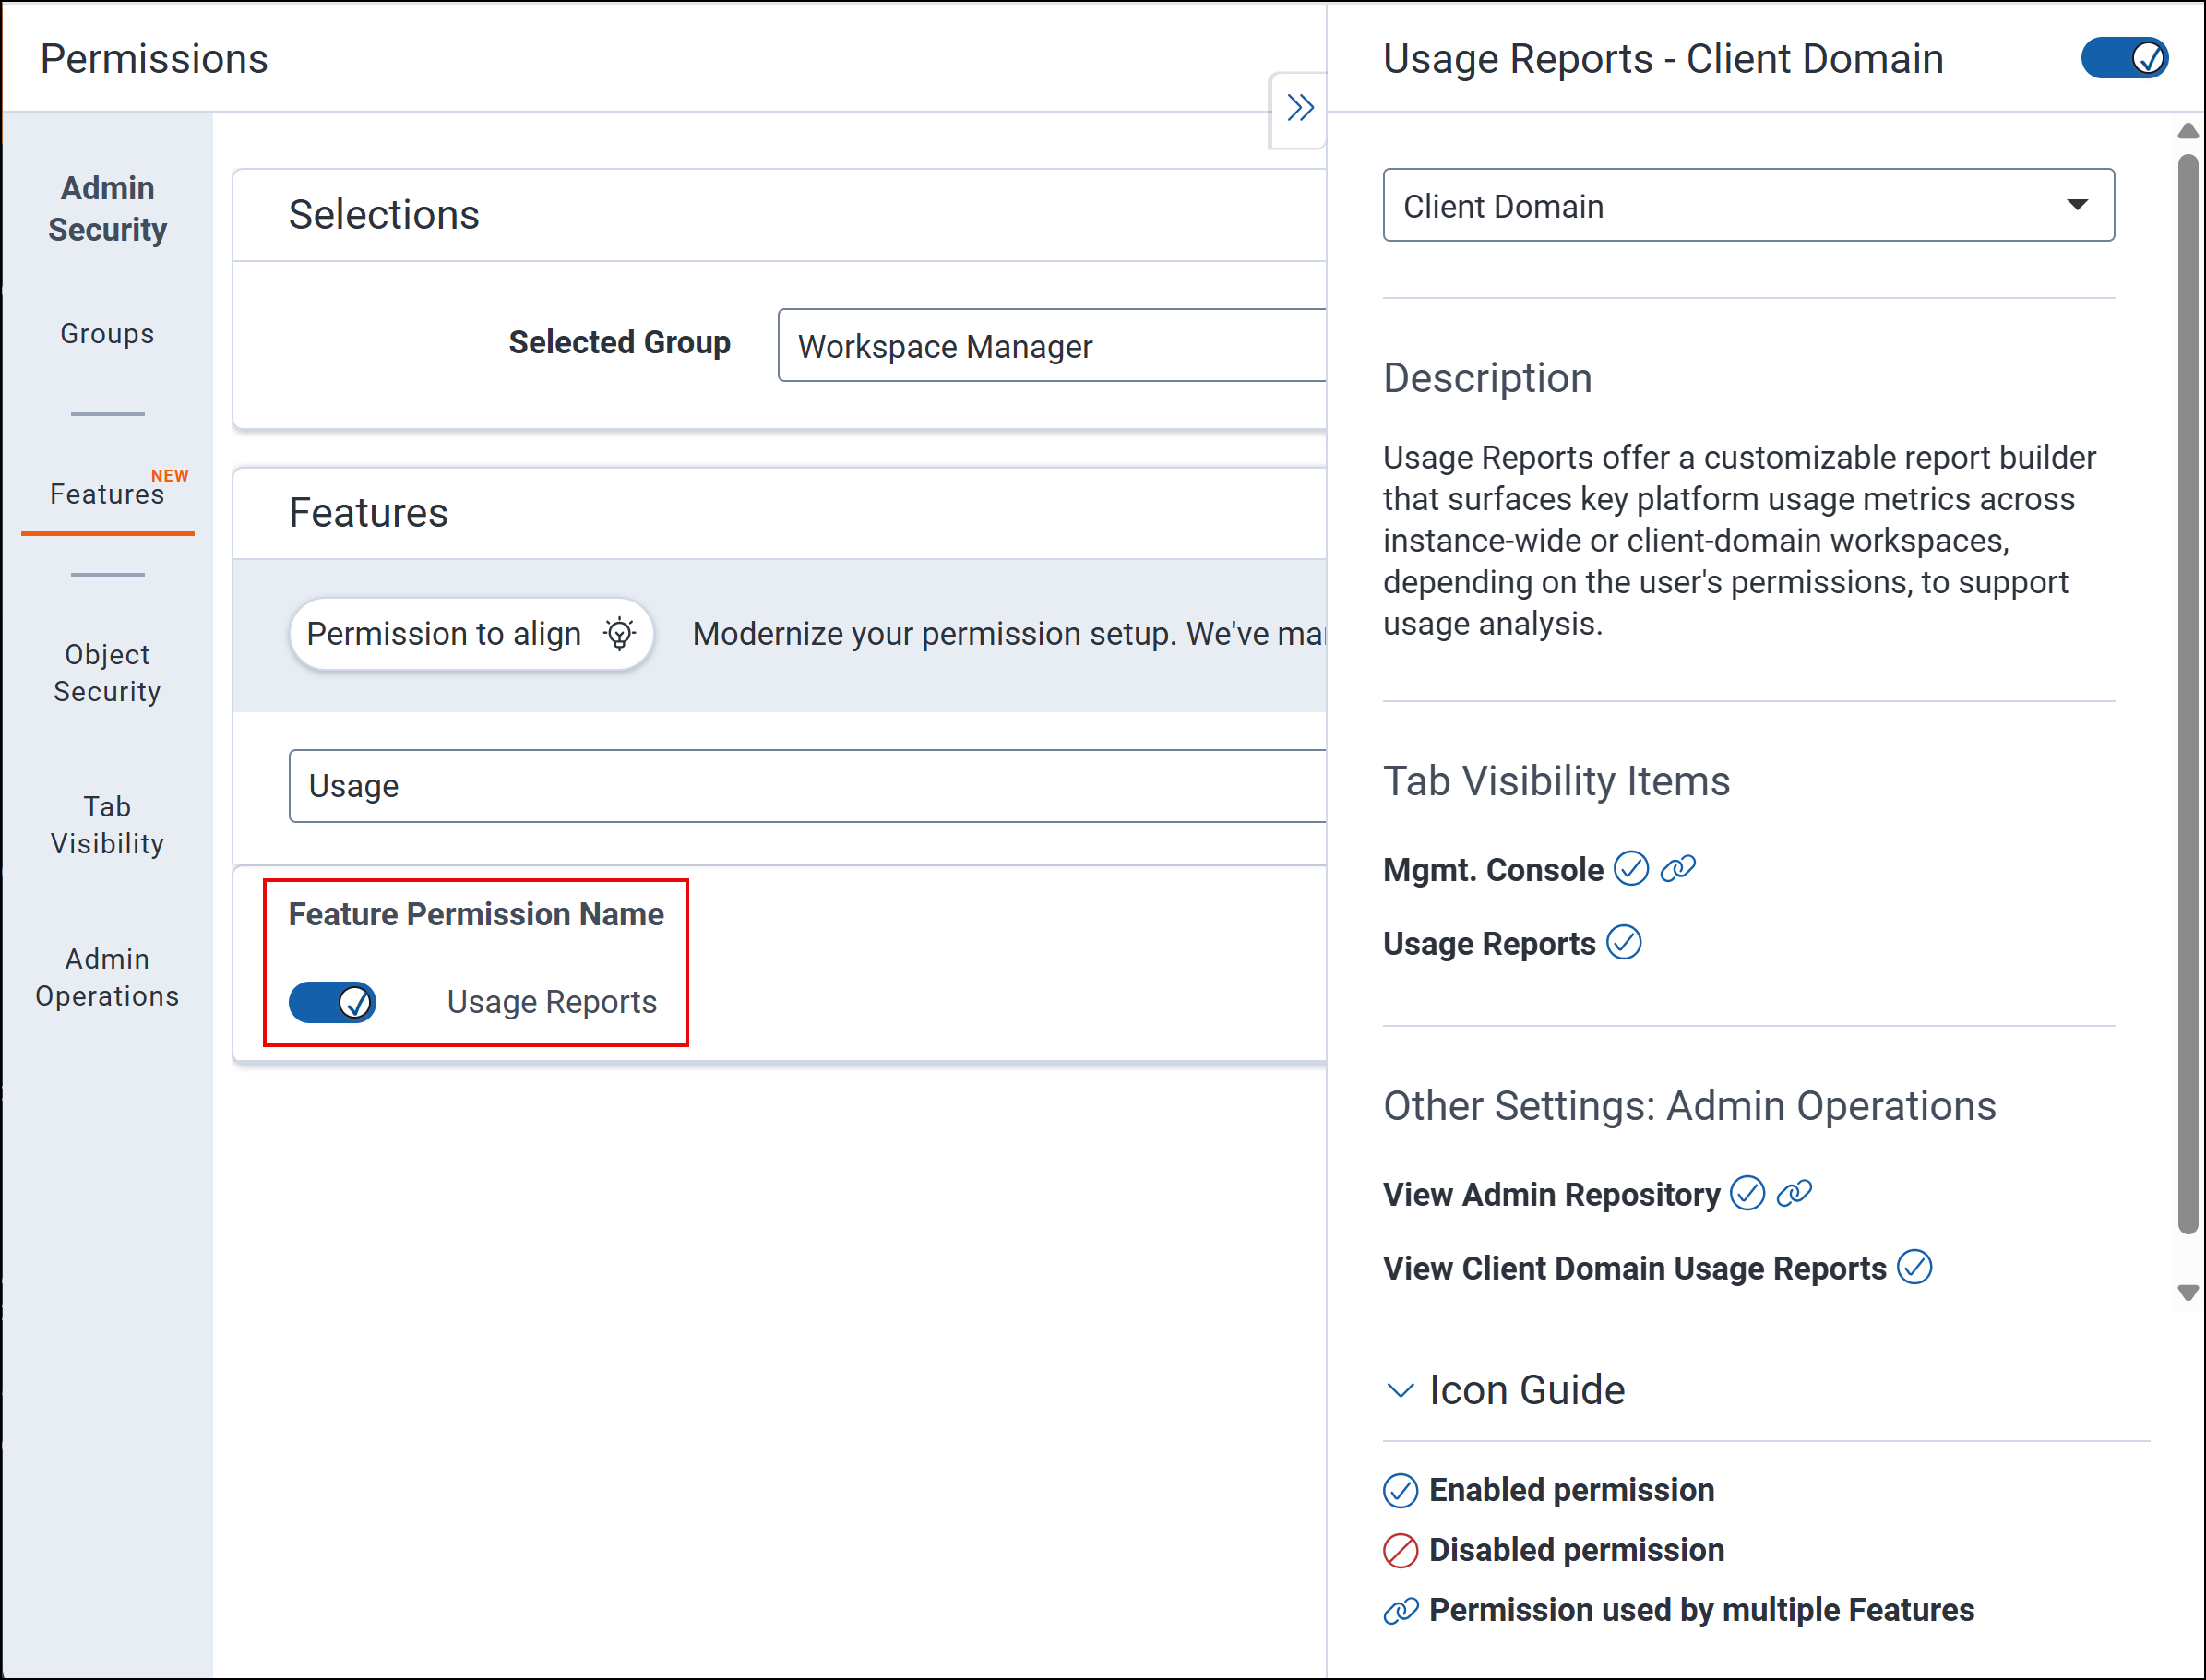
Roles like customer finance team members or API account users can generate client billing reports without needing System Administrator permissions.
| Tab Visibility | Admin Operations |
|---|---|
| Management Console and Usage Reports |
|
When generating a report, a Client Domain Administrator’s report only contains usage information for the workspaces in their client domain. Additionally, the Usage Reports List also only contains reports that are from their client domain and not from other client domains.
Creating Usage Reports
To create a new Usage Report:
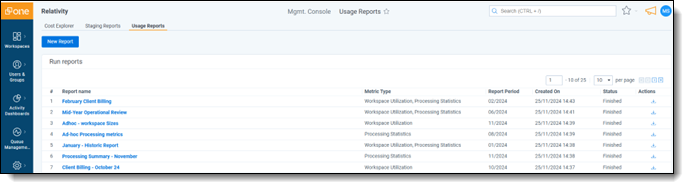
- Navigate to the Usage Reports tab in Management Console. For more information, see Navigation or Management Console.
- Click New Report.
- Enter or select values for the following fields:
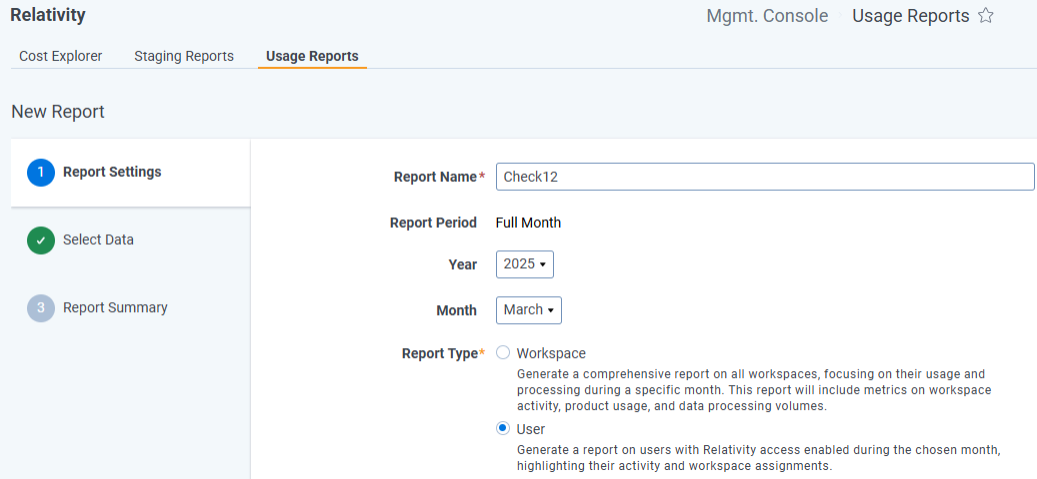
- Report Name—enter a unique name to identify the report.
- Year—select the year you wish to report on.
- Month—select the month you wish to report on.
- Report Type—select Workspace or User.
- Workspace— a comprehensive report on all workspaces, focusing on their usage and processing during a specific month. This report will include metrics on workspace activity, product usage, and data processing volumes. Deleted workspaces remain included in Usage Reports for the month in which they existed. Their usage values reset to zero for the remainder of that month. However, deleted workspaces only appear in Instance-wide Usage Reports. They do not appear in Client Domain reports. When a workspace is deleted, its Client and Matter associations are removed. Without those associations, the workspace cannot be mapped to a Client Domain, so Client Domain Administrators will not see it in their Usage Reports, even for previous months.
- User—a report on users with Relativity access enabled during the chosen month, highlighting their activity and workspace assignments.
- Workspace— a comprehensive report on all workspaces, focusing on their usage and processing during a specific month. This report will include metrics on workspace activity, product usage, and data processing volumes.
- Data Max Precision—enable this toggle to display higher-precision GB values in your Usage Report output. This toggle is available only for Workspace reports.
- Toggle off (default): GB values are rounded to two decimal places. Usage amounts below 0.005 GB display as 0.00 GB, and the associated cost may display as $0.00. Exported reports retain full-precision, unrounded values. As a result, a workspace may show 0.00 GB and $0.00 in the UI while the exported report shows non-zero usage and a corresponding cost. This rounding can also cause small differences between the sum of individual workspace values in the UI and the unrounded total.
- Toggle on: GB values are displayed with up to 15 decimal places.
- Click Next.
- On the Select Data tab, choose the desired metrics under the Workspace Utilization, Product Utilization, and Processing Statistics sections that you want to include in the report. You must choose at least one field in any of the sections. To select all metrics in a section, click the checkbox next to the Metric Name column heading.
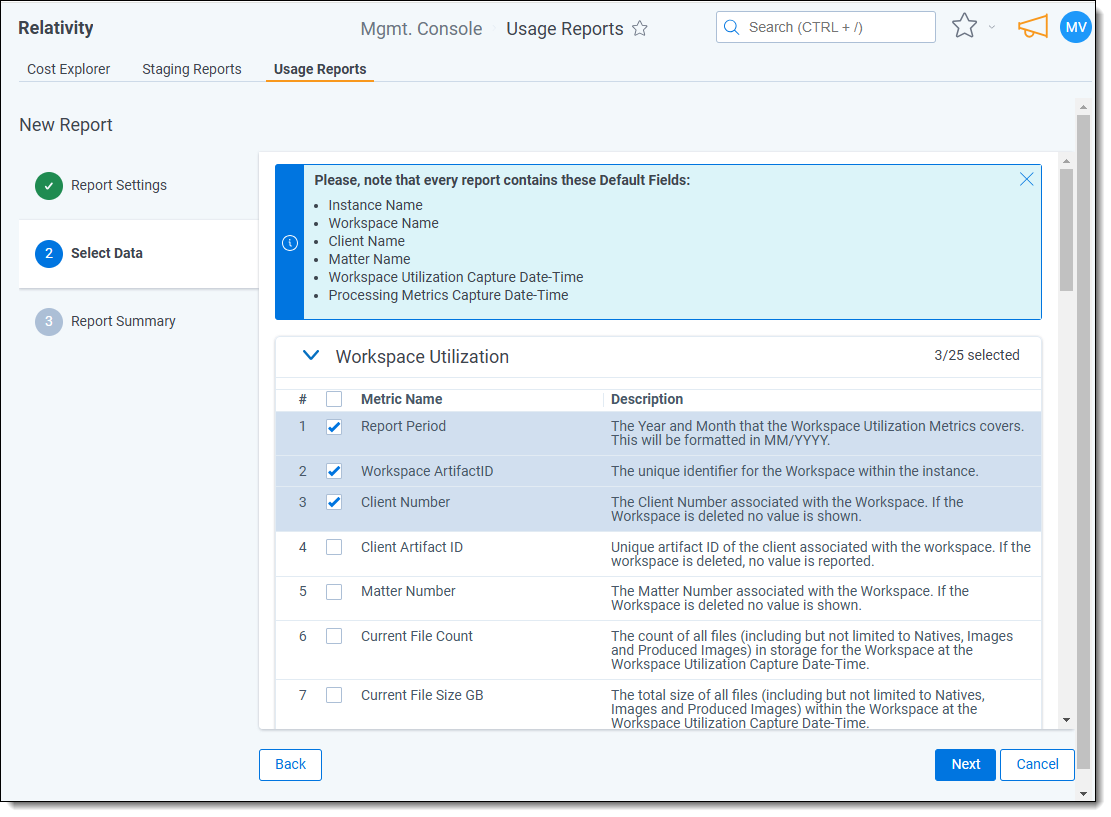
Every Workspace report will contain these fields by default:- Instance Name—the RelativityOne Instance from which the report was generated.
- Workspace Name—the name of the Workspace.
- Client Name—the name of the Client associated to the workspace. If the workspace is deleted, no value is shown.
- Matter Name—the name of the Matter associated to the workspace. If the workspace is deleted, no value is shown.
- Workspace Utilization Capture Date-Time—the date and time that all the Workspace Utilization metrics were captured from the Instance. This value is shown in UTC.
- Processing Metrics Capture Date-Time—the date and time that all the Processing metrics were captured from the Instance. This value is shown in UTC.
Every User report will contain these fields by default:- User Email Address—the RelativityOne Instance from which the report was generated.
- Enabled User Information Capture Date/Time—the name of the Workspace.
- Review the information on the Report Summary tab to confirm the report criteria is correct. To make changes, click the Back button or click any of the side tabs to go to those sections.
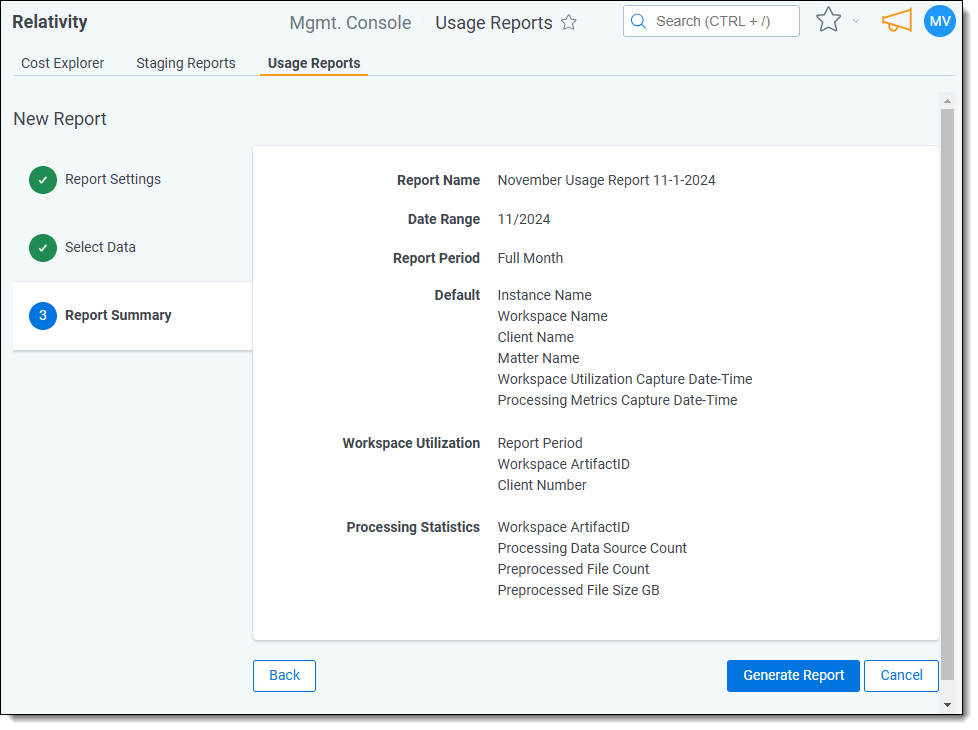
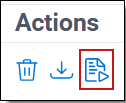
- Click Generate Report to create the report. The newly created report appears on the Usage Reports List. Reports are retained on the list for 30 days from their creation date. Click the template icon to run a Usage Report based on a previous report. The system automatically fills in all key fields. You can also use the actions bar to delete or download reports.
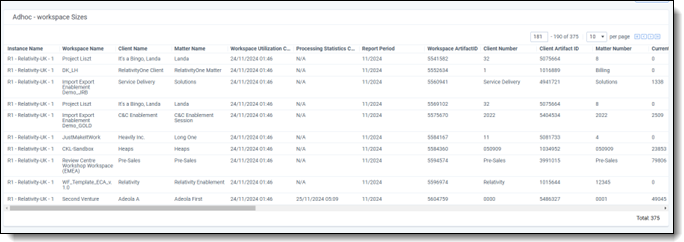
- Click the report name link to view its details in the report viewer. For a complete list of fields available in the Usage Reports, see Usage Report fields.
- All “Peak” references pertain to the individual peak value per workspace in the reported date range.
- Processing metric fields show the total size/values for the given date range.
- If Peak File Size [GB] appears larger than Peak Workspace Hosted Size [GB], this is expected. Peak File Size reflects all files stored in the workspace’s file share, including formats not used in billable size calculations. For billable hosting, only Natives, Images, and Production files contribute to Hosted Size.
- File categorization is as follows: Native files include Native and transcripts; Image files include TIFF and PDF files; and Production files include Stamped TIFF, produced PDF, and produced redacted natives.
- Depending on your security configurations in RelativityOne, some workspaces may display hashed values for Client Name, Matter Name, Client Number, and Matter Number fields. This happens when no processing occurs for a workspace and hashing is enabled. For more information, see Hash value instance settings for billing metrics.
Staging reports
The Staging Reports tab in Usage Reports lets System Administrators and Client Domain Administrators generate reports on staging folder size and file counts. For full details on creating and managing staging reports, see Staging reports.
Data freshness and expected delays
Usage Reports may not show data immediately after capture.
After the system captures usage metrics, it processes and aggregates the data before making it available in reports. This delay can take several hours. For example, if you run a report on the first day of the month and it returns no data, the system likely hasn’t started collecting data for that month. Wait a few hours and try again after the aggregation job finishes.
In rare cases, Usage Reports can be up to 48 hours behind the live system. This typically happens when:
- A report runs just before the nightly data-collection.
- The scheduled aggregation job for your instance hasn't finished yet.
Every report includes two time-stamp fields that show exactly when the data set was pulled:
Check these fields to confirm how current a given report is.
Exporting Usage Reports
You can export a report to an Excel file from the following areas:
- From the Usage Reports List: Click the download icon in the Actions column corresponding to the desired report.
- From the report viewer page: Click the Export button.
Usage Report Fields
The table below lists the complete set of fields currently available in the Management Console - Usage Reports product.
Usage Reports count all files stored in a workspace. Some file types may not appear as separate categories but are still included in total file counts and sizes.
Some Usage Reports fields present the same data as Billing Statistics Scripts. However, the fields have been renamed to make it easier to understand exactly what they report on. The old and new names are given below.
| Data Source | Field Name | Previous Billing Statistics Script Field Name | Description |
|---|---|---|---|
| Default Fields | Instance Name | None | The RelativityOne instance the report was generated from. |
| Default Fields | Workspace Name | None | The name of the workspace. |
| Default Fields | Client Name | None | The name of the client associated to the workspace. If the workspace is deleted, no value is shown. |
| Default Fields | Matter Name | None | The name of the matter associated to the workspace. If the workspace is deleted, no value is shown. |
| Default Fields | Workspace Utilization Capture Date-Time | None | The date/time that all the workspace utilization metrics were captured from the instance. This value is shown in UTC. |
| Default Fields | Processing Metrics Capture Date-Time | None | The date/time that all the processing metrics were captured from the instance. This value is shown in UTC. |
| Workspace Utilization | Report Period | Year Month | The month and year that the workspace utilization metrics covers. This will be formatted in month/year. |
| Workspace Utilization | Workspace ArtifactID | None | The unique identifier for the workspace within the instance. |
| Workspace Utilization | Client Number | None | The client number associated with the workspace. If the workspace is deleted, no value is shown. |
| Workspace Utilization | Client ArtifactID | None | The unique identifier for the client within the instance. |
| Workspace Utilization | Matter Number | None | The matter number associated with the workspace. If the workspace is deleted, no value is shown. |
| Workspace Utilization | Current File Count | None | The number of all files (including but not limited to natives, images and produced images) in storage for the workspace at the workspace utilization capture date-time. |
| Workspace Utilization | Current File Size [GB] | None | The combined size of all files stored in the workspace at the time of the utilization capture date-time, expressed in gigabytes (GB). This includes linked files from a repository workspace, natives, images, and produced images. |
| Workspace Utilization | Current Workspace Hosted Size [GB] | Current Billable File Size GB | The total size of all natives, images and produced images in the workspace at the workspace utilization capture date-time, in GB. This does not include files that have been imported using Integration Points when the import used "Links Only". |
| Workspace Utilization | Current Native File Size [GB] | None | The total size of all native files at the workspace utilization capture date-time, in GB. This includes native and transcript files. |
| Workspace Utilization | Current Image File Size [GB] | None | The total size of all image files at the workspace utilization capture date-time, in GB. This includes Tiff files and PDFs classified as PDF. |
| Workspace Utilization | Current Production File Size [GB] | None | The total size of all production files at the workspace utilization capture date-time, in GB. This includes stamped Tiff and PDFs classified as produced PDF and produced redacted native files. |
| Workspace Utilization | Current Document Count Text Only | None | The number of documents without native, images or produced images at the workspace utilization capture date-time. |
| Workspace Utilization | Activity Status | None | The status (active or inactive) of the workspace in the given time period. This status is determined solely by a single document view by any user; no other actions within the workspace affect its activity. |
| Workspace Utilization | Peak File Count | File Count | The largest number of all files (including but not limited to natives, images and produced images) in storage for the workspace within the given month. |
| Workspace Utilization | Peak File Size [GB] | File Size | Peak total size, in GB, of all files in the workspace, including files linked from another workspace. |
| Workspace Utilization | Peak Document Count | Document Count | The largest total document count within the workspace in the given month. |
| Workspace Utilization | Peak Document Count Text Only | Document Count Text Only | The largest total number of documents that do not have any associated natives, images or produced images within the workspace in the given month. |
| Workspace Utilization | Peak Workspace Hosted Size [GB] | Total Billable File Size | The peak size of all files in the workspace in GB. It does not count files promoted through Integration Points when the import used "Links Only." |
| Workspace Utilization | Peak Image File Size [GB] | Image File Size | The summed size of all image files from the same day as the peak workspace hosted size, in GB. This includes TIFF files and PDFs classified as image. |
| Workspace Utilization | Peak Native File Size [GB] | Native File Size | The total size of all native files and transcripts, in GB. The value is taken from the same day as the peak workspace hosted size. |
| Workspace Utilization | Peak Production File Size [GB] | Production File Size | The total size of all production files, in GB. The value is taken from the same day as the peak workspace hosted size. This includes stamped TIFF, produced PDF and produced redacted native files. |
| Workspace Utilization | Linked Total File Size [GB] | Linked Total Billable File Size | The total file size of all linked files in the workspace, in GB, at the workspace utilization capture date-time. Linked Total File Size is reporting on the size of linked natives, images and productions. Workspace data is linked using integration points. |
| Workspace Utilization | Linked Image File Size [GB] | None | The total image file size of data, in GB, linked to another workspace at the workspace utilization capture date-time. This includes TIFF files and PDFs classified as image. Workspace data is linked using integration points. |
| Workspace Utilization | Linked Production File Size [GB] | None | The size of production files, in GB, linked to another workspace at the workspace utilization capture date-time. This includes stamped TIFF, produced PDF, and produced redacted native files. Workspace data is linked using integration points. |
| Workspace Utilization | Workspace Type | None | The Workspace Type (data tier) for a given month, either Review, Repository or Cold Storage. |
| Workspace Utilization | Workspace State | None |
The system-defined state of the workspace at the time usage data was captured. Possible values are:
This field reflects the official system state used for billing purposes and is distinct from the user-modifiable Workspace Status field.
|
| Workspace Utilization | Workspace Status | Peak Status | This field reflects the official status assigned to the workspace object itself, which could be labeled anything like "Open," "Closed," "Archived," or something else defined by your organization. If a workspace was deleted during the month, it will show the last status value. |
| Workspace Utilization | Project Type | None | The project categorization set during workspace creation. |
| Workspace Utilization | Keywords | None | Any values present in the keywords field of the workspace |
| Workspace Utilization | Notes | None | Any values present in the notes field of the workspace |
| Product Utilization | Translate Document Units | None | The total number of document units processed using Relativity Translate. |
| Product Utilization | aiR for Review Documents | None | The total number of documents processed using aiR for Review. |
| Product Utilization | aiR for Privilege Documents | None | The total number of documents processed using aiR for Privilege |
| Product Utilization | aiR for Case Strategy Documents | None | The total amount of documents used for aiR for Case Strategy analysis |
| Product Utilization | Contracts Document Units | None | The total number of document units processed using Relativity Contracts. |
| Product Utilization | Current Data Breach File Size | None | The current size of data included in Data Breach Response. |
| Product Utilization | Peak Data Breach File Size | None | The maximum size of data included in Data Breach Response during the given month. |
| Product Utilization | PI Detect Document Units | None | The total number of document units processed using PI Detect. |
| Processing Metrics | Processing Data Source Count | None | The number of data sources for the processing set where the status is either “Completed” or “Completed with Errors”. |
| Processing Metrics | Preprocessed File Count | None | The number of all native files before extraction/decompression. |
| Processing Metrics | Preprocessed File Size [GB] | None | The sum of all the native file sizes, in GB, before extraction/decompression. |
| Processing Metrics | Container Count | None | The number of all native files classified as containers before extraction/decompression. This also includes nested containers that haven’t been extracted yet. |
| Processing Metrics | Container Size | None | The sum of all native file sizes, in GB, classified as containers before extraction/decompression. This value may be larger than the preprocessed file size because it also includes nested containers. |
| Processing Metrics | Inventoried Files | None | The number of all files found during an inventory run. |
| Processing Metrics | Nisted File Count | None | The number of all files denisted out during discovery. |
| Processing Metrics | Nisted File Size [GB] | None | The sum of all the file sizes, in GB, denisted out during discovery. |
| Processing Metrics | Filtered File Count | None | The number of all files excluded from discovery by way of an exclusion filter after inventory. |
| Processing Metrics | Filtered File Size [GB] | None | The sum of all the file sizes, in GB, excluded from discovery by way of an exclusion filter after inventory. |
| Processing Metrics | Discovered Document Count | None | The number of all the native files discovered that are not classified as containers. |
| Processing Metrics | Discovered Document Size [GB] | None | The sum of all native file sizes discovered, in GB, that are not classified as containers. |
| Processing Metrics | Duplicate File Count | None | The number of duplicate native files associated to the user, processing set and workspace. |
| Processing Metrics | Duplicate File Size [GB] | None | The sum of duplicate native file sizes, in GB, associated to the user, processing set and workspace. |
| Processing Metrics | Published Documents | None | The number of published native files associated to the user, processing set and workspace. |
| Processing Metrics | Published Document Size [GB] | None | The sum of published native file sizes, in GB, associated to the user, processing set and workspace. |
| Processing Metrics | Total File Count After Discovery | None | The number of all native files (including duplicates and containers) after decompression and extraction. |
| Processing Metrics | Total File Size After Discovery [GB] | None | The sum of all native file sizes (including duplicates and containers), in GB, after decompression and extraction. |
| Processing Metrics | Storage File Size After Publishing [GB] | None | The sum of all file sizes, in GB, after publishing. This is the total file size minus any files that were ingested twice. This value only counts the file once, ignoring duplicates. |
| Analytics Statistics | Analytics Documents Image-Only | CA Image Documents | The number of documents with images, but no natives, run through a conceptual analytics index or structured analytics set for the first time. |
| Analytics Statistics | Analytics Documents Native-Only | CA Native Documents | The number of native documents run through a conceptual analytics index or structured analytics set for first time. |
| Analytics Statistics | Analytics Documents Native Size [GB] | CA Native Size GB | The size of all native documents, in GB, run through a conceptual analytics index or structured analytics set for the first time. |
| Analytics Statistics | Analytics Documents Text-Only | CA Text Only Documents | The number of documents without an image or native that were run through a conceptual analytics index or structured analytics set for the first time. |
| Analytics Statistics | Analytics Total Documents | CA Total Documents | The total number of documents run through a conceptual analytics index or structured analytics set. |
| Infrastructure Statistics | Long Text Size [GB] | Data Grid File Size | The size of all Long Text data stored in Data Grid, in GB |
| Infrastructure Statistics | Peak SQL FT Size [GB] | SQL FT Size | The largest size of the disk space that is allocated to the index (the file group) in GB. This will be within 5-10% of the actual size of the index. To estimate the actual size of the Full Text Index, reduce the value reported by 5-10%. This value could fluctuate due to the day-to-day running of the platform. |
| Infrastructure Statistics | Peak LDF Size [GB] | LDF Size | The largest database log data file (LDF) size of the workspace in GB. This value could fluctuate due to the day-to-day running of the platform |
| Infrastructure Statistics | Peak MDF Size [GB] | MDF Size |
The largest database primary data file (MDF) size of the workspace in GB. This value could fluctuate due to the day-to-day running of the platform. |
The table below lists the complete set of fields for User Reports:
| Data Source | Field Name | Usage Reports Field Description |
|---|---|---|
| User Information | User Email Address | The email address associated to the user. |
| User Information | Enabled User Information Capture Date-Time | The date/time that the enabled user information were captured from the instance. The value is shown in UTC. |
| User Information | User ArtifactID | The unique identifier for the user within the instance. |
| Workspace Details | Is System Admin | Indicates whether the user is included in the “System Administrators” group in the given month. |
| Workspace Details | Last Relativity login Date-Time | The date/time that the user last logged into the Relativity instance. The value is shown in UTC. |
| Workspace Details | Workspace ArtifactID | The unique identifier for the workspace within the instance. Including this field creates a many-to-many relationship table between user information and workspace details. |
| Workspace Details | Workspace Name | The name of the workspace. Including this field creates a many-to-many relationship table between user information and workspace details. |
| Workspace Details | Client Name | The name of the client associated to the workspace. If the workspace is deleted, the client ArtifactID will show. Including this field creates a many-to-many relationship table between user information and workspace details. |
| Workspace Details | Matter Name | The name of the matter associated to the workspace. If the workspace is deleted, the matter ArtifactID will show. Including this field creates a many-to-many relationship table between user information and workspace details. |