


Feedback
Last date modified: 2026-Mar-20
Processing administration
Processing administration consists of managing active jobs and viewing processing history. You can manage active jobs via the Queue Management > Processing and Imaging Queue tabs. You will find the Queue Management tab on the Relativity home page. Access Processing History from your workspace menu options. You can also use the search bar to jump directly to either page.
Security considerations for processing administration
Feature Permissions provide an alternative to Relativity's security management by shifting the focus from Object Types and Tab Visibility to feature-based permissions. This method is an alternative option. Any feature-specific permissions information already in this and other topics is still applicable. The Feature Permissions interface enables administrators to manage permissions at the feature level, offering a more intuitive experience. By viewing granular permissions associated with each feature, administrators can ensure comprehensive control, ultimately reducing complexity and minimizing errors. For details see Instance-level permissions and Workspace-level permissions .
Consider the following items related to security and client domains (formerly multi-tenancy):
- If you are the system admin for a client domain environment, your tenants can only see jobs in their client domain. This eliminates the possibility of information leaks for workers that do not actually operate within your client domain.
- In client domain environments, users from one client domain cannot see workers from other client domains.
- In client domain environments, users from one client domain can only see work from their workspace. All other threads show an Item secured value for the Workspace field, and the rest of the columns are blank.
To change the priority of a job where Customer lockbox is enabled, you must be in a permission group having access to the workspace where the job originated, along with the System Administrator's group.
Only System Administrators can modify processing jobs on the Processing and Imaging Queue tab. Other users can see the Processing and Imaging Queue tab with instance level permissions, but see an error when attempting to modify processing jobs.
Groups do not have access to the Processing Administration tab or sub-tabs by default. To grant them access, perform the following steps:
- Use the search bar to navigate to the Instance Details tab.
- In the Security section, click Manage Permissions.
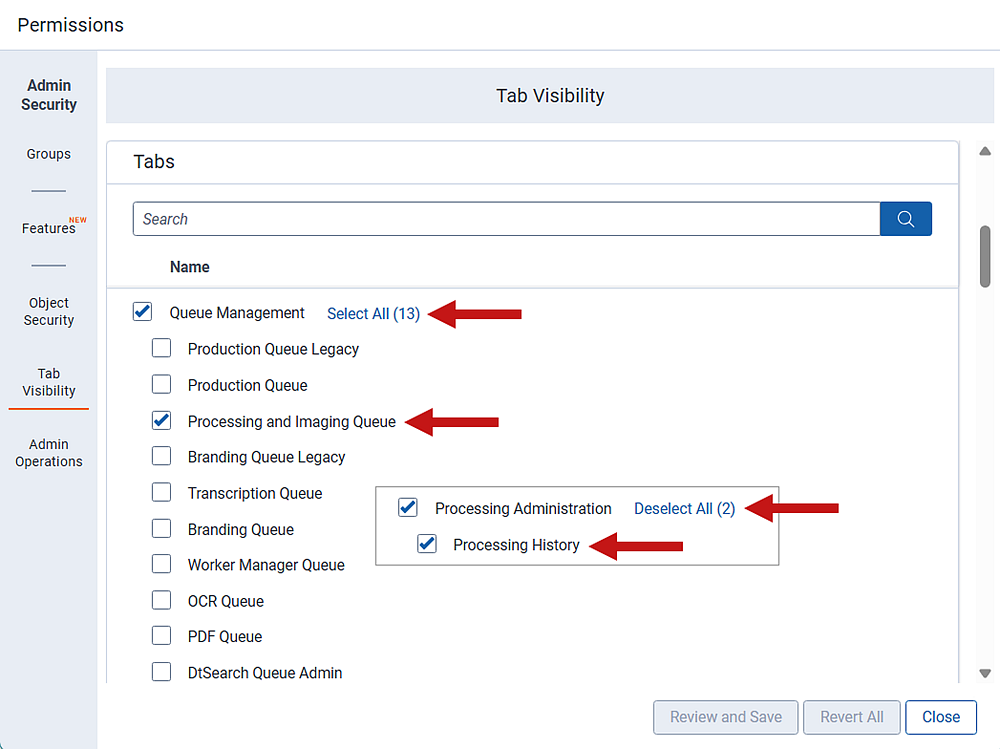
- In the Admin Security window, select Tab Visibility.
- From the Selected Group drop-down menu , select the group to grant access.
- Scroll to the Queue Management heading, then select Queue Management and Processing and Imaging Queue.
- Scroll to the Processing Administration heading, then select Processing Administration and Processing History.
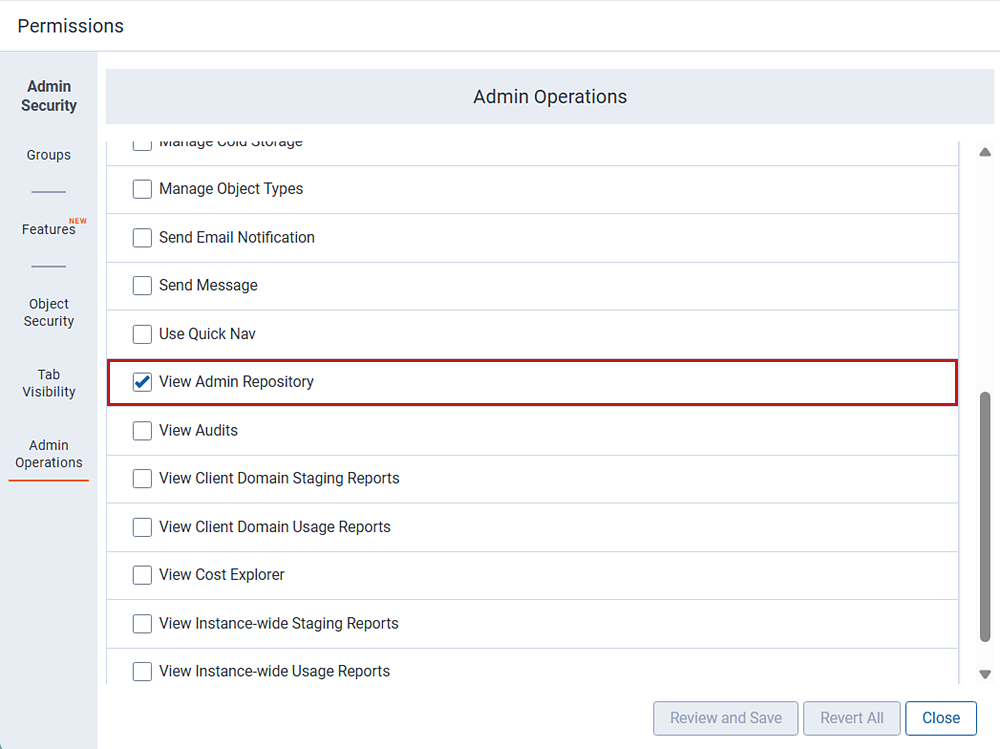
- Click the Admin Operations tab.
- Select View Admin Repository.
- Click Review and Save.
- Click Save.
Monitoring active jobs
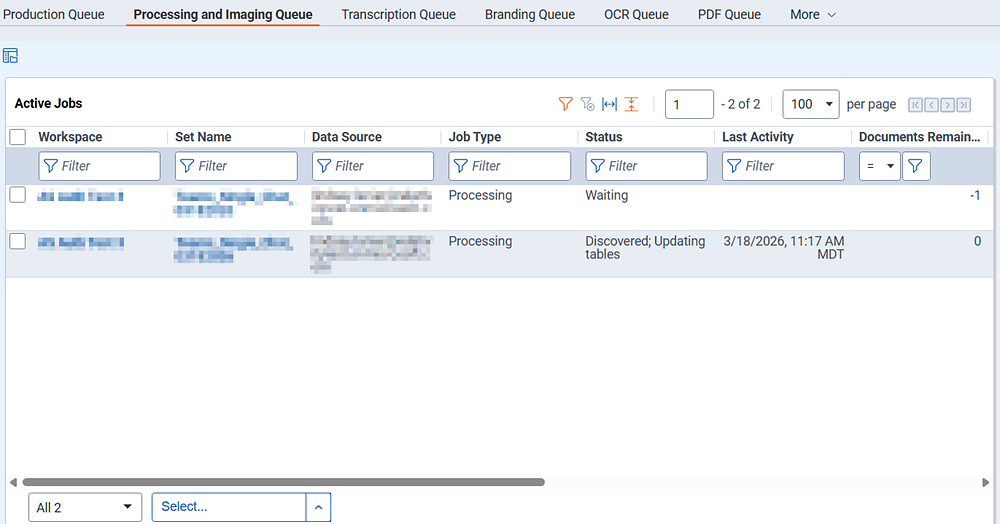
To see all active processing and imaging jobs in the environment, view the Active Jobs view in the Processing and Imaging Queue tab. If no jobs are visible in this view, it means there are no jobs currently running in the environment.
- Jobs that are running in workspaces to which you don't have permissions display the placeholder text "Item Secured" in the Active Jobs view. Actual job details are not visible. To permit visibility, see Workspace Security.
- The Workspaces tree on the left only contains workspaces in which an active job is currently running.
The following columns appear on Active Jobs view:
- Workspace—the workspace in which the job was created. Click the name of a workspace to navigate to the main tab in that workspace.
- Set Name—the name of the processing set. Click a set name to navigate to the Processing Set Layout on the Processing Sets tab. From here you can cancel publishing or edit the processing set.
- Data Source—the data source containing the files you're processing. This appears as either the name you gave the source when you created it or an artifact ID if you didn't provide a name.
- Job Type—the type of image job running, either imaging or processing.Filtering jobs aren't represented in the queue.
- Status—the status of the set. If you're unable to view the status of any processing jobs in your environment, check to make sure the Server Manager agent is running. This field could display any of the following status values:
- Waiting
- Canceling
- Finalizing
- Unavailable
- Inventorying
- Discover
- Publish
- Imaging
- Initializing
- Retrieving/Retrying Errors
- Submitting Job
- Last Activity—the date and time at which a job last communicated to the worker.
- Documents Remaining—the number of documents that have yet to be inventoried, discovered, or published. The value in this field goes down incrementally as data extraction progresses on the processing set.This column displays a value of -1 if you have clicked Inventory Files, Discover Files, or Publish Files and the job has not yet started.
- Priority—the order in which jobs in the queue are processed. Lower priority numbers result in higher priority. This is determined by the value of the Order field on the data source. You can change the priority of a data source with the Change Priority button at the bottom of the view. Changing the priority only changes the priority for that immediate job.
- Resources are split equally between processing sets of the same priority.Resource distribution is also considered at the Workspace level to make sure that all jobs are making progress.
- Discovery, publishing, and imaging jobs are multi-threaded and can run in parallel, depending on the number of agents available.
- Job types have the following priorities set by default:
- Imaging/TIFF-on-the-fly jobs have a priority of 1 by default and will always run first.
- Publishing jobs have a priority of 90 and will always run after any imaging on the fly jobs and before all other jobs.
- Inventory, Discovery, Mass Imaging/Imaging Set jobs all have a priority of 100 in the queue. These jobs have resources shared equally as long as they are the same priority.
- Resources are split equally between processing sets of the same priority.
- Job Paused—the Yes/No value indicates whether or not the job was paused. A paused job typically occurs if there is an issue with the processing agent. You cannot manually pause a processing job.
- Time Paused—the time at which the job was paused, based on local time.
- Failed Attempts—the number of times an automatic retry was attempted and failed.
- Submitted Date—the date and time the job was submitted, based on local time.
- Submitted By—the name of the user who submitted the job.
At the bottom of the screen, the active jobs mass operations buttons appear.
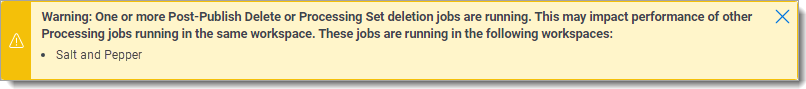
Post-publish delete job performance
Post-publish and processing set deletion jobs can impact system performance. If delete processes are running, you will see a warning banner indicating the possibility of performance impact and the workspaces affected.
Active jobs mass operations
A number of mass operations are available on the Active Jobs view.
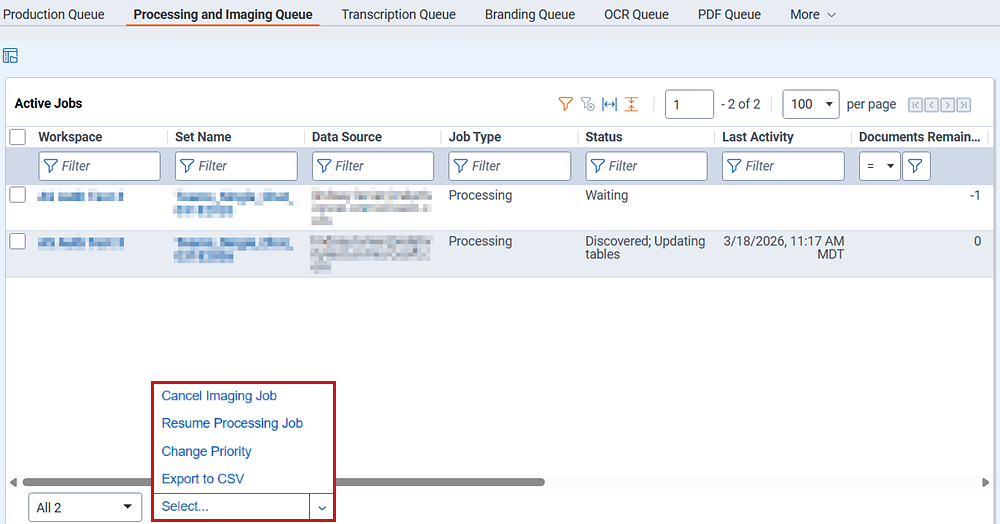
- Cancel Imaging Job—cancel an imaging job. If you have processing jobs selected when you click Cancel Imaging Job, the processing jobs are skipped over and are allowed to proceed. When you cancel an imaging job, it signals to the workers to finish their current batch of work, which may take a few minutes.
- Resume Processing Job—resumes any paused processing jobs that have exceeded the failed retry attempt count. You can resume multiple jobs at the same time. When you select this option, non-processing jobs are skipped, as are jobs that aren't currently paused.
- Change Priority—change the priority of processing jobs in the queue.
- When you click Change Priority, you must enter a new priority value in the Priority field. Then click Change Priority to proceed with change.
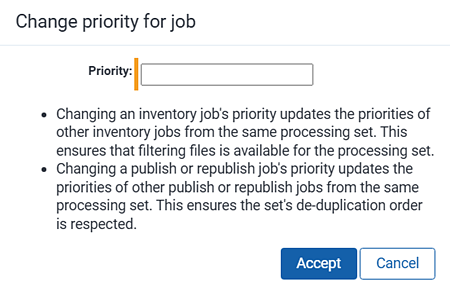
- If you change the priority of a publish or republish job, you update the priorities of other publish and republish jobs from the same processing set. This ensures that deduplication is performed in the order designated on the set.
- When you change the priority of an inventory job, you update the priorities of other inventory jobs from the same processing set. This ensures that filtering files is available as expected for the processing set.
- While there is no option to pause discovery, changing the priority of a discovery job is a viable alternative.
- Export to CSV—Export the Active Jobs list in CSV format.
- When you click Change Priority, you must enter a new priority value in the Priority field. Then click Change Priority to proceed with change.
Processing history
To view historical details of all processing actions taken on data sources within an environment, see Processing history.