


Feedback
Last date modified: 2026-Apr-07
Case Metrics
You must have valid Relativity Community credentials in order to download any Community file linked to the documentation site. You'll need to enter those credentials on the Community login screen if you're not already logged in. If you're already logged in to the Community at the time you click a link, the file is automatically downloaded in the bottom left corner of your screen. If you get an error message stating "URL No Longer Exists" after clicking a Community link, it may be due to a single sign-on error related to the SAML Assertion Validator, and you should contact your IT department.
The Case Metrics application is a bundle of three reports and a dashboard:
- Reviewer Choices Report - measures how reviewers code documents.
- Reviewer Statistics Report - measures how much time reviewers spend reviewing documents.
- Reviewer Overturn Report - measures accuracy of coding decisions.
- Reviewer Metrics dashboard - contains 4 interactive widgets that display reviewer performance information.
You can group these reports by users, groups, or workspaces at the instance level or you can group by matters and clients at the workspace level.
As a Client Domain Admin, when you load the Reviewer Metrics tab, you will only see data specific to the Client Domain to which you belong. The Reviewer Metrics tab is only available at the Workspace level and is the only component of Case Metrics that specifically accounts for Client Domains.
Special considerations for Case Metrics
Keep in mind the following when working with Case Metrics:
- For performance reasons, the Reviewer Choices and Reviewer Overturns reports rely on event handlers, instead of scanning for data stored in the SQL audit table. As a result, these reports only include coding decisions applied after the application is installed.
- The Reviewer Statistics report is the only report that analyzes coding decisions applied prior to installation.
- The Reviewer Choices report only reflects data after the installation of Case Metrics.
- The Reviewer Overturns report only reflects data after the installation of Case Metrics.
- It is recommended that you install the application as soon as you deploy the environment to make full use of the event handlers for capturing and reporting data.
- When filtering for workspaces in the reports, you will only see workspaces where Case Metrics has been installed.
- Case Metrics uses the audit date in UTC and does not have a time zone configuration available to it. The time zone settings are pulled from your local browser and that is included in the report request that is generated when you select to generate a report from Case Metrics. If your browser is set for EST, UTC will be converted to EST as part of that request and report accordingly. Browser time zones are determined by your local workstation's time zone settings.
Installing Case Metrics
You can install Case Metrics on both the instance level and workspace level. As of Case Metrics 2021.1.16, to report on a workspace, Case Metrics must be installed in that workspace.
Instance level installation and security configuration
If you see more than one version of the solution, select the most recent .rap to ensure you're deploying the most up-to-date solution. For RelativityOne, the most recent Server version of the Case Metrics application will be supported."
To download the application:
- Log in to the Relativity Community and click on the Relativity Applications folder.
- Locate the newest Case Metrics .rap file that is compatible with your version of Relativity and select it.The solutions in the Relativity Applications folder are sorted from most recently modified to oldest. As a result, solutions at the top of the page are normally the newest versions of the respective solutions. If you see more than one version of the solution, select the .rap file with the higher version number to ensure you're deploying the most up-to-date solution. For RelativityOne, the most recent Server version of Case Metrics is both supported and the optimal version.
- Click Download.
To install Case Metrics at the instance level:
- Navigate to the Application Library tab.
- Click New Library Application.
- On the Application File field, click Select File.
- Select the Case Metrics .rap file and click Open.
- Click Save.
- Once the application installation is complete, in the Workspaces Installed section, click Select.
- Choose at least one workspace from the list to ensure Case Metrics works at the instance level.
- Click the Move selected from left to right icon.
- Click Apply.
The selected workspaces have Case Metrics installed. A list of workspaces where the application has been installed displays in the Workspaces Installed section.
Instance level security configuration
To configure instance security for Case Metrics, you need to
- Ensure that users whom you want to use Case Metrics at the instance level are members of every group and workspace that you want them to be able to view data from.
- Grant instance permissions to each group that you want to be able to view Case Metrics at the instance level.
Feature Permissions provide an alternative to Relativity's security management by shifting the focus from Object Types and Tab Visibility to feature-based permissions. This method is an alternative option. Any feature-specific permissions information already in this and other topics is still applicable. The Feature Permissions interface enables administrators to manage permissions at the feature level, offering a more intuitive experience. By viewing granular permissions associated with each feature, administrators can ensure comprehensive control, ultimately reducing complexity and minimizing errors. For details see Instance-level permissions and Workspace-level permissions .
To configure instance permissions for Case Metrics:
- Navigate to the Instance Details tab.
- Click Manage Permissions.
- Click Edit Permissions for a group on the Group Management tab.
- Grant access to the instance permissions listed in the table.
Object Security Tab Visibility Admin Operations - N/A
- Case Metrics (parent)
- Reports (child)
- Scheduler (child)
- View Admin Repository
The Schedule (Add) permission as an object permission needs to be enabled for non-system admins to create scheduled reports.
As long as these permissions are set, non-system admins can have access to Case Metrics, but they can only report on workspaces and groups they have access to.
Workspace level installation and security configuration
To install Case Metrics at the workspace level:
- Navigate to the Application Library tab.
- Select Case Metrics from the list.
- Choose at least one workspace from the list where you wish to install Case Metrics.
- Click the Move selected from left to right icon.
- Click Apply.
The selected workspaces have Case Metrics installed. A list of workspaces where the application has been installed displays in the Workspaces Installed section.
Workspace level security configuration
To configure workspace level security, you need to
- Ensure that users whom you want to use Case Metrics are members of every group and workspace that you want them to be able to view data from.
- Grant workspace security permissions to each group that needs to use Case Metrics at the workspace level.
Feature Permissions provide an alternative to Relativity's security management by shifting the focus from Object Types and Tab Visibility to feature-based permissions. This method is an alternative option. Any feature-specific permissions information already in this and other topics is still applicable. The Feature Permissions interface enables administrators to manage permissions at the feature level, offering a more intuitive experience. By viewing granular permissions associated with each feature, administrators can ensure comprehensive control, ultimately reducing complexity and minimizing errors. For details see Instance-level permissions and Workspace-level permissions .
To configure workspace security permissions for Case Metrics:
- Navigate to the Instance Details tab.
- Click Manage Permissions.
- Click Edit Permissions for a group on the Group Management tab.
- Grant access to the instance permissions listed in the table.
Object Security Tab Visibility Admin Operations - N/A
- N/A
- View Admin Repository
- Navigate to the Workspace Details tab of the workspace where you would like to use Case Metrics.
- On the Relativity Utilities console, click Manage Workspace Permissions.
- Click Edit Permissions for a group on the Group Management tab.
- Grant access to the workspace security permissions listed in the table.
Object Security Tab Visibility Other Settings - N/A
- Case Metrics (parent)
- Reports (child)
- Reviewer Metrics (child)
- View All Audits
You must configure the workspace security permission in each workspace that you would like to use Case Metrics.
Reports
Once you install Case Metrics, the application creates the Reports and Scheduler tabs at the instance level. Additionally, while Case Metrics does create a Case Metrics tab at the instance level, this tab needs to be added to the Sidebar to be visible and accessible to users. Finally, Case Metrics creates the Reports and Reviewer Metrics tabs at the workspace level upon installation.
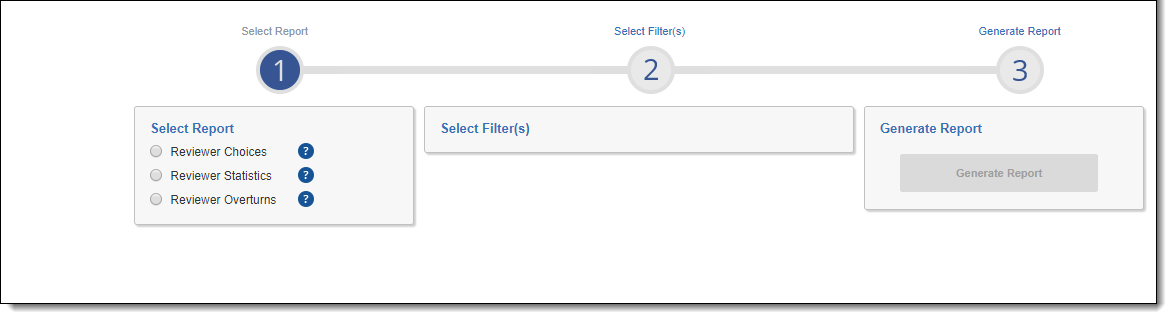
When you click on the Case Metrics tab, Case Metrics loads and you have the option of running three reports: Reviewer Choices, Reviewer Statistics, and Reviewer Overturn.
To run each report, select a filter source, fill out the required fields, and then click Generate Report. There are five filter sources to choose from: client, matter, workspace, group, or user. You can filter on multiple clients, matters, workspaces, groups, or users.
By default, Service Accounts and System Admins are excluded from Case Metrics reporting. You can include them by selecting the Include Service Accounts and/or the Include System Admins checkboxes.
The results for each report include tabs to display the Average by Reviewer and Average by filter source. You can compare individual reviewers against averages and standard deviations within a data set. With the Reviewer Choices and Reviewer Overturns report, the Average and Standard Deviation is based on the chosen field.
You can export spreadsheet or PDF versions of all the reports. When you select more than one workspace, the report includes an Averages table with aggregated values across the applicable workspaces, per reviewer. Upon export, you have the option to select a single tab of results. When multiple tabs are selected and exported to Excel, they become their own sheets.
You can also email report results by selecting the Email Report button next to the Export button.

To access report results, users must have access to the Case Metrics tab and to the workspace associated with the report.
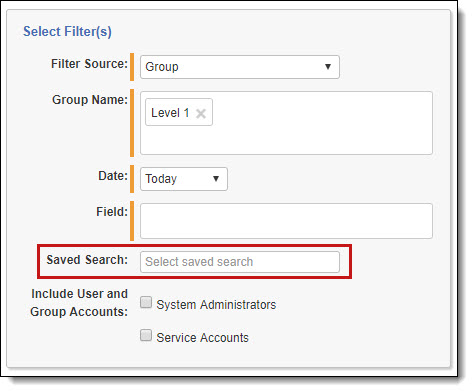
You can filter on a specific saved search within a workspace. If you want to filter on a saved search that spans multiple workspaces, make sure the saved search is consistently named across all workspaces.
When choosing to filter on a saved search, the results will only display filter sources in which the saved search appears.
You need to type two characters to pull back search results. It will only pull back the first 15 results. To narrow the search, type more characters.
Case Metrics profiles
You can also save filter sources as public or private profiles at the workspace or instance level.
To save filter sources as a profile:
- Select report, filters, and enter required fields.
- In the Profile section, check the box to Save as Profile.
- Enter the Profile Name.
- Select the Owner, whether it is a specific user, a system administrator, or public. Or, click Me to assign it to yourself.
- Click Save as new Profile.
To access a saved profile:
- Navigate to Case Metrics.
- Under Select Report, there is a grayed-out drop-down option. Select this option to unlock the drop down.
- In the Select Report section, choose the saved profile you would like to use to run your report.
- Click Generate Report.
To edit a profile:
- Select the profile from the saved profiles drop-down list.
- Make your changes in the Select Filter(s) section.
- Click Update Profile.
To delete a profile, hover over the profile you want to delete and click the Delete icon.
Reviewer Choices Report
Coding documents multiple times may result in a total number returned in the report that is higher than the actual documents.
The Reviewer Choices Report shows coding decisions by reviewer for the following field types in your workspaces: Single Choice, Multiple Choice, and Yes/No. If you run the report on a single workspace, the report displays a bar chart as shown below.
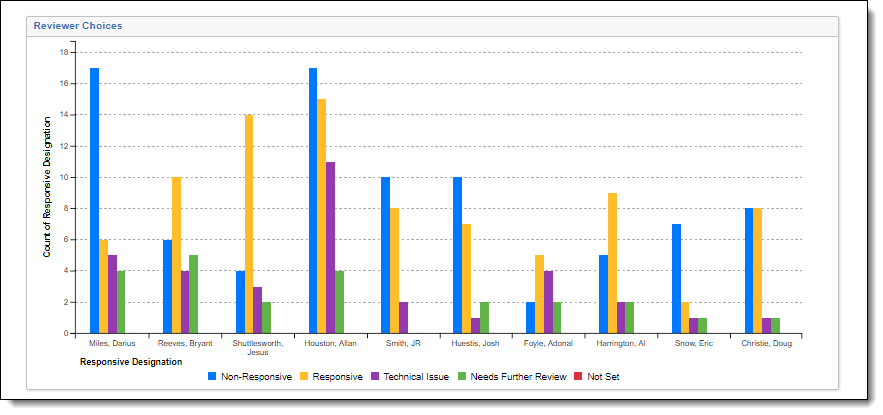
If you run the report on multiple workspaces and select a Choice field that does not exist in all workspaces, no data will appear for those workspaces which don't have the Choice field selected.
Once you choose a filter source, fill out the following report filters:
- Filter Source Name - select a single or multiple client(s), matter(s), workspace(s), group(s), or user(s).
- Date - select from seven different date ranges, including: Today, Yesterday, This Week, Last Week, This Month, Last Month, or a Custom Start and End Date.Selecting This Week will include Monday of the current week to the current day. Selecting Last Week will include Monday of the previous week to Sunday.
- Field - select the field(s) for which you'd like to run the report.
- Saved Search - select a saved search for which you'd like to run the report.
The Reviewer Choices report does not include documents coded via Propagation or Mass Edits.
Reviewer Statistics Report
We do not recommend running Reviewer Statistics report if you have a large number of audit records in a workspace. Doing so may result in an error or the report will not show any results.
The Reviewer Statistics Report shows the efficiency of reviewers and how many documents were reviewed over a specified date range. This report records Document Edits/Views regardless of field and is not based on user login or user logout.
The Reviewer Statistics script is now compatible with audits stored in Data Grid. If your workspace is Data Grid-enabled, Reviewer Statistics pulls data from Audit.
To generate the Reviewer Statistics report:
- Navigate to the Reports tab, which is a child tab of Case Metrics.
- Select Reviewer Statistics.
- Choose the filters for your report. Filters include:
- Filter Source - select a single or multiple client(s), matter(s), workspace(s), group(s), or user(s).
- Date - select from seven different date ranges, including: Today, Yesterday, This Week, Last Week, This Month, Last Month, or a Custom Start and End Date.Selecting This Week will include Monday of the current week to the current day. Selecting Last Week will include Monday of the previous week to Sunday.
- Saved Search - select a saved search for which you'd like to run the report.
- Include Mass Edits - check this box if you would like to track mass edits.
- Include Propagation - check this box if you would like to track propagations.
- Include System Administrators - check this box if you would like to include system administrators.
- Include Service Accounts - check this box if you would like to include service accounts.
- Saved Search - select a saved search for which you'd like to run the report.
- Select Save as profile if you want to save the selected filters as a profile option. For more information, see Save as Profile.
- Click Generate Report.
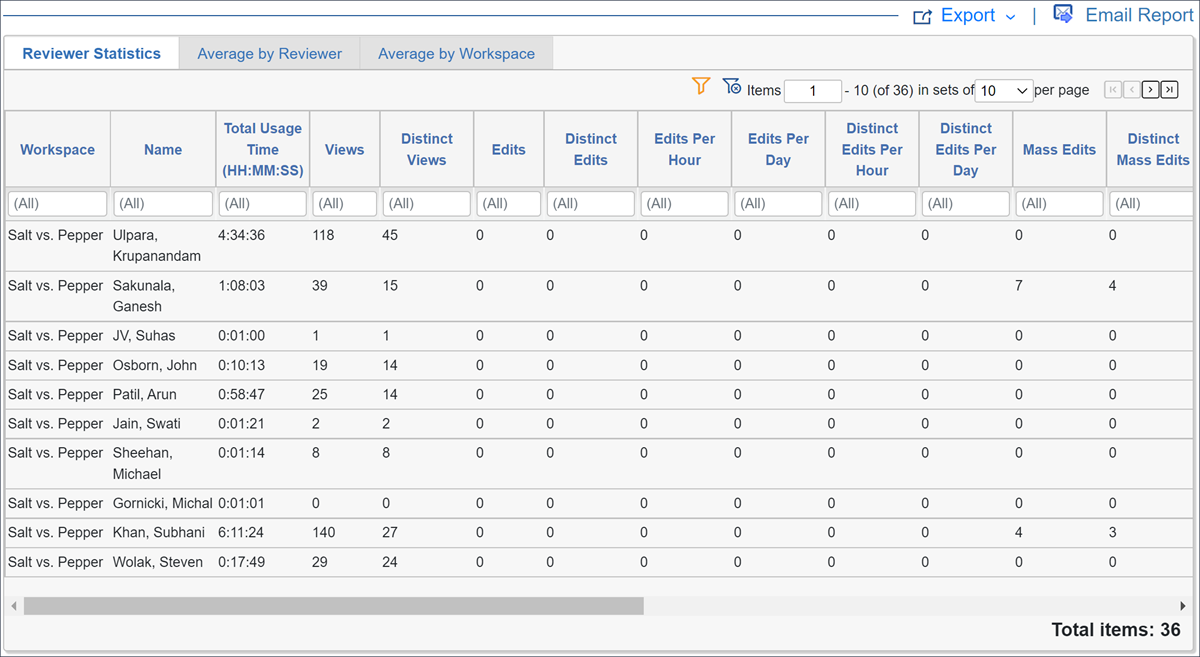
The Reviewer Statistics report is comprised of three tabs:
- Reviewer Statistics - tallies and returns views, edits, mass edits, and average file size edited by reviewer.
- Average by Reviewer - groups reviewers by client, matter, workspace, and user and then by reviewer ID to calculate the average.
- Average by Workspace - shows the averages for fields. For each field, Relativity adds the values higher than zero and then divides them by the number of entries for that field.
The Reviewer Statistics report contains the following columns on all three tabs:
- Workspace - identifies the workspace on which you are reporting.
- Name - identifies the user or group who reviewed documents.
- Total Usage Time - calculates the time between groups of View, Edit, Mass Edits, and/or Propagation actions only on documents in the workspace. This data is not intended to track billable hours and using it in this manner will likely result in inaccurate billing information.
A group starts at the timestamp of the first action and ends at the timestamp of the last action for that group. The last action is the first of two actions that have timestamps more than the Downtime Threshold apart. The Downtime Threshold is defaulted to sixty minutes and is used to remove long idle periods from the Total Usage Time calculation. The total time between each groups start and end timestamps is summed to calculate the Total Usage Time. The time between the groups is excluded in the Total Usage Time. Any other actions outside of these four in the Viewer may not be considered in the calculation. The same is true when switching between workspaces. - Views - retrieves a report on the amount of views completed in the Usage Time. The action taken on account on the audit is “view.”
- Distinct Views - retrieves a report on the amount of distinct views completed in the Usage Time. To count as distinct, the view must occur only once on one document. For example, if you viewed a document five times, that counts as five Views and one Distinct View. The action taken on account on the audit is “view.”
- Edits - retrieves a report on the amount of edits completed in the Usage Time. The actions taken on account on the audit are “update" and "delete."
- Distinct Edits - retrieves a report on the amount of distinct edits completed in the Usage Time. To count as distinct, the edit must occur only once on one document. For example, if you edited a document five times, that counts as five Edits and one Distinct Edit. The actions taken on account on the audit are “update" and "delete."
- Edits Per Hour - retrieves a report on the amount of edits completed, grouped by hour. The actions taken on account on the audit are "update" and "delete." This is calculated by dividing the actions total usage time by one hour.
- Edits Per Day - retrieves a report on the amount of edits completed, grouped by day. This is calculated over the number of days in the date range you selected to run your report. The actions taken on account on the audit are “update" and "delete."
- Distinct Edits Per Hour - retrieves a report on the amount of distinct edits completed, grouped by hour. To count as distinct, the edits must occur only once on one document. For example, if you edited a document five times, that counts as five Edits and one Distinct Edit.The actions taken on account on the audit are “update" and "delete." This is calculated by dividing the actions total usage time by one hour.
- Distinct Edits Per Day - retrieves a report on the amount of distinct edits completed, grouped by day. To count as distinct, the edits must occur only once on one document. For example, if you edited a document five times, that counts as five Edits and one Distinct Edit. This is calculated over the number of days in the date range you selected to run your report. The actions taken on account on the audit are “update" and "delete."
- Mass Edits - retrieves a report on the amount of mass edits completed in the Usage Time.
- Distinct Mass Edits - retrieves a report on the amount of distinct mass edits completed in the Usage Time. To count as distinct, the edits must occur only once on one set of documents.
- Mass Edits Per Hour - retrieves a report on the amount of mass edits completed, grouped by hour. This is calculated by dividing the actions total usage time by one hour.
- Mass Edits Per Day- retrieves a report on the amount of mass edits completed, grouped by day. This is calculated over the number of days in the date range you selected to run your report
- Distinct Mass Edits Per Hour - retrieves a report on the amount of distinct mass edits completed, grouped by hour. To count as distinct, the edits must occur only once on one set of documents. This is calculated by dividing the actions total usage time by one hour.
- Distinct Mass Edits Per Day - retrieves a report on the amount of distinct mass edits completed, grouped by day. To count as distinct, the edits must occur only once on one set of documents. This is calculated over the number of days in the date range you selected to run your report
- Propagations - retrieves a report on the amount of propagations completed in the Usage Time.Mass edits and propagations are separate operations from edits and do not equal total edits.
- Distinct Propagation- retrieves a report on the amount of distinct propagations completed in the Usage Time. To count as distinct, the propagation must occur only once on one document.
- Propagations Per Hour- retrieves a report on the amount of propagations completed, grouped by hour. This is calculated by dividing the actions total usage time by one hour.
- Propagations Per Day- retrieves a report on the amount of propagations completed, grouped by day. This is calculated over the number of days in the date range you selected to run your report
- Distinct Propagations Per Hour- retrieves a report on the amount of distinct propagations completed, grouped by hour. To count as distinct, the propagations must occur only once on one document. This is calculated by dividing the actions total usage time by one hour.
- Distinct Propagations Per Day- retrieves a report on the amount of distinct propagations completed, grouped by day. This is calculated over the number of days in the date range you selected to run your report
- Average Extracted Text Size - retrieves the average extracted text size of documents edited by the reviewer.
Reviewer Statistics Report in repository workspaces
The Reviewer Statistics Report is not available in repository workspaces but can be run at the instance-level.
To run the Reviewer Statistics Report at the instance-level:
- At the instance-level, navigate to the Case Metrics tab. This tab needs to be added to the Sidebar to be visible and accessible to users.
- In the Select Report section, select Reviewer Statistics.
- In the Select Filter(s) section, select Workspace for the Filter Source field.
- Click on the Workspace Name field, select the desired repository workspace from the drop-down menu.
- Optionally, select a report interval option on the Date drop-down menu.
- Optionally, select any of the desired Include: filter options.
- Click Generate Report.
The Reviewer Statistics Report is generated with information from the selected repository workspace.
Reviewer Overturn Report
The Reviewer Overturn Report shows documents overturned and the reviewers who made those changes. An overturn occurs when a reviewer overrides the previous coding decision on a document. The Reviewer Overturn Report reports on the following field types:
- Multiple choice
- Single choice
- Yes/No
The Overturn Report does not capture mass editing or propagation.
Once you choose a filter source, fill out the following report filters:
- Filter Source Name - select a single or multiple client(s), matter(s), workspace(s), group(s), or user(s).
- Date - select from seven different date ranges, including: Today, Yesterday, This Week, Last Week, This Month, Last Month, or a Custom Start and End Date.Selecting This Week will include Monday of the current week to the current day. Selecting Last Week will include Monday of the previous week to Sunday.
- Field - select the field(s) for which you'd like to run the report.
- Saved Search - select a saved search for which you'd like to run the report.
- Includes Self-Overturns - check this box if you would like to track changes to a coding decision made by the same reviewer.
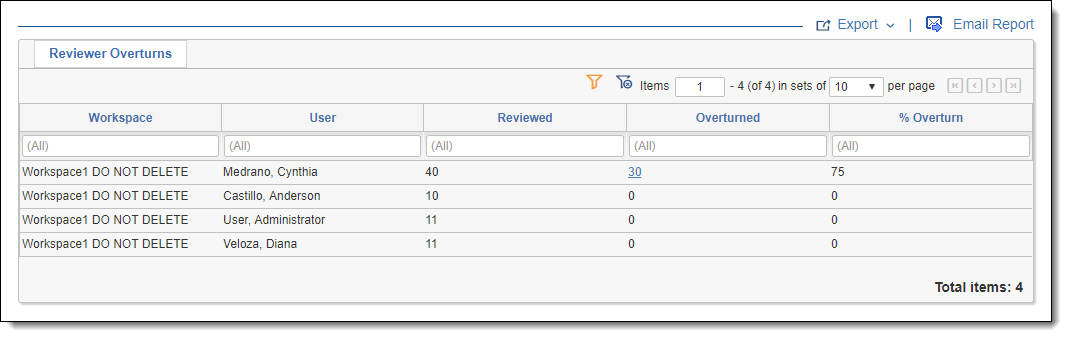
The Reviewer Overturn Report contains the following columns:
- Workspace - identifies the workspace on which you are reporting.
- User - identifies the user or group who made the changes.
- Reviewed - counts the number of times a reviewer or group has made an edit on the field the report is based on.
- Overturned - counts overturns for the reviewer or group that previously coded the document before it was overturned. Please note that it's possible for a reviewer to overturn their original coding decision. Overturn counts appear as a hyperlink to a pop-up that contains the following information:
- Document Identifier - identifies the name of the document a reviewer or group coded. The name appears as a hyperlink that opens the document in a standalone viewer.
- Original Coding Value - contains the original coding value.
- New Coding Value - contains the new coding value.
- Overturned By - contains the name of the reviewer or group that changed the document's coding value.
- Date - contains the date and time the reviewer or group changed the document's coding value.
- % Overturn - calculates the percentage of documents overturned.
Reviewer Metrics dashboard
The Reviewer Metrics dashboard works with Relativity Data Grid and SQL server databases.
The Reviewer Metrics dashboard consists of 4 interactive and customizable, reviewer performance widgets:
- Total Usage Time per User - a graph showing the percentage of time a user spent completing Edit, Mass Edits, and/or Propagation actions during the specified period. The widget rounds to the nearest hour. This data is not intended to track billable hours and using it in this manner will likely result in inaccurate billing information.
A group starts at the timestamp of the first action and ends at the timestamp of the last action for that group. The last action is the first of two actions that have timestamps more than the Downtime Threshold apart. The Downtime Threshold is defaulted to sixty minutes and is used to remove long idle periods from the Total Usage Time calculation. The total time between each groups start and end timestamps is summed to calculate the Total Usage Time. The time between the groups is excluded in the Total Usage Time. Any other actions outside of these four in the Viewer may not be considered in the calculation. The same is true when switching between workspaces.
- Distinct Edits per Hours per User - a graph showing the number of distinct edits a user completes each hour. The results are calculated using the average number of documents reviewed at each specific hour over the course of the specified time. The time is reflected in military time.
- Distinct Edits per Reviewer - a graph showing the number of distinct edits a reviewer makes.
- Extracted Text by User - a graph showing the average file size of documents edited by the reviewer. The file size is measured in kilobytes.
When you hover your mouse over a slice on a widget, that slice's information appears.
The Reviewer Metrics tab contains 5 views, which specify what time period the widgets pull their data from. Views include:
- Reviewer Metrics – This Week - a view that displays data from the current week beginning on Sunday.
- Reviewer Metrics – This Month - a view that displays data for the current month.
- Reviewer Metrics – Last Week - a view that displays data for the 7 day period that ended 7 days ago.
- Reviewer Metrics – Last 7 Days - a view that displays data from the last 7 days.
- Reviewer Metrics – Last 30 Days - a view that displays data from the last 30 days.
Custom views and pivots are currently not supported by Reviewer Metrics. Filtering and exporting is also not currently supported.
Using the Scheduler
With the Case Metrics Scheduler, you have the ability to run reports at scheduled intervals and send those reports to a list of recipients.
You can use the Case Metrics Scheduler to run reports at scheduled intervals and send those reports to a list of recipients.
- The Scheduler only works at the instance level. It does not work at the workspace level.
- The scheduled report is sent as an attached PDF file in an email.
- The Scheduler will not send a report if there is no data for the date range selected.
To create or edit a scheduled report:
- Navigate to the Scheduler tab.
- Click New Schedule or edit an existing schedule.
- Complete the fields in the Scheduled Report layout. See Scheduled Report layout fields.
- Click Save. The report is scheduled to send.
Scheduled Report layout fields
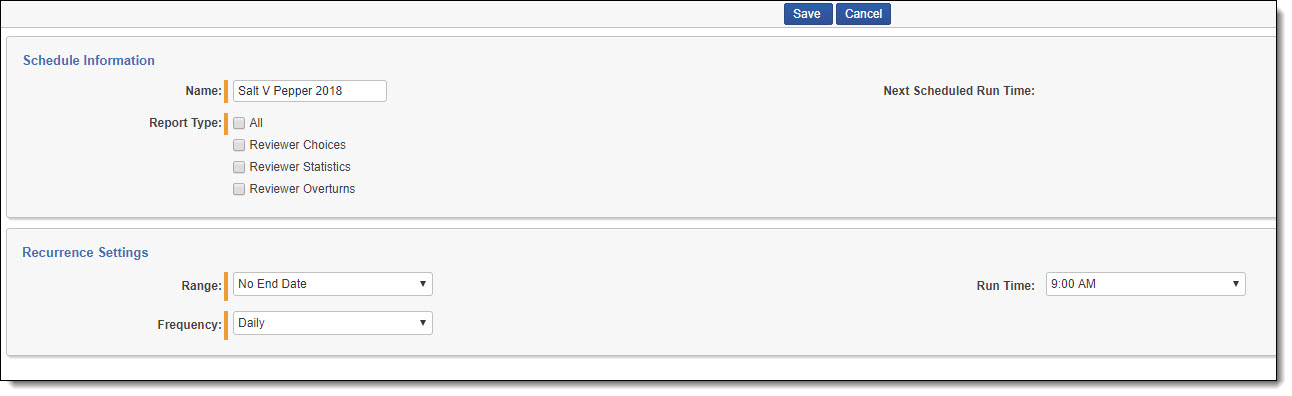
Schedule Information
The Schedule Information section has the following fields:
- Name - enter the name of the scheduled report.
- Report Type - select which report(s) you want to include in the scheduled report.
- Email Recipients - enter the emails of the list of recipients.
Depending on which report(s) you select, you will have to complete the fields that appear for each report type. For more information see the following reports:
Recurrence Settings
- Range - select the time range for which you would like to run the scheduled report, including No End Date, Fixed Number of Occurrences, or Fixed End Date.
- Frequency - Select how often you would like to run the scheduled report from five frequencies, including Daily, Weekly, Biweekly, Monthly, and Yearly.
- Scheduled Time - Select the specific time at which you would like to run the report. This time is synchronized with the Scheduler Dispatcher agent's date and time.