


Feedback
Last date modified: 2026-Feb-05
Working with the Timeline Builder
You can use the Timeline Builder to visualize the chronology of facts. Being able to visualize the chronology of Facts adds value during the stages of a case life cycle.
You can use timeline reports to:
- Document the basic flow of events after an initial client consultation.
- Identify behavioral patterns that aid case strategy development.
- Pinpoint where to search for documents during discovery.
- Prepare witnesses for deposition.
- Serve as a color-coded illustrative exhibit during trial.
Creating a Timeline Report
To create a Timeline Report:
- Navigate to the Timeline Builder tab.
- Enter the following fields:
- Name - Enter the desired name for the timeline.
- Report Title - Enter the desired name for the report.
- Show Report Title - Optionally, select if you want to include the Report Title on the report.
- Optionally, enter Conditions based on a selected field. Custom fields of type File, Currency, Decimal, and User are not supported when adding conditions.For example, the following condition returns all applicable facts to the selected users.
- Field - Key Entities.
- Operator - any of these.
- Value - click Select icon to select the available values. In this case, users.
- AND or OR Operators - use these operators to connect the criterion in each row.
- Optionally, click Add another condition to build out your conditions, and select AND or OR between multiple conditions to set additional logic.
- Click Save.
- If you did not add conditions, you can display existing facts in the timeline by clicking Link/Unlink.
The Select Fact modal displays. - Select the desired facts from the list, click Move selected from left to right, and then click Apply.
- To add a new Fact, click Add New.
- Fill in the fields in the pop-up and click Save. Fields include:
- Fact - A brief title for the fact.
Optionally, type the @ symbol followed by one or more letters to bring up the type ahead feature. Case Dynamics presents a pop-up list of Entities based on the letters you type. Click the name of the Key Person or Key Organization to add them to the details of your Fact. - Date Type - Designates whether the event occurred on or around a single date, or between two dates.
- Primary Fact Date - Denotes the date when the fact occurred, or the start date for an event that occurred between certain dates. You can also select a specific time.
- End Date - Records the completion of a fact that took place over a period of greater than one day. You can also select a specific time.
- Timeline Color - Optionally, select a color to apply to the new fact.
If a user assigns a Fact Color earlier in their workflows, the selection will automatically be applied if that fact is generated on a timeline. - Fact - A brief title for the fact.
Click Saved Report(s) to access all other Case Dynamics reports.
Timeline Builder options
The following Timeline Builder options are available to customize your Timeline report. The option is orange when selected and blue when de-selected.
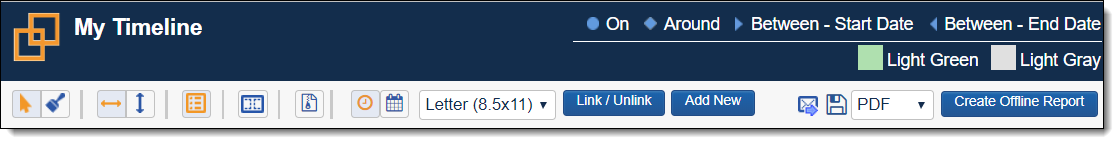
- Draw Mode - This is the default mode, click and drag facts around on the timeline to your specification.
- Paint Mode - Select this mode to apply a color to a fact.
- Horizontal Timeline - This is the default display mode, and displays the timeline horizontally.
- Vertical Timeline. - Display the timeline vertically.
- Enable/Disable Color Legend - Select this mode to show/hide the color legend. Only used colors appear in the legend.
- Enable /Disable Borders - Select this mode to enable the dotted border guidelines when saving the report to a PDF. Any fact outside of the border won't appear in the PDF report.
- To edit a color name, click the color in the legend and enter a new name.
- Compress - Select this mode to compress the number of facts that fit on your timeline.
- Organize by Time - Select this mode to organize facts on the timeline by time.
- Organize by Date - Select this mode to organize facts on the timeline by date.
- Email - Email the Timeline report URL to someone. The person that you send this email to must have Relativity access.
- Export - Export the report in the selected file type format (PDF, .xls, .csv, image). For .xls exports, the report columns that appear here are controlled by the Timeline Facts view in the Facts sub-tab. For image exports, reports are saved as a JPG.
- Create Offline Report - Select this button to create your offline report containing all of the pre-selected facts from your timeline report. See Working with the Timeline Builder.
For a fact that spans two or more weeks, the timeline:
- Lists the fact twice, once at the fact's start date and once at the fact's end date.
- Includes arrows between the fact's start and end dates.
- Displays three dots between the fact's start and end dates.
- Highlights the fact in yellow when you hover your mouse over the fact.

Applying a color to a fact
To apply a color to a fact on the timeline:
- Click the Paint Mode icon.
- Select a color from the palette.
- Locate and click the fact that you wish to change color.
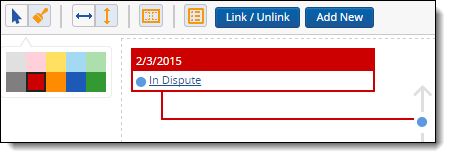
To change the fact to a different color, repeat steps 2-3.
You can select the default light gray color to "reset" the fact color.