


Feedback
Last date modified: 2026-Apr-13
Log Extractor
Log Extractor is still available at this time. However, as Relativity continues to evolve, we recommend using External Logging, which provides greater flexibility, deeper analysis, and more control over your logging solution. See Using External Logging for details.
In RelativityOne, you can use the log extractor to access logs for a custom application. You can view logs for a date range of seven days or less, which your custom application has generated in the last 21 days. The log extractor accesses the logs and displays them as JSON output on a new tab in your browser where you can view or download them.
- The Log Extractor is not supported in RelativityOne Government environments.
- The Log Extractor is not available in legacy RelativityOne Sandbox environments, but it is available in "next-generation" RelativityOne Sandbox environments. If you are using a legacy Sandbox environment, you can retrieve log information from the EDDSLogging database. To determine which type of Sandbox environment you are using, inspect the environment URL: if it is in the format https://[customer name]-[EA/Current]-sandbox.relativity.one it is a legacy sandbox environment. If the URL is the in format https://[customer name]-development.relativity.one, then you are using a "next-generation" sandbox environment and the Log Extractor is available for use.
- The EDDSLogging database is only accessible in legacy sandbox environments. If you attempt to open the EDDSLogging database in a new-generation sandbox environment, you will likely get an error like "The database EDDSLogging is not accessible."
Data Logging Security
Follow good security practices when writing and retrieving logs to minimize data exposure:
- Consult the data owner on data disclosure before logging.
- Log data according to the data owner's data policy (Relativity recommends logging only the identifiers. Avoid logging names, private information, and sensitive information).
- Log only minimally necessary data.
- Notify Relativity support if a data exposure incident is identified.
Required permissions
To utilize the log extractor, you must have system admin permissions in RelativityOne.
Creating a log request for a custom application
Use the following steps to create a log request for a custom application.
Before using log extractor, confirm that your custom application has logging configured properly. For more information, see Log from a Relativity application on the RelativityOne Developers site.
- Navigate to the Log Extractor tab in RelativityOne.
- Click New Application Log Request.
- Click Select to choose an application.
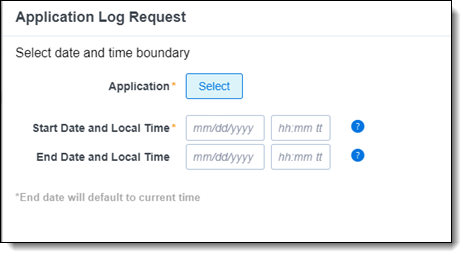
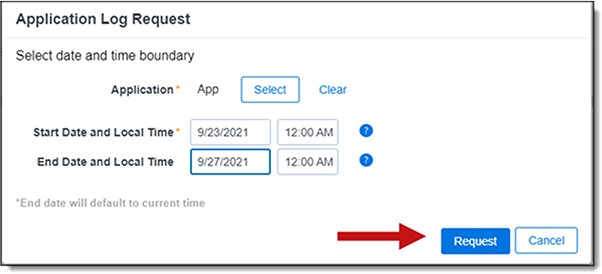
- Select a Start Date, End Date, and Local Time for each date.
- Format your local time in your current time zone. The log extractor returns results in the UTC time format.
- Don't enter a date more than 21 days old.
- Make sure the total time between the start and end dates is seven days or less.
- Click Request to submit your new application log request.
The Logs field is populated with the View and Download (Azure) link when the workflow completes and the page refreshes.
The Status field is populated as follows:- Requested - indicates a log extractor job is requested.
- In Progress - indicates logs are being extracted.
- Complete - indicates the logs are extracted. The View and Download (Azure) link is now available.The links to log requests expire after seven days. For more information, see Log lifespan.
- Click View and Download (Azure). A new tab opens and displays the data in JSON format. See the following example of JSON output:
{"timestamp": 1632417817000,"severity.text": "Error","severity.number": 17,"message": "Error was encountered getting message from a batch of type {typeName}","exception.message": "Relativity.ServiceBus.Contracts.Exceptions.TransientException: Error during communication with Service Bus. Check the connection information, then retry.","exception.stacktrace": "Microsoft.ServiceBus.Messaging.MessagingCommunicationException: Error during communication with Service Bus. Check the connection information, then retry. ---> System.ServiceModel.CommunicationObjectFaultedException: ...","exception.type": "Microsoft.ServiceBus.Messaging.MessagingCommunicationException","typeName": "DynamicReviewDocumentMessage","OperationContext.ExecutingAgent": "Active Learning Worker","OperationID": "|bbb7b777-7777777b777b7777.","SourceContext": "Analytics.ActiveLearning.Agents.MessageHandlers.BaseMessageHandlers. BatchedMessageHandlerBase`1[[Relativity.Core.DTO.DynamicReviewDocumentMessage, Relativity. Core, Version=47.2.6.0, Culture=neutral, PublicKeyToken=null]]","SourceID": "b7b77b7b-7777-77bb-b7b7-77b777bb77bb","r1.source.id": "b7b77b7b-7777-77bb-b7b7-77b777bb77bb","MachineName": "aa999aaa999999","host.name": "aa999aaa999999","AppDomain": 55,"Application": "bbb7bb7b-7777-7b77-bb7b-7b77b777bbb7","application.guid": "bbb7bb7b-7777-7b77-bb7b-7b77b777bbb7","application.name": "My Application","SubSystem": "CustomAgent","r1.subsystem": "CustomAgent","System": "Agent","r1.system": "Agent","ProcessId": 7777,"process.pid": 7777}
Log lifespan
The links to log request expire after seven days. After seven days, the retrieved logs are deleted from their temporary storage.
The Status column is updated to display the following statuses:
- Deleting - indicates that the row is being deleted.
- Expired - indicates that the View and Download (Azure) is expired. The link no longer exists in View and Download (Azure) field.
Log Extractor changes following back-end log aggregator update
In January 2024, the back-end log aggregator was updated to a new log aggregator engine. As a result of this update, some changes are applied to the JSON log output, compared to the previous output before the log aggregator was updated. The following sections describe the changes to the log output.
Changed Fields
| Attribute | Example value before update | Example value after update |
|---|---|---|
| Timestamp: renamed to timestamp and converted from ISO 8601 to unix epoch time in milliseconds. | "Timestamp": "2021-09-23T17:23:37.0000000+00:00" | "timestamp": 1632417817000 |
| Level: renamed to severity.text and a severity.number value is added. See OpenTelemetry's Severity Fields documentation for detail on the severity numbers. | "Level": "Error" | "severity.text": "Error", "severity.number": 17, |
| MessageTemplate: renamed to message. | "MessageTemplate": "Error was encountered getting message from a batch of type {typeName}" | "message": "Error was encountered getting message from a batch of type {typeName}" |
| RenderedMessage field is removed | "RenderedMessage": "Error was encountered getting message from a batch of type \"DynamicReviewDocumentMessage\"" | (none) |
| Exception is split into exception.message, exception.stacktrace, and exception.type. If exception.stacktrace exceeds 4090 characters it will overflow into exception.stacktrace_1 and exception.stacktrace_2 as needed, supporting up to 12270 (4090*3) characters. | "Exception": "<exception source...> <Exception stack trace...>" |
"exception.message": "<exception source...>: <error message...>", "exception.stacktrace": <1st 4090 characters...> "exception.stacktrace_1": <2nd 4090 characters...>, "exception.stacktrace_2": <3rd 4090 characters...>, "exception.type": "<exception type...>", |
| Properties is flattened and the keys are concatenated with a ".". The Properties prefix is dropped | "Properties": { "typeName": "DynamicReviewDocumentMessage", "OperationContext": { "ExecutingAgent": "Active Learning Worker" }, "OperationID": "|aad3c000-4152151a479b8803.", "SourceContext": "<sourcecontext...>", "SourceID": "b7b77b7b-7777-77bb-b7b7-77b777bb77bb", "MachineName": "aa999aaa999999", "AppDomain": 55, "Application": "bbb7bb7b-7777-7b77-bb7b-7b77b777bbb7", "SubSystem": "CustomAgent", "System": "Agent", "ProcessId": 4336 |
"typeName": "DynamicReviewDocumentMessage",
"OperationContext.ExecutingAgent": "Active Learning Worker", "OperationID": "|aad3c000-4152151a479b8803.", "SourceContext": <sourcecontext...>", "SourceID": "b7b77b7b-7777-77bb-b7b7-77b777bb77bb", "MachineName": "aa999aaa999999", "AppDomain": 55, "Application": "bbb7bb7b-7777-7b77-bb7b-7b77b777bbb7", "SubSystem": "CustomAgent", "System": "Agent", "ProcessId": 4336 |
New Attributes
| Attribute | Example value |
|---|---|
| r1.source.id: value is copied from SourceID. SourceID will be deprecated at a future date | "r1.source.id": "b7b77b7b-7777-77bb-b7b7-77b777bb77bb", |
| host.name: value copied from MachineName. MachineName will be deprecated at a future date. | "host.name": "aa999aaa999999", |
| application.guid: value copied from Application when Application is a guid. Application will be deprecated at a future date. | "application.guid": "bbb7bb7b-7777-7b77-bb7b-7b77b777bbb7", |
| application.name: value copied from Application when Application is not a guid. Application will be deprecated at a future date. | "application.name": "My Application", |
| r1.subsystem: value copied from SubSystem. SubSystem will be deprecated at some future date. | "r1.subsystem": "CustomAgent" |
| r1.system: value copied from System. System will be deprecated at a future date. | "r1.system": "Agent" |
| process.pid: value copied from ProcessId. ProcessId will be deprecated at a future date. | "process.pid": 7777 |
Data Loss in Logs
The following scenarios will cause a loss of logging data:
- Drop log entry:
- If the log entry contains more than 200 attributes.
- If the log entry contains an attribute name with more than 255 characters.
- If the log entry contains an attribute with a primitive array containing more than 64 items.
- Drop Attribute from log entry:
- If the log entry attribute contains heterogeneous array of primitives
- If the log entry attribute contains array of non primitives (e.g. json objects)
- Truncate Attribute in log entry:
- If the log entry contains attribute with more than 4090 characters, the attribute is truncated at 4090 characters. (Note that if exception.stacktrace exceeds 4090 characters it will overflow into exception.stacktrace_1 and exception.stacktrace_2 as needed, supporting up to 12270 (4090*3) characters.)