


The Processing Administration tab provides a centralized location for you to access data on active processing and imaging jobs throughout your Relativity environment, as well as the status of all workers assigned to perform those jobs. You can find this information in the Worker Monitoring sub-tab.
You can also use the Processing History sub-tab to identify all actions taken related to processing in your environment.
(Click to expand)
 The content on this site is based on the most recent monthly version of Relativity, which contains functionality that has been added since the release of the version on which Relativity's exams are based. As a result, some of the content on this site may differ significantly from questions you encounter in a practice quiz and on the exam itself. If you encounter any content on this site that contradicts your study materials, please refer to the What's New and/or the Release Notes for details on all new functionality.
Security considerations for processing administration
Consider the following items related to security and client domains (formerly multi-tenancy):
- If you're the system admin for a client domain environment, Relativity makes it so that your tenants can only see jobs in their client domain. This eliminates the possibility of information leaks for workers that don't actually operate within your client domain.
- In client domain environments, users from one client domain can't see any workers from other client domains.
- In client domain environments, users from one client domain can only see work from their workspace. All other threads show an Item secured value for the Workspace field, and the rest of the columns are blank.
Note: Only System Administrators can modify processing jobs on the Worker Monitoring tab. Other users can see the Worker Monitoring tab with instance level permissions, but will have an error thrown when attempting to modify processing jobs.
Groups don't have access to the Processing Administration tab or sub-tabs by default. To grant them access, perform the following steps:
- From Home, navigate to the Instance Details sub-tab under kCura Admin.
- In the Security box, click Manage Permissions.
- In the Admin Security window, select Tab Visibility.
- From the drop-down list at the top right, select the group to whom you want to grant access.
- Select Processing Administration, Worker Monitoring, and Processing History.
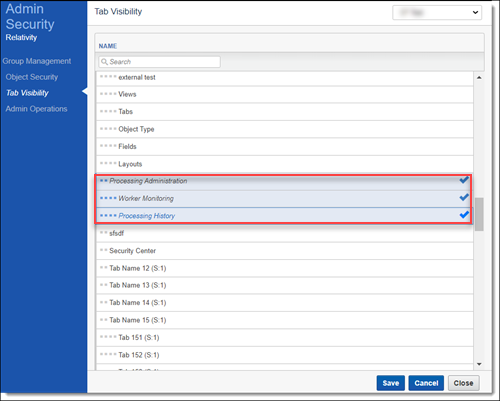
- Click Save.
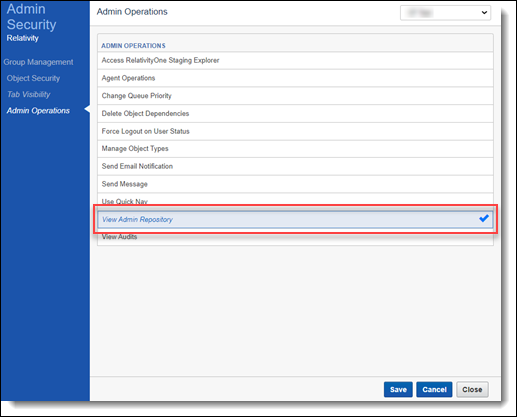
You must also have the View Admin Repository permission set in the Admin Operations console in the Instance Details tab to use the Processing Administration tab.
Monitoring active jobs
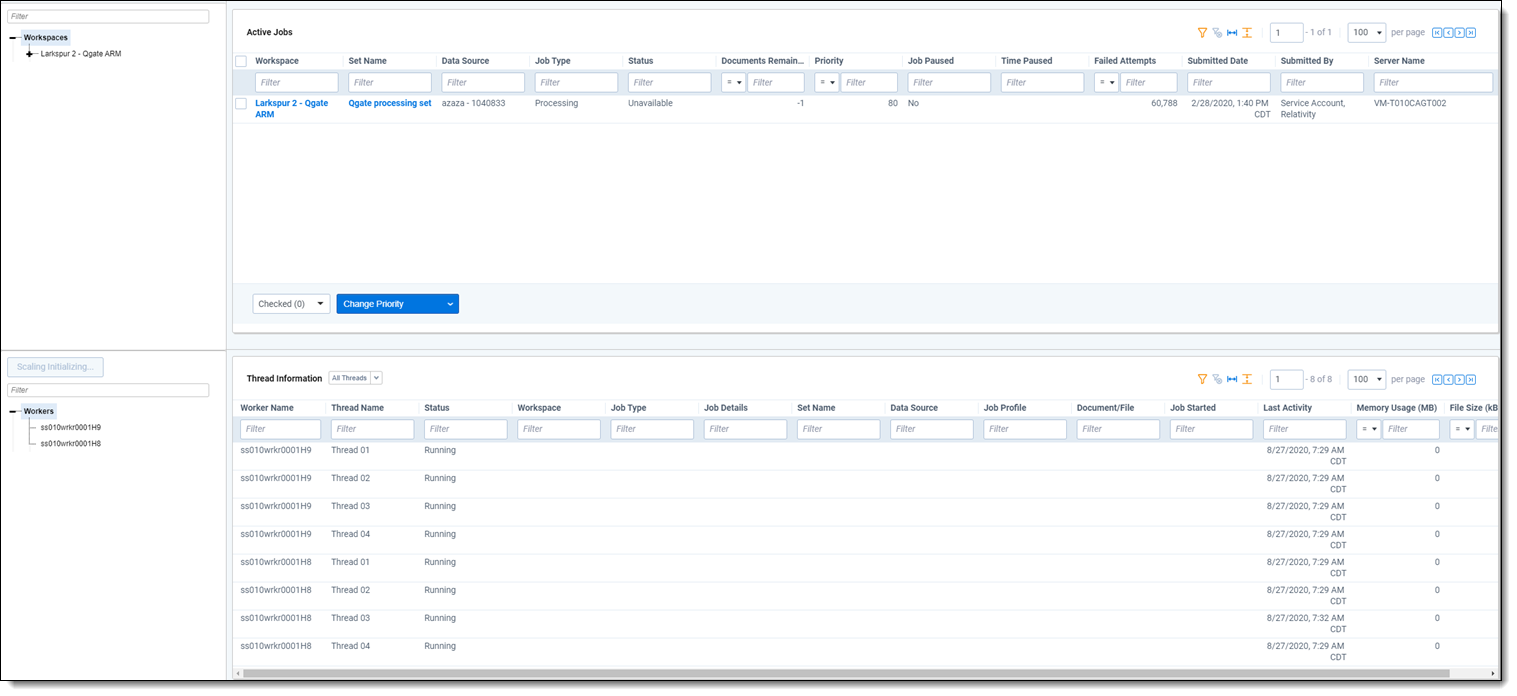
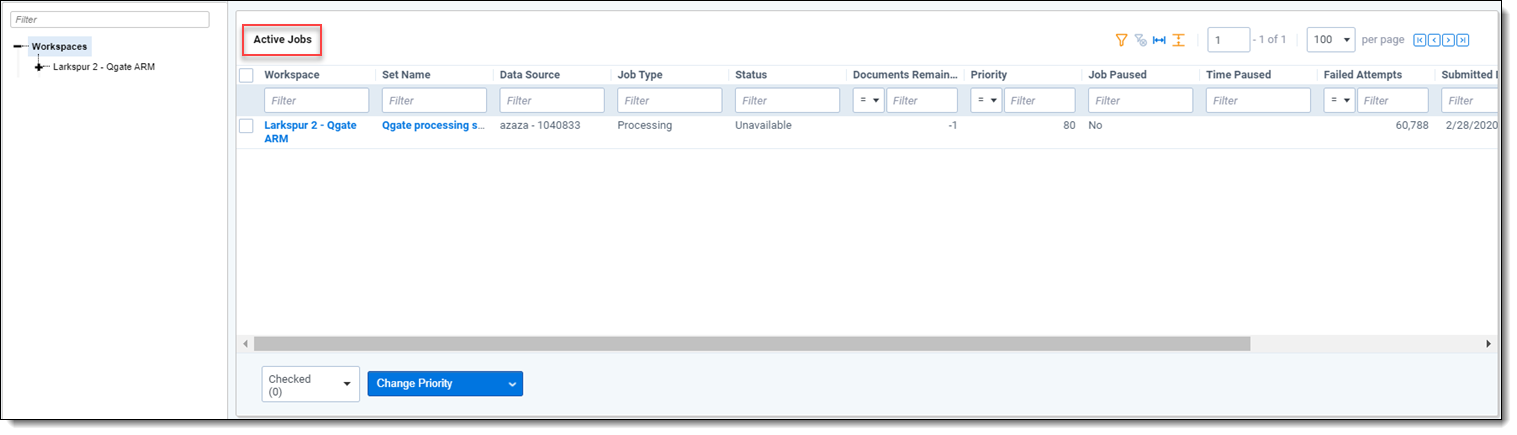
To see all active processing and imaging jobs in the environment, view the Active Jobs view in the Worker Monitoring sub-tab. If no jobs are visible in this view, it means there are no jobs currently running in the environment.
- Jobs that are running in workspaces to which you don't have permissions will display the placeholder text "Item Secured" in the Active Jobs view. Actual job details are not visible. To permit visibility, see Workspace Security.
- The Workspaces tree on the left only contains workspaces in which an active job is currently running.
The following columns appear on Active Jobs view:
(Click to expand)
- Workspace – the workspace in which the job was created. Click the name of a workspace to navigate to the main tab in that workspace.
- Set Name – the name of the processing set. Click a set name to navigate to the Processing Set Layout on the Processing Sets tab. From here you can cancel publishing or edit the processing set.
- Data Source - the data source containing the files you're processing. This appears as either the name you gave the source when you created it or an artifact ID if you didn't provide a name.
- Job Type – the type of job running. The worker manager server handles processing and imaging jobs.
Note: Filtering jobs aren't represented in the queue.
- Status – the status of the set. If you're unable to view the status of any processing jobs in your environment, check to make sure the Server Manager agent is running. This field could display any of the following status values:
- Waiting
- Canceling
- Finalizing
- Unavailable
- Inventorying
- Discover
- Publish
- Initialize Workspace
- Retrieving/Retrying Errors
- Submitting Job
- Documents Remaining – the number of documents that have yet to be inventoried, discovered, or published. The value in this field goes down incrementally as data extraction progresses on the processing set.
Note: This column displays a value of -1 if you've clicked Inventory Files, Discover Files, or Publish Files but the job hasn't been picked up yet.
- Priority – the order in which jobs in the queue are processed. Lower priority numbers result in higher priority. This is determined by the value of the Order field on the data source. You can change the priority of a data source with the Change Priority button at the bottom of the view. If you change the priority on a job and there is currently another job in progress, the new job will be picked up and worked on as worker threads become available. Changing the priority only changes the priority for that immediate job.
- Processing sets are processed in the queue on a first-come, first-served basis.
- Discovery, publishing, and imaging jobs are multi-threaded and can run in parallel, depending on the number of agents available.
- Job types have the following priorities set by default:
- Imaging/TIFF-on-the-fly jobs have a priority of 1 by default and will always run first.
- Publishing jobs have a priority of 90 and will always run after any imaging on the fly jobs and before all other jobs.
- Inventory, Discovery, Mass Imaging/Imaging Set
- If you've started a processing job, and you want to start and finish a Mass PDF or Mass Imaging job before that processing job completes, you must go to the Worker Manager Server and manually change the priority of the Single Save as PDF choice to be lower than any of the processing choices (Inventory, Discovery, and Publish). Setting the priority of a Mass Save as PDF job or Mass Imaging job must be done before the job begins for it to finish before other processing jobs. For details, see Worker manager server.
- Job Paused - the yes/no value indicates whether the job was paused. A paused job typically occurs if there is an issue with the processing agent. You can't manually pause a processing job.
- Paused Time - the time at which the job was paused, based on local time.
- Failed Attempts - the number of times an automatic retry was attempted and failed.
- Submitted Date – the date and time the job was submitted, based on local time.
- Submitted By – the name of the user who submitted the job.
- Server Name – the name of the server performing the job.
At the bottom of the screen, the active jobs mass operations buttons appear.
Active jobs mass operations
A number of mass operations are available on the Active Jobs view.
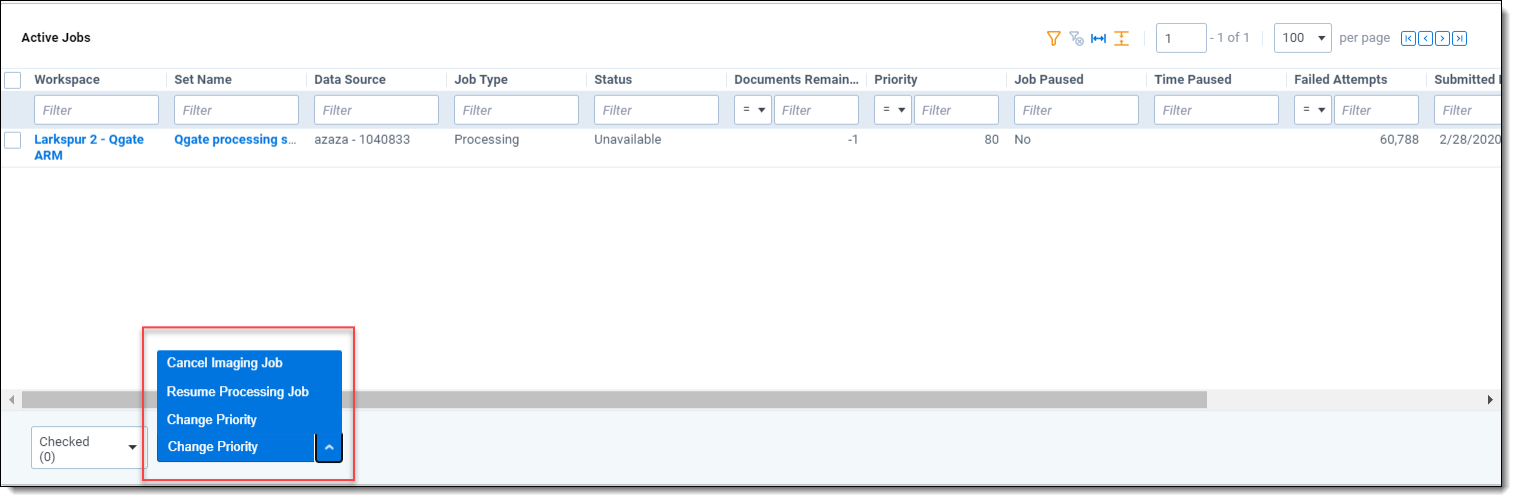
- Cancel Imaging Job - cancel an imaging job. If you have processing jobs selected when you click Cancel Imaging Job, the processing jobs are skipped over and are allowed to proceed. When you cancel an imaging job, it signals to the workers to finish their current batch of work, which may take a few minutes.
- Resume Processing Job - resumes any paused processing jobs that have exceeded the failed retry attempt count. You can resume multiple jobs at the same time. When you select this option, non-processing jobs are skipped, as are jobs that aren't currently paused.
- Change Priority - change the priority of processing jobs in the queue.
- When you click Change Priority, you must enter a new priority value in the Priority field. Then click Change Priority to proceed with change.
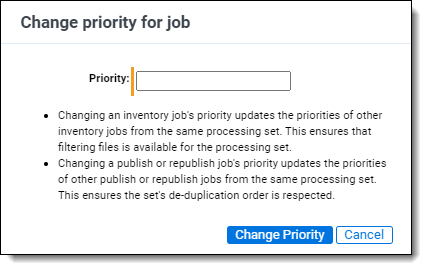
- If you change the priority of a publish or republish job, you update the priorities of other publish and republish jobs from the same processing set. This ensures that deduplication is performed in the order designated on the set.
- When you change the priority of an inventory job, you update the priorities of other inventory jobs from the same processing set. This ensures that filtering files is available as expected for the processing set.
- While there is no option to pause discovery, changing the priority of a discovery job is a viable alternative.
- When you click Change Priority, you must enter a new priority value in the Priority field. Then click Change Priority to proceed with change.
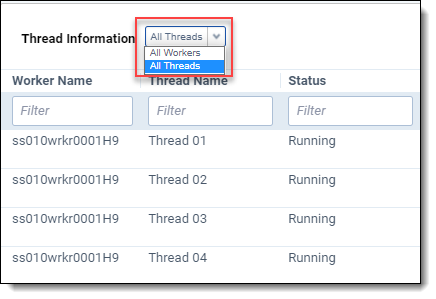
Checking worker and thread status
To check on the health of your workers and threads, navigate to the Thread/Worker Information pane at the bottom of the Worker Monitoring tab.
Use the drop-down list at the top of the view to select whether you want to see worker or thread information.
Note: The network on the Utility Server isn't set up to view the status of your workers; therefore, you’ll see all workers logged off in the Worker Activity window in the RPC, and you'll need to refer to the All Workers view of the Processing Administration tab in Relativity to see the status of your workers.
The All Workers view contains the following fields:
(Click to expand)
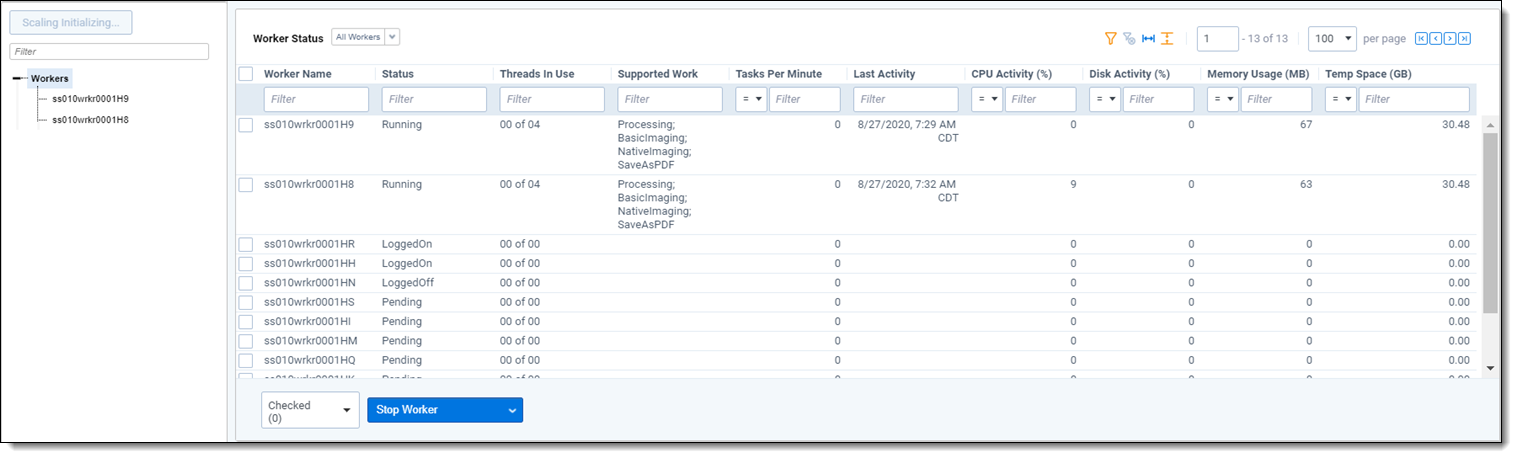
- Worker Name- the name you gave the worker. You can only see workers that are on resource pools to which you have access. For better visibility of a worker's current workload, you can hover over the worker's name to display a call-out containing its CPU activity, disk activity, tasks per minute, temp space (GB), and last activity. These values will reflect those contained in the fields to the right of the worker name.
- Status - reflects the current status of the worker.
- If set to Service not responding or Service call failed, then the other fields on the view will be empty or display percentages of 0, as they'll have no current job information to report. An idle thread is simply one for which there is currently no active work.
- If set to Running, it means that the worker thread is performing one of its designated jobs.
- If the queue manager service goes down, the Servers page in Relativity may display a different status value for your workers than what appears on the Worker Status page. This is because the Servers page retrieves the worker's status from the Queue Manager and displays whatever status the worker had before the queue manager went down. When the queue manager is down, there’s no way for the Servers page to get an updated status. Meanwhile, the Worker Status page displays a custom error such as Service not responding, and is actually more accurate than the Servers page in this case.
- Threads in Use - the number of threads that are busy performing processing or imaging out of the total number of threads available on the worker. This value depends on the configuration of the worker.
- The maximum total number of threads is 16. The minimum number of threads in use is zero if the worker is idle and not working on anything.
- The formula for the maximum threads on a worker is 1 thread per 750MB of RAM or 2 threads per CPU up to 16 threads total, whichever thread count is smaller.
- Supported Work - the work for which the worker is designated. This value could be any combination of the following job types:
- Processing - the worker is designated to perform processing jobs.
- Imaging - the worker is designated to perform basic and native imaging jobs.
- Save As PDF - this option is unavailable.
Note: Relativity performs conversion on designated conversion agents.
- CPU Activity - the amount of CPU resources the worker is using to perform its designated work across all CPU's on the Invariant worker machine. If the actual CPU reading is between 0 and 1, Relativity rounds this value up to 1.
- In most cases, a high CPU Activity reading with a low Memory in Use is indicative of smoothly running worker that has no stuck jobs.
- This value can't necessarily tell you whether or not a worker is stuck on a job, but it can tell you whether or not the worker is making a higher-than-normal effort to complete a job relative to other jobs in the environment.
- If all 16 threads are in use and the CPU is reading at 100% for an extended period of time, you might consider adding additional CPU's to the worker.
- Disk Activity - the percentage of disk activity on the worker. If the actual disk activity reading is between 0 and 1, Relativity rounds this value up to 1.
- If the disk drive is being hit excessively relative to other jobs, it can be an indicator that the worker is either low on memory and burdening the paging file, or it can mean that it is working on a large number of container files.
- If the disk drive activity is very high relative to other jobs for a sustained period of time, it's probably a sign that you're having an issue with your worker.
- Low CPU usage coupled with high disk activity can be indicative of low memory or a high container count. You should always address low memory by adding more memory. With a high container count, there's nothing to address, but note that performance can be impacted if the disks are slow.
- Memory in Use (GB) - how many GB of RAM the worker is currently using. If the actual memory reading is between 0 and 1, Relativity rounds this value up to 1.
- Tasks Per Minute - how many singular units of designated work the worker is performing per minute.
- Examples of tasks are discovering a document and converting a native.
- There is no normal range of values for this field, as it depends on what the worker has been designated to do. For slower processes, you'll see a lower number of tasks per minute being performed than for more efficient processes.
- Temp Space (GB) - the amount of space in GB that is free on the disk drive assigned to the TEMP environment variable on the worker machine.
- The value will vary based on the disk's capacity.
- Only the disk associated with the TEMP environment variable is reflected here.
- Relativity uses the TEMP folder to temporarily write files while the worker is busy, especially during ingestion.
- Last Activity - the date and time at which a thread last communicated to the worker.
The All Threads view contains the following fields:
(Click to expand)
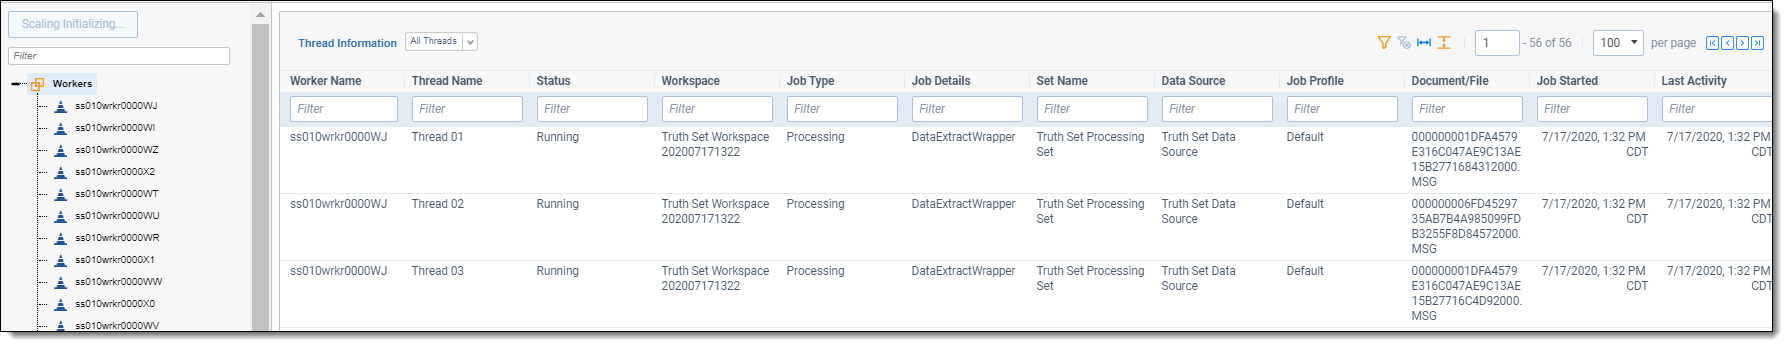
- Worker Name - the name of the worker to which the thread belongs.
- Thread Name - the name of the thread, as assigned to the worker by the processing engine.
- Status - indicates whether the thread is Idle or Running.
- If set to Idle, then most of the other fields in the view will be empty, as they'll have no current job information to report. An idle thread is simply one for which there is currently no active work.
- If set to Running, it means that the worker thread is performing one of its designated jobs.
- Workspace - the workspace containing the job that the thread is currently performing.
- Job Type - the type of job the thread is performing.
- This will be some variation of processing or imaging.
- Depending on the job type, you may not see values populated for other fields in the threads view. For example, an image-on-the-fly job doesn't require an imaging set, so the Set Name field will be empty for this type of job. For more information, see Thread data visibility.
- Job Details - the phase or task of the job type that the thread is performing.
- The value displayed here could be one of many root or sub jobs of the job type running in Invariant.
- The value displayed here is useful to provide to Relativity support when troubleshooting the worker issue associated with it.
- Set Name - the processing or imaging set that the threads are working on. This field isn't populated for image-on-the-fly or mass imaging jobs.
- Data Source - the source location of the data being processed or imaged.
- For processing, this is the data source attached to the processing set that the worker is running.
- For imaging, this is the saved search selected on the imaging set.
- Job Profile - the name of the processing or imaging profile used by the set. This field is blank for image-on-the-fly jobs.
- Document/File - the name of the native file that the thread is currently processing, imaging, or converting.
- This is the name of the file as it exists in its source location.
- Some imaging jobs may display a value of "Retrieving data" for this field while they gather the data required to display the document name.
- This field is blank if the status of the thread is Idle.
- File Size (KB) - the size of the document that the thread is currently working on. If the actual file size is between 0 and 1, Relativity rounds this value up to 1. This field will be blank if the status of the thread is Idle.
- Memory Usage (MB) - how much memory the thread is currently using to perform its work. This field will be blank if the Document/File value reads "Retrieving data" if the status of the thread is Idle or if the system is gathering the data required to display the document name.
- Job Started - the date and time at which the processing or imaging job started.
- Last Activity - the date and time at which a thread last communicated to the worker.
Worker mass operations
A number of mass operations are available to take on workers from the All Workers view.
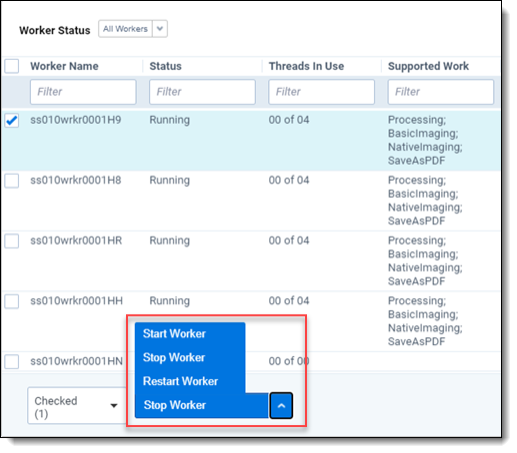
- Start Worker - starts the selected worker(s), making it available to pick up assigned work from the worker manager server.
- Stop Worker - stops the worker(s), preventing the worker from receiving jobs sent from the worker manager server. When you do this, the worker finishes only the tasks it’s working on, not the entire job. The remainder of that job is then available to be picked up by another worker.
- Restart Worker - restarts a stopped worker, enabling it to receive jobs sent from the worker manager server. Restarting a worker ends the current functional thread and cycles the worker from an offline to an online state.
Auto refresh options
The Active Jobs and All Threads/Workers views receive worker information when loaded and update every time the page refreshes. To configure the rate at which these views automatically refresh, select a value from the Auto refresh drop-down list at the bottom right of the view.
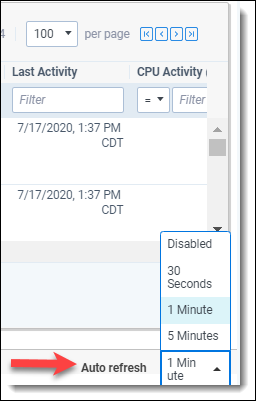
- Disabled - prevents the automatic refresh of the view and makes it so that job and worker/thread information only updates when you manually refresh the page. This option is useful at times of heavy worker usage, in that it offers you more control over the refresh rate and prevents the information from constantly changing often while you monitor the work being performed.
- 30 seconds - arranges for the views to automatically refresh every thirty seconds.
- 1 minute - arranges for the views to automatically refresh every one minute.
- 5 minutes - arranges for the views to automatically refresh every five minutes.
Thread data visibility
When you access a threads view on the worker status page, not all fields are applicable to all jobs. Therefore, you'll find that certain fields are not populated depending on the type of work taking place.
The following table breaks down which types of workers are populated for each thread field at a particular phase of their work.
| Designated work - phase | Set Name | Data Source | Job Profile | Document/File | File Size (KB) |
|---|---|---|---|---|---|
| Processing - Inventory | ✓ | ✓ | ✓ | ✓ | ✓ |
| Processing - Discovery | ✓ | ✓ | ✓ | ✓ | ✓ |
| Processing - Publish | ✓ | ✓ | ✓ | ✓ | ✓ |
| Imaging - Imaging set | ✓ | ✓ | ✓ | ✓ | ✓ |
| Imaging - Image-on-the-fly | ✓ | ✓ | |||
|
Imaging - Mass image |
✓ | ✓ | ✓ |
Errors
Errors can occur when Relativity attempts to communicate worker information to you as it receives that information from Invariant.
- Service not responding - the queue manager service on the worker manager server is down or not accessible.
- Service timed out - the call to Invariant timed out.
Note: The
- Service call failed - an unspecified failure that is most likely due to an old version of Invariant that doesn't have worker status API call being installed on your machine. This gets logged in the Errors tab in Relativity.
Note: For optimal performance, the processing engine caches worker and thread data for 30 seconds. If you refresh the page within the 30 second time period, the same cached data will display until the cache expires and new data is retrieved from Invariant upon refresh or when loading the page.
Using the Processing History sub-tab
To view the details of all processing actions taken on all data sources in the environment, navigate to the Processing History sub-tab.
In the Workspaces tree on the left, you'll see all workspaces in the environment that have at least one published document in them. You can expand the tree and click on processing sets and data sources to filter on them.
If you don't have permissions to a workspace, you'll see an "Item Restricted" message for that workspace.
The Processing History view provides the following fields:
(Click to expand)
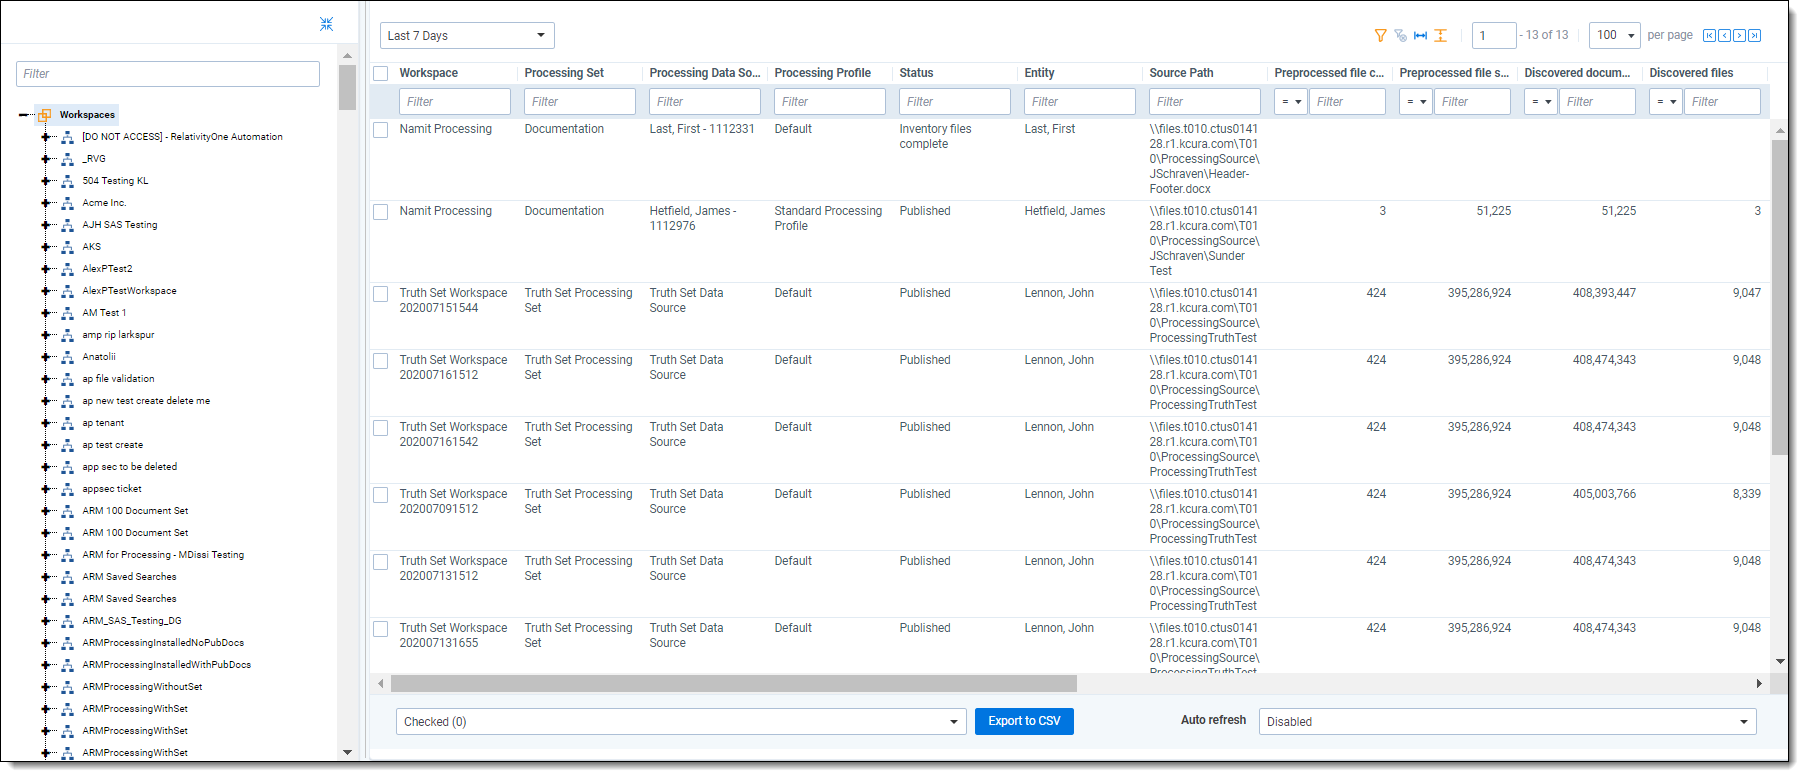
- Workspace - the name of the workspace in which the processing job was run.
- Processing Set - the name of the processing set that was run.
- Processing Data Source - the name and artifact ID of the data source attached to the processing set.
- Processing Profile - the profile associated with the processing set.
- Status - the current status of the processing job.
- Entity - the entity associated with the data source.
- Source Path - the location of the data that was processed, as specified on the data source.
- Preprocessed file count - the count of all native files before extraction/decompression, as they exist in storage.
- Preprocessed file size - the sum of all the native file sizes, in bytes, before extraction/decompression, as they exist in storage.
- Discovered document size - the sum of all native file sizes discovered, in bytes, that aren’t classified as containers as they exist in storage.
- Discovered files - the number of files from the data source that were discovered.
- Nisted file count - the count of all files denisted out during discovery, if deNIST was enabled on the processing profile.
- Nisted file size - the sum of all the file sizes, in bytes, denisted out during discovery, if deNIST was enabled on the processing profile.
- Published documents size - the sum of published native file sizes, in bytes, associated to the user, processing set and workspace.
- Published documents - the count of published native files associated to the user, processing set and workspace.
- Total file count - the count of all native files (including duplicates and containers) as they exist after decompression and extraction.
- Total file size - the sum of all native file sizes (including duplicates and containers), in bytes, as they exist after decompression and extraction.
- Last publish time submitted - the date and time at which publish was last started on the processing set.
- Discover time submitted - the date and time at which discovery was last started on the processing set.
- Last activity - the date and time at which any action was taken on the processing set.
You have the option of exporting any available processing history data to a CSV file through the Export to CSV mass operation at the bottom of the view.
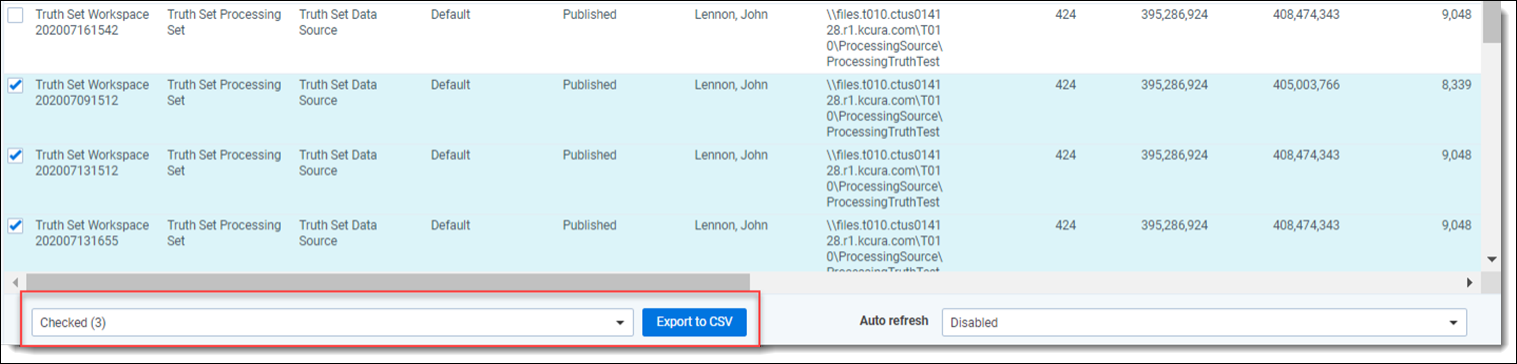
Auto refresh options for processing history
The processing history tab receives processing information when loaded and update every time the page refreshes.
To configure the rate at which the view automatically refresh, select a value from the Auto refresh drop-down at the bottom right of the view.
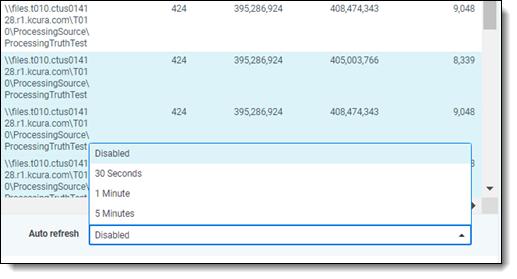
- Disabled - prevents the automatic refresh of the view and makes it so that processing history information only updates when you manually refresh the page. This option is useful at times of heavy processing usage, in that it offers you more control over the refresh rate and prevents the information from constantly changing often while you monitor the work being performed. We've set this as the default because if your environment contains many workspaces and data sources, it could take a long time to load all of the data, which you may not want to update on an auto-refresh interval.
- 30 seconds - arranges for the processing history view to automatically refresh every thirty seconds.
- 1 minute - arranges for the processing history view to automatically refresh every one minute.
- 5 minutes - arranges for the processing history view to automatically refresh every five minutes.