The logging framework enables you to gather runtime diagnostic information. Use it for troubleshooting application problems when you need a granular level of detail.
For an expert introduction to Relativity logging, watch this webinar (presented 02/17/2017):
See these related pages:
- Configure logging
- Troubleshoot Relativity using logging
- Logging system-subsystem-application matrix
- Infrastructure considerations for logging
Using logging scenario
You experience problems with Relativity and you have contacted Relativity Support. The Support specialist first requests to look at the Errors tab. Based on the information on the Error tab, they determine that the Relativity component causing the error is an event handler. It only occurs on the rel-server-2 machine in your Relativity environment. Next, the support specialist requests that you create a logging rule to set the logging level to Debug (2) for event handlers on rel-server-2. Additional logging data is accumulated and passed to Relativity for further investigation. For more information about this scenario, see Troubleshoot Relativity using logging .
When to use logging
Relativity provides different mechanisms for diagnostic and historic information. Note the following when deciding whether to use logging, audit data, or the Errors tab:
- Logging is intended for troubleshooting and debugging. Clean up your log files as necessary.
- Audit is for defensible history that is never deleted.
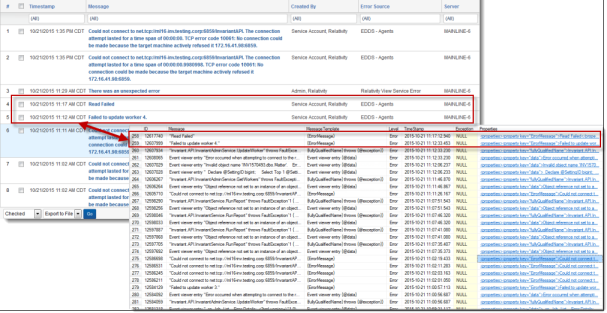
- The Errors tab also contains the Error level events. Relativity logs may contain more data logged at the Error level than is available on the Errors tab.
Where the logs are stored
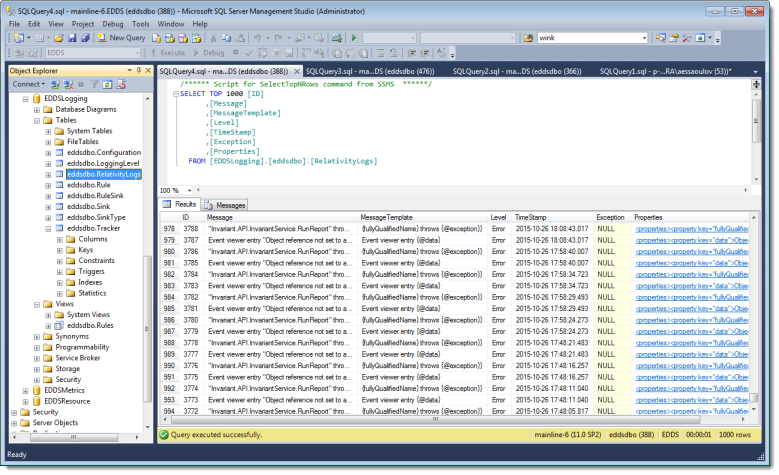
By default, Relativity logs are stored in the RelativityLogs table of the EDDSLogging database. You can access the table with a database client of your choice.
Note: Make sure to use database credentials with permissions to the EDDSLogging database.
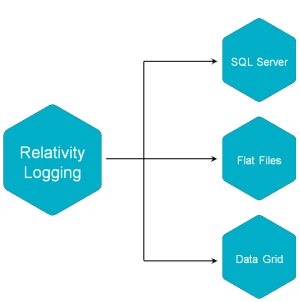
Depending on your Relativity configuration, logs can also be stored as files, in the Data Grid, or in a different SQL Server.
The following image shows the Relativity logs written out as files.
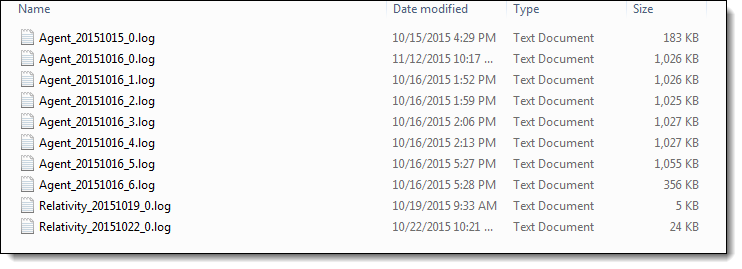
The log files directory path is defined by the RELATIVITY_LOGS environment variable. To quickly find the log files location, run this command in Windows Command Prompt:
echo %RELATIVITY_LOGS%
Relativity logging data destinations are referred to as sinks.For more information about sink configuration, see Configure logging .
Reading a log entry
By default, Relativity logs events at the Error (4) level. Event level are defined as follows:
|
Level
|
Database ID |
Description
|
|---|---|---|
|
Verbose |
0 | Include all available event details. |
| Debug | 1 | Internal control flow and diagnostic state dumps to facilitate pinpointing of recognized problems |
| Information | 2 | Events of interest or that have relevance to outside observers; the default enabled minimum logging level |
| Warning | 3 | Indicators of possible issues or service/functionality degradation |
| Error | 4 | Indicating a failure within the application or connected system |
| Fatal | 5 | Critical errors causing complete failure of the application |
Each level logs itself and every level above it in the order shown. For example, setting logging level at Warning logs Warning, Error, and Fatal. The lower the event level, the more detail is included in the event properties.
The Relativity program code defines the message and properties (metadata) for every logged event.
The message provides a verbal description of what happened and can be helpful in the initial identification of the cause of the problem.
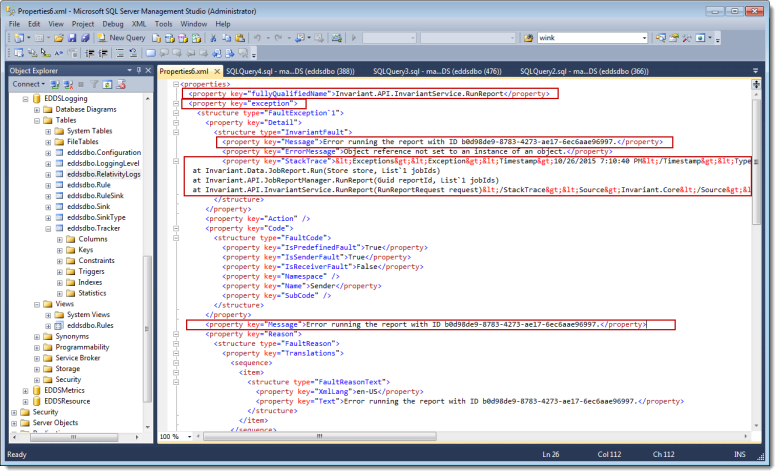
The Properties columns of the RelativityLogs table contains the most useful details for the log entry. Logging data in a database is stored as XML. If you are using Microsoft SQL Server Management Studio, you can open it in a separate tab by clicking inside Properties column.
Pay special attention to the following properties:
- MachineName – the host name of a machine in the Relativity environment where the event occurred.
- System – systems are the top-level components of the Relativity. They are typically IIS applications, Windows services, or executables. For more information, see Logging system-subsystem-application matrix .
- Subsystem – subsystems are Relativity components that are called from one or more systems. Generally, they are designated based on similar functionality.
- Application – applications are unique identifiers to indicate what context the code is running for. Applications can be Relativity Applications.
- ProcessID – the ID of the operating system process where the event occurred.
- ErrorMessage – the .Net framework message associated with the event.
- Stacktrace – the exception stack trace.
Note: If the logs are stored in a file sink or Data Grid, the data is stored in JSON format.
Log messages and properties may not always directly identify the cause of a problem in Relativity. Therefore, recognizing patterns of events and errors is critical when troubleshooting.
For more information, see Troubleshoot Relativity using logging .
Next steps
- Enable or disable logging – sometimes it may be necessary to stop logging for your environment or for certain machines. See Configure logging .
- Change default logging level – you may also need to change the default logging level. See Configure logging .
- Define logging rules – when troubleshooting Relativity, additional logging rules are usually required. See Troubleshoot Relativity using logging .
- Change the default sink or define more sinks – you may also need to change where logs are written to. See Sinks.
- Perform logging data maintenance – logging can significantly impact the performance and resource of your Relativity environment. See Infrastructure considerations for logging .


