Last date modified: 2026-Jul-09

FOIA Reports

Use the Reports page to view metrics and trends related to FOIA processing activities. Reports provide insights into request volume, request status, and backlog trends.
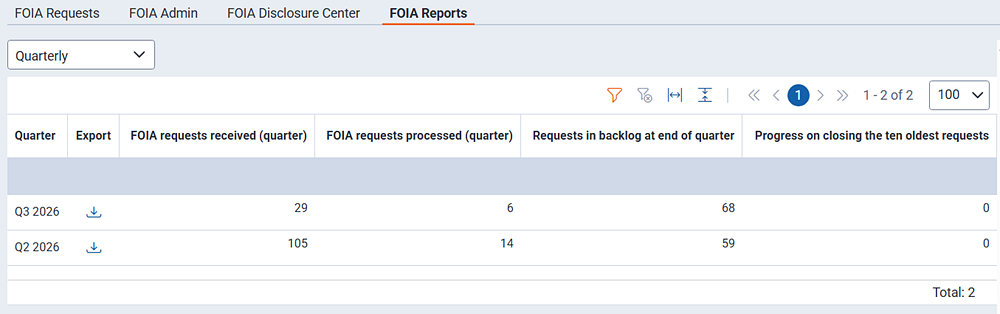
The report center table allows you to download document summaries.

Overview

Use the date selectors to specify a date range for the reports. Click Filter to update the dashboard charts and cards.

  • Charts
    • Open Requests—indicates the number of open and closed requests.
    • Weekly Request Intake—breaks down the number of requests received per week.
    • Release Activity—coming soon.
    • Backlog Trend—shows whether the agency's backlog of pending FOIA requests is increasing or decreasing over time. This helps administrators monitor workload and identify potential processing delays.
  • Cards
    • Consultations & Referrals
      • Consultations Sent—the number of consultation requests waiting for a response.
      • Referrals Sent—the number of referrals sent and waiting a response.
      • Referrals Received—the number of referrals received from other agencies.
    • Compliance & Reporting
      • Open versus Closed Requests—the percentage of open versus closed requests.
      • Average Processing Time—the average number of days required to processing a request.
      • Fee Waivers Granted—the percentage of requests for which fee waivers were granted.
      • Requests Perfected—the percentage of perfected requests out of all requests.

Click the Export icon next to the report you want to download.

Statutory

Quarterly Report—provides an overview of FOIA activity for the quarter. The reports include the following fields:

  • Year
  • Quarter
  • Requests Received
  • Requests Processed
  • Backlogged Requests (at the end of the quarter)
  • Ten Oldest Requests Closed

Return to top of the page
Feedback