


Note: Relativity plans to deprecate Windows Service Bus in Server 2023. We recommend that you begin conversion to RabbitMQ beginning in Server 2022.
You can use the Windows Performance Monitor to check the health of your service bus. This tool provides counters that monitor the behavior of various service bus components. Additionally, it provides data collection sets that you can use to aggregate the metrics collected by the configured counters and output reports on them. For more information about service bus health, see Relativity service bus entities.
See these related pages:
- Relativity service bus
- Relativity service bus entities
- Troubleshooting the Service Bus for Windows Server and Relativity service bus
Setting up Windows Performance Monitor
Use the following steps to set up Windows Performance Monitor in your environment:
- Log in to a server where you want to run the Performance Monitor.
- Right-click on Start > Search, and locate the Performance Monitor.
- Open the Performance Monitor, and expand the Monitoring Tools folder.
- In the Monitoring Tools folder, click Performance Monitor to display the graphical interface.
- Click
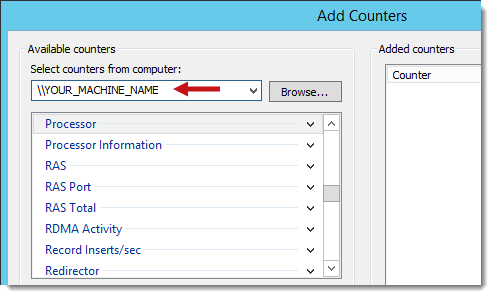
 to display the Add Counters window.
 - To point the Performance Monitor to a computer in your environment, enter its Fully Qualified Domain Name (FQDN) or IP address in the Select counters from computer box.
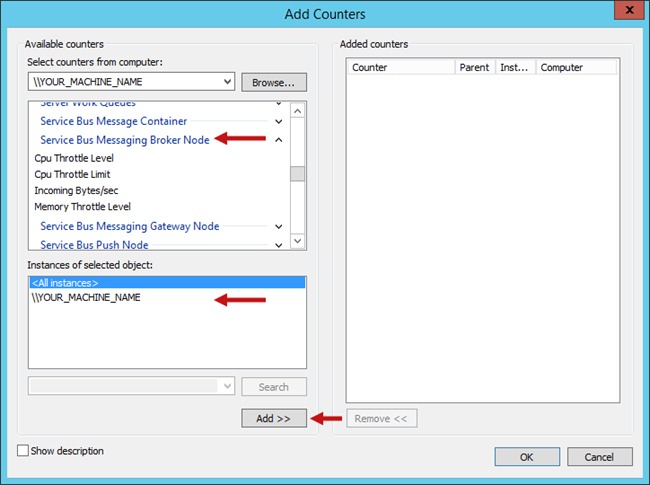
- Select the counters that you want to monitor from the list box. See Tracking metrics.
- Select the service bus nodes that you want to monitor in the Instances of select object box.
Tracking metrics
The Windows Performance Monitor includes counters that monitor the performance of different components of the service bus. The following list includes key components of the service bus and the counters that are most helpful for monitoring them. For detailed information about these counters, see
You can monitor performance counters scoped to the message container. For more information, see
The values for the following metrics should remain consistent. Additionally, normal values vary based on your environment’s hardware and network topology. When the values for these metrics are high, applications using the service bus may experience slower performance. For example, conversion requests may take longer to process. Monitor the following list of performance counters for the message container:
- Send Message Latency
- Receive Message Latency
- Complete message latency
You can monitor performance counters scoped to the messaging broker nodes. For more information, see
If any of the following metrics have values outside of the normal range, review the current load on your system. Determine if your service bus has an unusual number of requests by checking the values for the Incoming Messages/sec and Outgoing Messages/sec metrics available in the Performance Monitor. Consider increasing the resources on a node with a high request volume, or increasing the number of nodes in your system. Monitor the following list of performance counters for messaging broker nodes:
- Cpu Throttle Level - the normal range for this counter is between 0 and 1.
- Memory Throttle Level - the normal range for this counter is between 0 and 2.
Monitor the following list of performance counters scoped to the messaging gateway nodes. For more information, see
- Sql Operation Latency - the normal latency shouldn't exceed 100 milliseconds. Latency that exceeds the recommend range indicates that the SQL server has slowed down the processing of service bus requests. Check the health of your SQL server to determine whether your environment configuration needs updating.
- Sql Exceptions/sec - the normal value for this metric varies based on the size of your environment and the current load that it is handling. However, it shouldn't rapidly increase. An increased number of exceptions indicates that the SQL server is failing an increasing number of service bus requests. Verify that the SQL server connection is configured properly for the service bus. In addition, check the health of your SQL server to determine whether your environment configuration needs updating.
- Failed Operations/sec - the normal value for this metric varies based on the size of your environment and the current load that it is handling. However, it shouldn't rapidly increase. If this value increases, check the event viewer for information about service bus failovers.
Reporting functions in Windows Performance Monitor
The Windows Performance Monitor provides you with the ability to create entities called data collection sets. You can configure a set of configured counters into data collection set, and then log performance metrics on the set. You have the option to configure the data collection for specific timeframes. Additionally, you can configure the data collection set to generate notifications when counters exceed specified thresholds.
For more information about data collection sets, see the following pages on the Microsoft site:
When the data collection is completed, the data collector set performs various tasks, which are output to the event viewer. You can also schedule other Windows tasks to meet your current needs.
To send event viewer logs by email, you can use various Powershell scripts that point to an SMTP server. For information about setting up email notifications, see Send-MailMessage
You may also want to consider gathering data with the Perfmon plugin from New Relic. For more information, see Perfmon.