


Worker monitoring
The worker monitoring tab provides a comprehensive view into the status of all the workers and worker threads in an environment.
The information on this tab lets you monitor the health, performance, and state of your workers, thus allowing you to quickly identify what is occurring in your environment and more efficiently troubleshoot potential issues you're experiencing with any of the jobs that your workers perform, including processing and imaging.
This page contains the following sections:
- Using worker monitoring
- Monitoring workers
- Monitoring threads
- Thread data visibility
- Errors
- Security considerations
See these related pages:
At the end of the day yesterday, you started to publish a processing set with the intention of allowing the publish job to run overnight. The set was large, but not significantly larger than ones you've published before.
This morning, you looked at the progress of the set, and you noticed that it was stuck at a very low completion percentage when it should have completed already. You suspect that issues with your workers are causing the job to hang, and you're inclined to call Relativity support to see if they can access your database to diagnose the problem.
Before you do that, you decide to refer to the Worker monitoring tab to see if there are any abnormalities that you can identify yourself, such as the levels of CPU or memory usage listed for the worker that is performing your processing job.
When you locate the worker performing the publish job in the Worker monitoring tab, you notice that it's showing that all threads are in use and that the memory reading is far higher than normal. Now you know that something might be wrong and that you may need to add more memory to your system in order to accommodate a job of this size.
Note: When you use the worker monitoring tab, any column you don't have access to in the All Workers view or any of the threads views displays a value of Item secured. This includes RDOs such as data sources, processing sets, imaging sets, etc. It also includes instances of admin objects such as servers and workspaces. If you don't have access to view a worker or a workspace, the Worker and Workspace columns display the Item secured value, and the rest of their rows are blank.
Monitoring workers
To monitor worker status:
- Search for "worker monitoring" on the Relativity homepage or navigate to the Processing Administration tab. Note that your tab structure might be different, so your Worker monitoring tab might be located somewhere else in your tab bar.
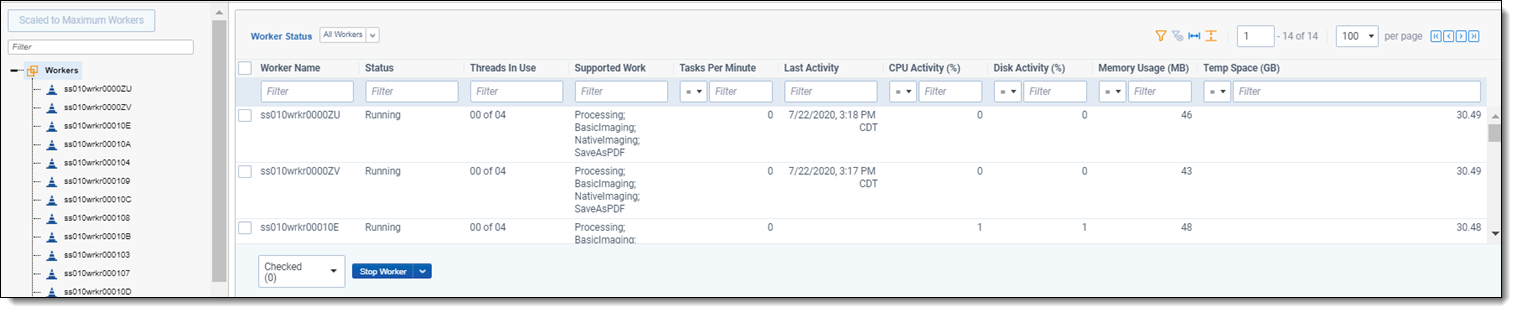
- Select the Worker monitoring sub-tab. Select the All Workers view from the drop-down list if you weren't taken there by default.
- Refer to the following fields:
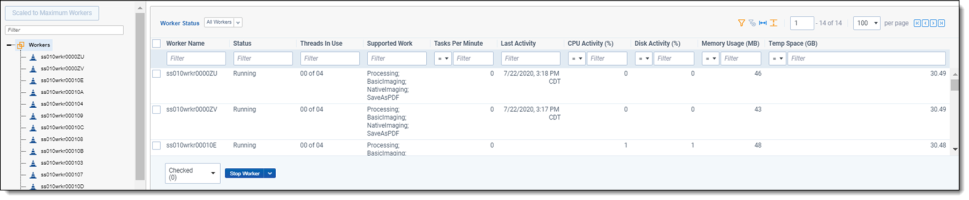
- Worker Name - the name you gave the worker. You can only see workers that are on resource pools to which you have access. For better visibility of a worker's current workload, you can hover over the worker's name to display a call-out containing its CPU activity, disk activity, tasks per minute, temp space (GB), and last activity. These values will reflect those contained in the fields to the right of the worker name.
- Status - reflects the current status of the worker.
- If set to Service not responding or Service call failed, then the other fields on the view will be empty or display percentages of 0, as they'll have no current job information to report. An idle thread is simply one for which there is currently no active work.
- If set to Running, it means that the worker thread is performing one of its designated jobs.
- If the queue manager service goes down, the Servers page in Relativity may display a different status value for your workers than what appears on the Worker monitoring page. This is because the Servers page retrieves the worker's status from the Queue Manager and displays whatever status the worker had before the queue manager went down. When the queue manager is down, there’s no way for the Servers page to get an updated status. Meanwhile, the Worker monitoring page displays a custom error such as Service not responding, and is actually more accurate than the Servers page in this case.
- Threads in Use - the number of threads that are busy performing processing or imaging out of the total number of threads available on the worker. This value depends on the configuration of the worker.
- The maximum total number of threads is 16. The minimum number of threads in use is zero if the worker is idle and not working on anything.
- The formula for the maximum threads on a worker is 1 thread per 750MB of RAM or 2 threads per CPU up to 16 threads total, whichever thread count is smaller. For more information on worker-thread configuration, see Workers.
- Supported Work - the work for which the worker is designated. This value could be any combination of the following job types:
- Processing - the worker is designated to perform processing jobs.
- Imaging - the worker is designated to perform basic and native imaging jobs.
- Save As PDF - the worker is designated to save files as PDF's.
Note: Relativity performs conversion on designated conversion agents.
- Tasks Per Minute - how many singular units of designated work the worker is performing per minute.
- Examples of tasks are discovering a document and converting a native.
- There is no normal range of values for this field, as it depends on what the worker has been designated to do. For slower processes, you'll see a lower number of tasks per minute being performed than for more efficient processes.
- Last Activity - the date and time at which a thread last communicated to the worker.
- CPU Activity - the amount of CPU resources the worker is using to perform its designated work across all CPU's on the Invariant worker machine. If the actual CPU reading is between 0 and 1, Relativity rounds this value up to 1.
- In most cases, a high CPU Activity reading with a low Memory in Use is indicative of smoothly running worker that has no stuck jobs.
- This value can't necessarily tell you whether or not a worker is stuck on a job, but it can tell you whether or not the worker is making a higher-than-normal effort to complete a job relative to other jobs in the environment.
- If all 16 threads are in use and the CPU is reading at 100% for an extended period of time, you might consider adding additional CPU's to the worker.
- Disk Activity - the percentage of disk activity on the worker. If the actual disk activity reading is between 0 and 1, Relativity rounds this value up to 1.
- If the disk drive is being hit excessively relative to other jobs, it can be an indicator that the worker is either low on memory and burdening the paging file, or it can mean that it is working on a large number of container files.
- If the disk drive activity is very high relative to other jobs for a sustained period of time, it's probably a sign that you're having an issue with your worker.
- Low CPU usage coupled with high disk activity can be indicative of low memory or a high container count. You should always address low memory by adding more memory. With a high container count, there's nothing to address, but note that performance can be impacted if the disks are slow.
- Memory in Use (GB) - how many GB of RAM the worker is currently using. If the actual memory reading is between 0 and 1, Relativity rounds this value up to 1.
- Temp Space (GB) - the amount of space in GB that is free on the disk drive assigned to the TEMP environment variable on the worker machine.
- The value will vary based on the disk's capacity.
- Only the disk associated with the TEMP environment variable is reflected here.
- Relativity uses the TEMP folder to temporarily write files while the worker is busy, especially during ingestion.
The workers and threads views receive worker information when loaded and update every time the page refreshes. To configure the rate at which your workers and threads views automatically refresh, select a value from the Auto refresh drop-down list at the bottom right of the view.
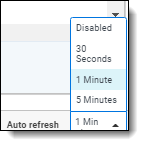
- Disabled - prevents the automatic refresh of the view and makes it so that worker/thread information only updates when you manually refresh the page. This option is useful at times of heavy worker usage, in that it offers you more control over the refresh rate and prevents the information from constantly changing often while you monitor the work being performed.
- 30 seconds - arranges for the worker/thread view to automatically refresh every thirty seconds.
- 1 minute - arranges for the worker/thread view to automatically refresh every one minute
- 5 minutes - arranges for the worker/thread view to automatically refresh every five minutes.
Monitoring threads
To monitor worker status:
- Navigate to the Worker monitoring tab and select the All Threads view from the view drop-down list.
- Refer to the following fields:
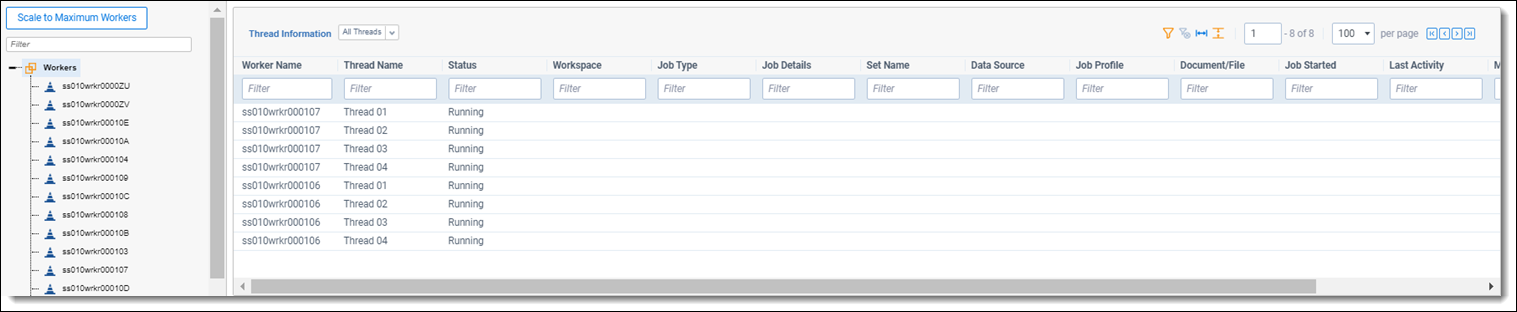
- Worker Name - the name of the worker to which the thread belongs.
- Thread Name - the name of the thread, as assigned to the worker by the processing engine.
- Status - indicates whether the thread is Idle or Running.
- If set to Idle, then most of the other fields in the view will be empty, as they'll have no current job information to report. An idle thread is simply one for which there is currently no active work.
- If set to Running, it means that the worker thread is performing one of its designated jobs.
- Workspace - the workspace containing the job that the thread is currently performing.
- Job Type - the type of job the thread is performing.
- This will be some variation of processing or imaging.
- Depending on the job type, you may not see values populated for other fields in the threads view. For example, an image-on-the-fly job doesn't require an imaging set, so the Job Set field will be empty for this type of job. For more information, see Thread data visibility.
- Job Details - the phase or task of the job type that the thread is performing.
- The value displayed here could be one of many root or sub jobs of the job type running in Invariant.
- The value displayed here is useful to provide to Relativity support when troubleshooting the worker issue associated with it.
- Set Name - the processing or imaging set that the threads are working on. This field isn't populated for image-on-the-fly or mass imaging jobs.
- Data Source - the source location of the data being processed or imaged.
- For processing, this is the data source attached to the processing set that the worker is running.
- For imaging, this is the saved search selected on the imaging set.
- Job Profile - the name of the processing or imaging profile used by the set. This field is blank for image-on-the-fly jobs, as they don't require profiles to run.
- Document/File - the name of the native file that the thread is currently processing, imaging, or converting.
- This is the name of the file as it exists in its source location.
- Some imaging jobs may display a value of "Retrieving data" for this field while they gather the data required to display the document name.
- This field is blank if the status of the thread is Idle.
- Job Started - the date and time at which the processing or imaging job started.
- Last Activity - the date and time at which a thread last communicated to the worker.
- Memory Usage (MB) - how much memory the thread is currently using to perform its work. This field will be blank if the Document/File value reads "Retrieving data" if the status of the thread is Idle or if the system is gathering the data required to display the document name.
- File Size (KB) - the size of the document that the thread is currently working on. If the actual file size is between 0 and 1, Relativity rounds this value up to 1. This field will be blank if the status of the thread is Idle.
Note: The worker monitoring page automatically generates thread views per worker in your environment. For example, if you have a worker named "Worker 1," you'll see a view named "Worker 1 - Threads" in the views drop-down list underneath the All Workers and All Threads views. These automatically created thread views are listed in alpha-numeric order.
Thread data visibility
When you access a threads view on the worker monitoring page, not all fields are applicable to all jobs. Therefore, you'll find that certain fields are not populated depending on the type of work taking place.
The following table breaks down which types of workers are populated for each thread field at a particular phase of their work.
| Designated work - phase | Job Set | Data Source | Job Profile | Document/File | File Size (KB) |
|---|---|---|---|---|---|
| Processing - Inventory | ✓ | ✓ | ✓ | ✓ | ✓ |
| Processing - Discovery | ✓ | ✓ | ✓ | ✓ | ✓ |
| Processing - Publish | ✓ | ✓ | ✓ | ✓ | ✓ |
| Imaging - Imaging set | ✓ | ✓ | ✓ | ✓ | ✓ |
| Imaging - Image-on-the-fly | ✓ | ✓ | |||
|
Imaging - Mass image |
✓ | ✓ | ✓ |
Errors
Errors can occur when Relativity attempts to communicate worker information to you as it receives that information from Invariant.
- Service not responding - the queue manager service on the worker manager server is down or not accessible.
- Service timed out - the call to Invariant timed out.
Note: The
- Service call failed - an unspecified failure that is most likely due to an old version of Invariant that doesn't have worker status API call being installed on your machine. This gets logged in the Errors tab in Relativity.
Note: For optimal performance, the processing engine caches worker and thread data for 30 seconds. If you refresh the page within the 30 second time period, the same cached data will display until the cache expires and new data is retrieved from Invariant upon refresh or when loading the page.
Security considerations
Consider the following items related to security and client domains (formerly multi-tenancy):
- If you're the system admin for a client domain environment, Relativity makes it so that your tenants can only see jobs in their client domain. This eliminates the possibility of information leaks for workers that don't actually operate within your client domain.
- In client domain environments, users from one client domain can't see any workers from other client domains.
- In client domain environments, users from one client domain can only see work from their workspace. All other threads show an Item secured value for the Workspace field, and the rest of the columns are blank.
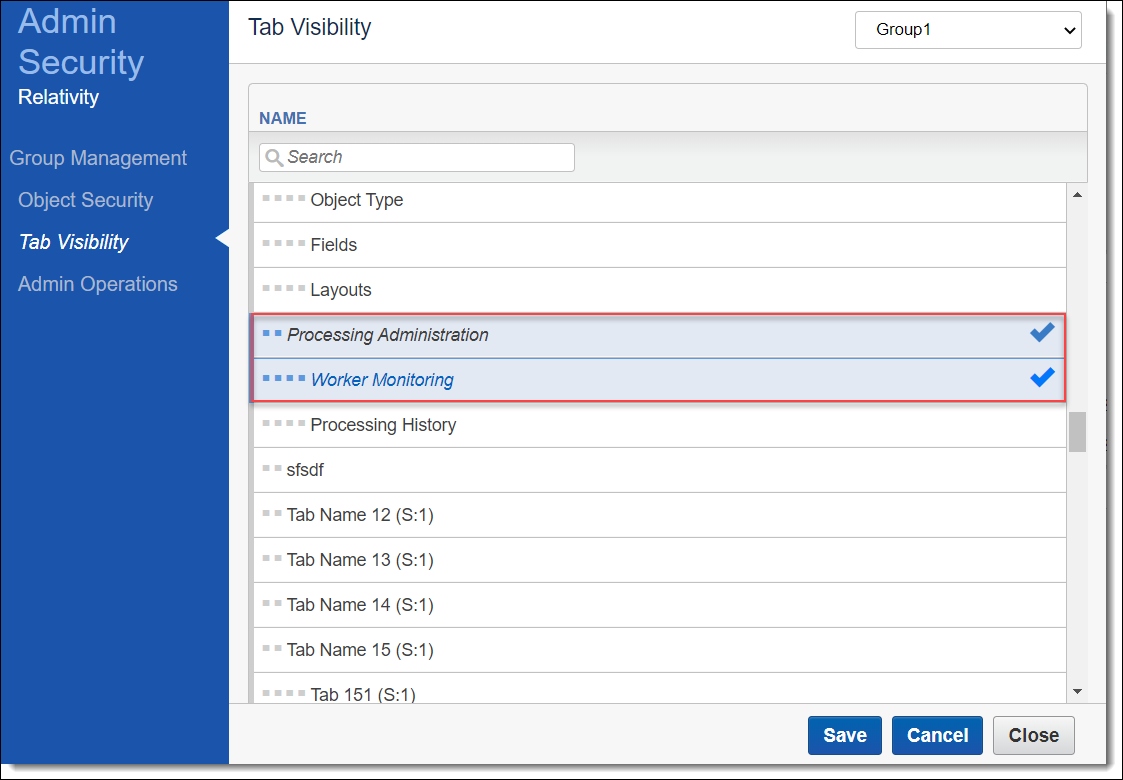
Groups don't have access to the Worker monitoring tab by default. To grant them access, perform the following steps:
- From Home, navigate to the Instance Details sub-tab under kCura Admin.
- In the Security box, click Manage Permissions.
- In the Admin Security window, select Tab Visibility.
- From the drop-down list at the top right, select the group to whom you want to grant access.
- Select Processing Administration and Worker Monitoring.