


Troubleshooting RabbitMQ
You can troubleshoot RabbitMQ by viewing the log files under the Roaming AppData. Additionally, you can use the RabbitMQ management UI to view information about the topics and subscriptions used for distributing messages.
RabbitMQ logging/service management
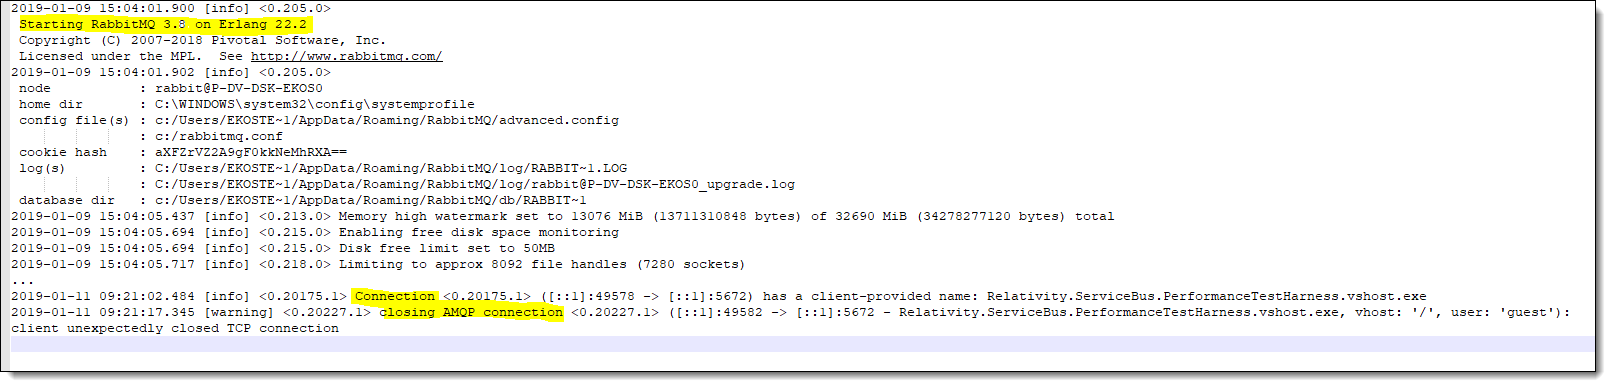
RabbitMQ creates its own file for logging under the Roaming AppData of the user who installed RabbitMQ:
C:/Users/<UserThatInstalledTheService>/AppData/Roaming/RabbitMQ/log
By default, RabbitMQ logs at the info level and logs service events such as incoming connections and service start-up and shutdown.
To start or stop your RabbitMQ service, use either the shortcuts RabbitMQ creates upon installation or open up a command prompt to RabbitMQ's sbin.
Note: Run the shortcuts as an administrator.
If you choose to use the command prompt, use the commands rabbitmqctl start_app and rabbitmqctl stop_app to start and stop respectively. For more information on other commands available within the command line, see commands on the RabbitMQ website.
Note: Use caution while running command line prompts against RabbitMQ. If you get into a state where you can neither stop or start the service, try a restart of the machine itself before attempting anything else.
Erlang crash dump logging
Erlang outputs a dump file when there is an issue starting the RabbitMQ service. The dump file is located where the data directory is set, by default C:/Users/<UserThatInstalledTheService>/AppData/Roaming/RabbitMQ, and is named erl_crash.dump. The quickest way to identify the issue is within the first few lines next to the property called 'Slogan'.
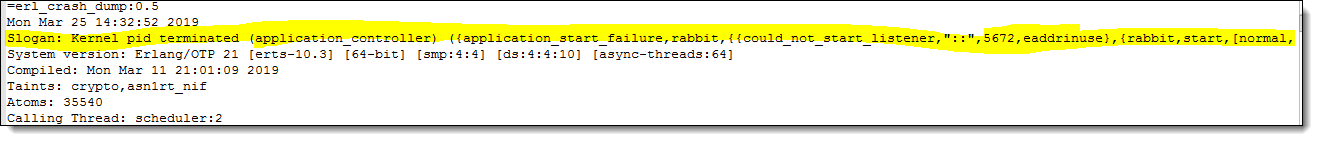
The Slogan is the reason why the dump file was taken in the first place. In the case above, you can see that there was an application start failure for RabbitMQ where it could not start a listener on port 5672. For more information on the other data in the dump file and some common messages that may appear in the dump file, see How to Interpret the Erlang Crash Dumps.
RabbitMQ management UI
RabbitMQ ships with the management plugin, but you must enable it before you can use the management operations in the Relativity Service Bus library. The management plugin provides an API for manipulating RabbitMQ entities like exchanges and queues. It also provides a web interface for managing and monitoring the RabbitMQ instance. Complete the following steps to enable the RabbitMQ management UI:
- Open the RabbitMQ command prompt on your machine.
- In the RabbitMQ command prompt, run the following command. This command enables the management plugin (management UI and management API). Relativity's RabbitMQ provider requires the management API to perform certain operations.
rabbitmq-plugins enable rabbitmq_management
- Restart the RabbitMQ Windows Service.
- Open a browser and navigate to http://localhost:15672/
- Log in:
- username: guest
- password: guest
Note: If you encounter issues with the RabbitMQ management page, you can use the command line to create Virtual Host, User, Set permissions and update Polices. For details, see the RabbitMQ - Create Virtual Host knowledge base article on the Community. You must enter valid Community credentials to access this content.
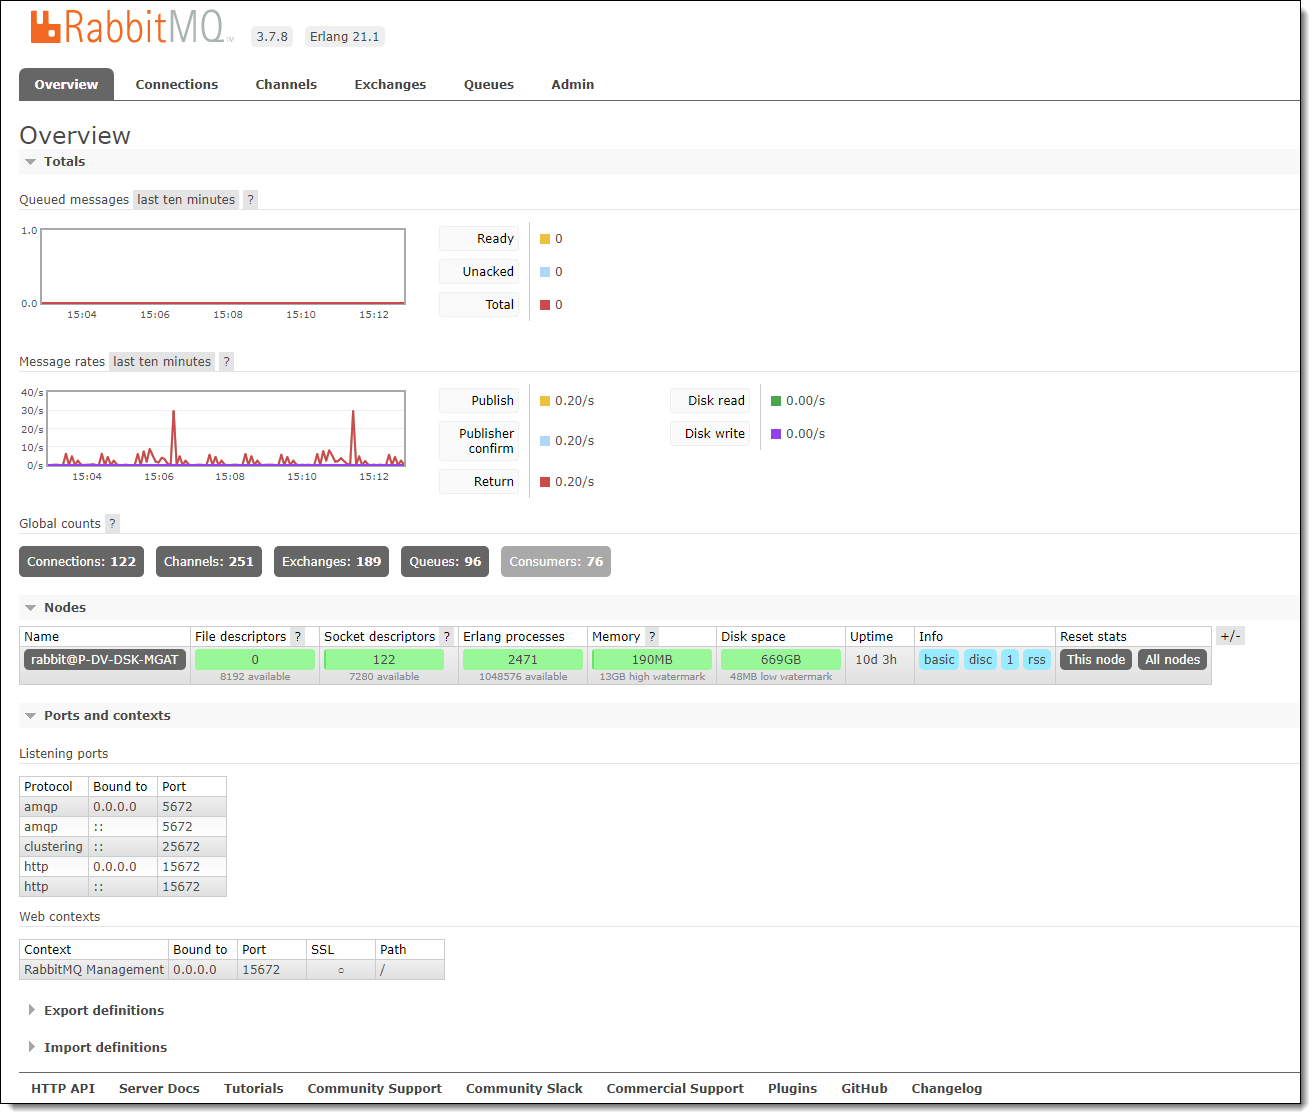
Overview tab
The overview tab provides a quick overview of your RabbitMQ cluster. It contains graphs on operations per second, info on nodes in the cluster, and context/connection information. This tab is a useful resource to get a basic overview of your current system to check if there is any activity in the instance.
Connections, Channels, Exchanges, and Queues
The management UI has multiple tabs that contain information on who is connected to the RabbitMQ cluster. It also displays which exchanges and queues are defined along with real-time information on the messages contained within them.
Connection tab
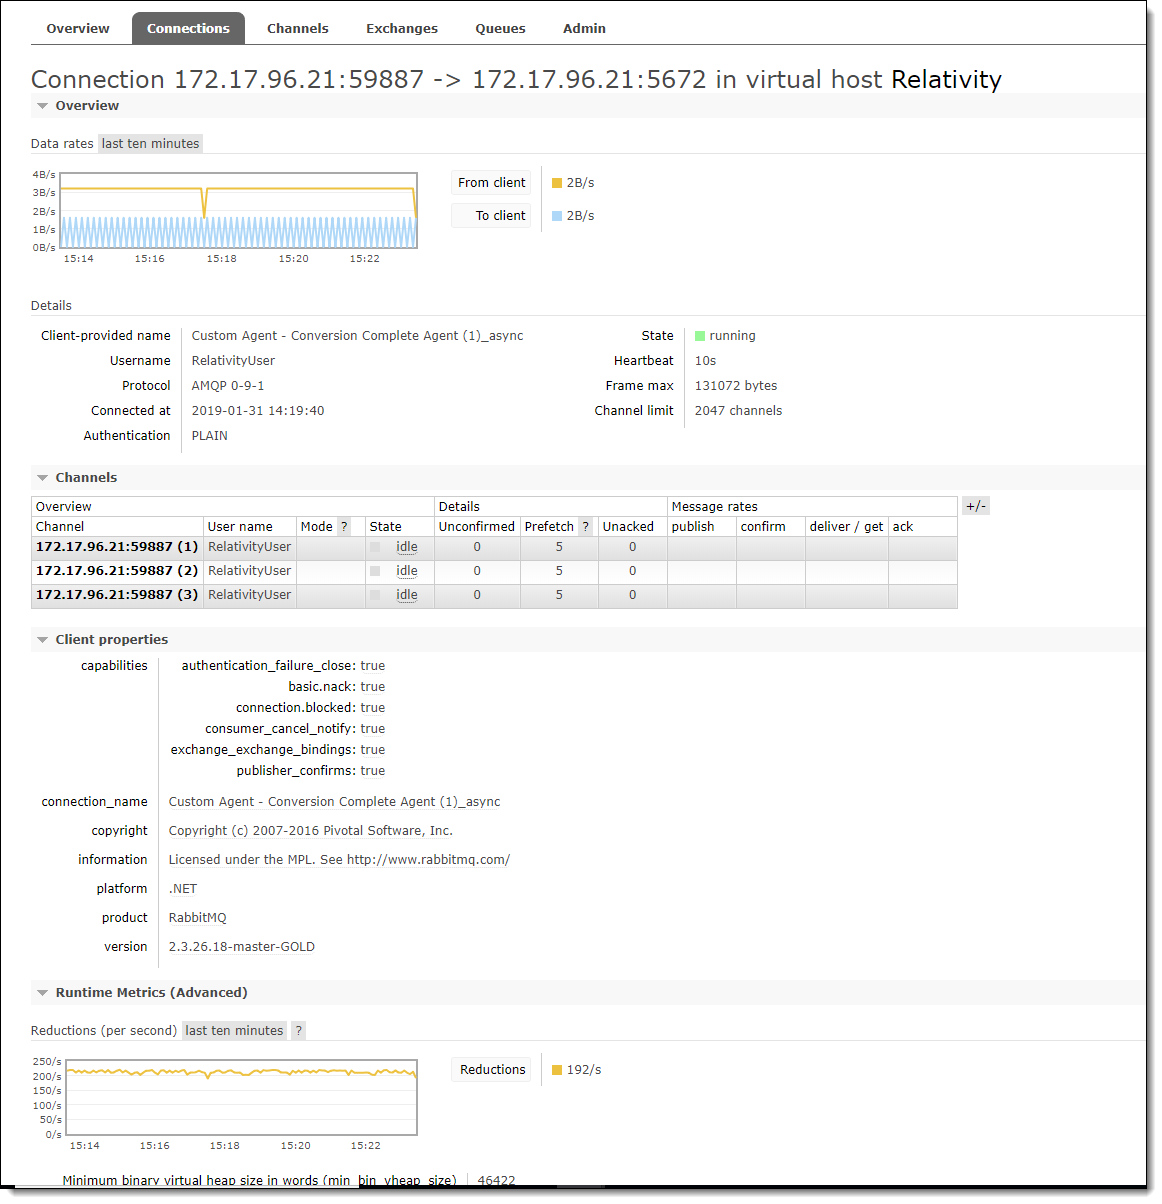
The connection tab contains all active connections within the RabbitMQ cluster. Connections correspond to the AppDomain name. This is generally either the process name or the name of the Relativity agent.
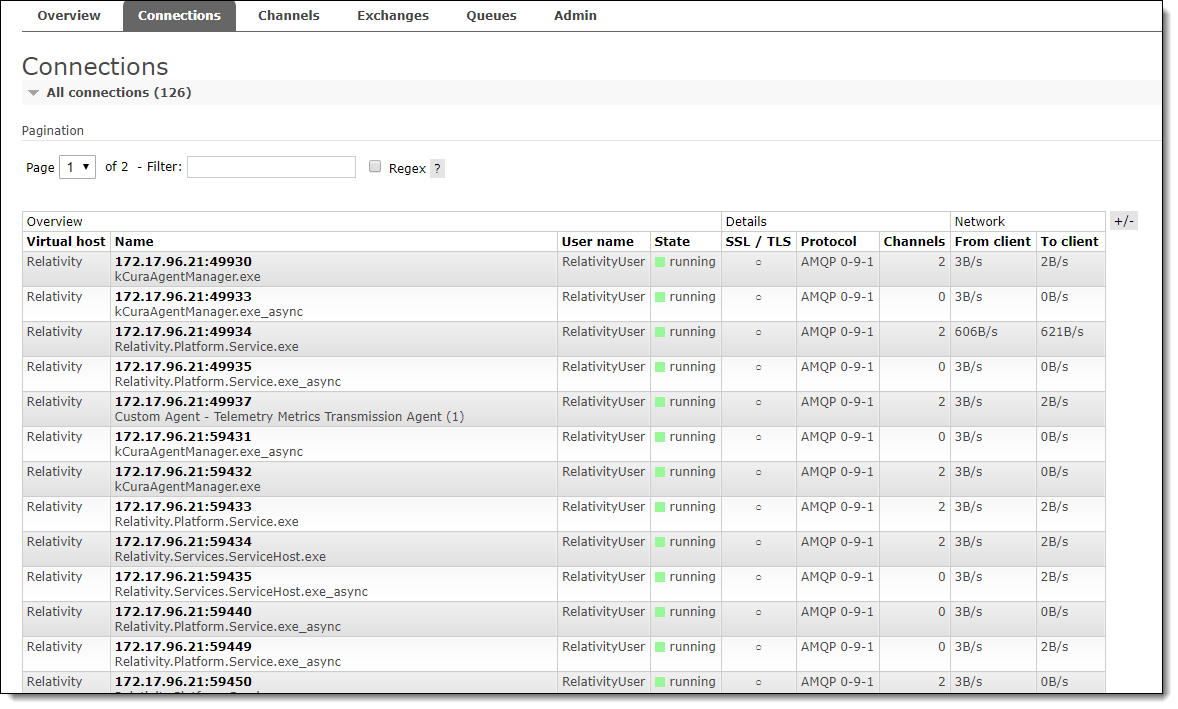
Clicking on a connection takes you to a page with additional information about that connection.
Channels tab
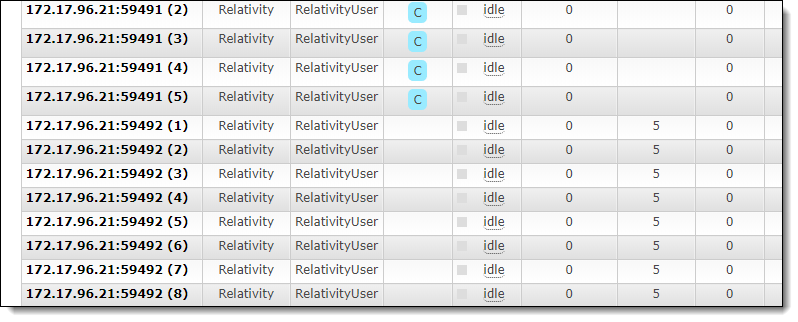
This tab displays information about all currently active channels.
For Relativity, if there is a “C” under Mode, this generally indicates the channel is dedicated to sending messages. Similarly, a populated Prefetch value generally indicates the channel is dedicated to receiving messages.
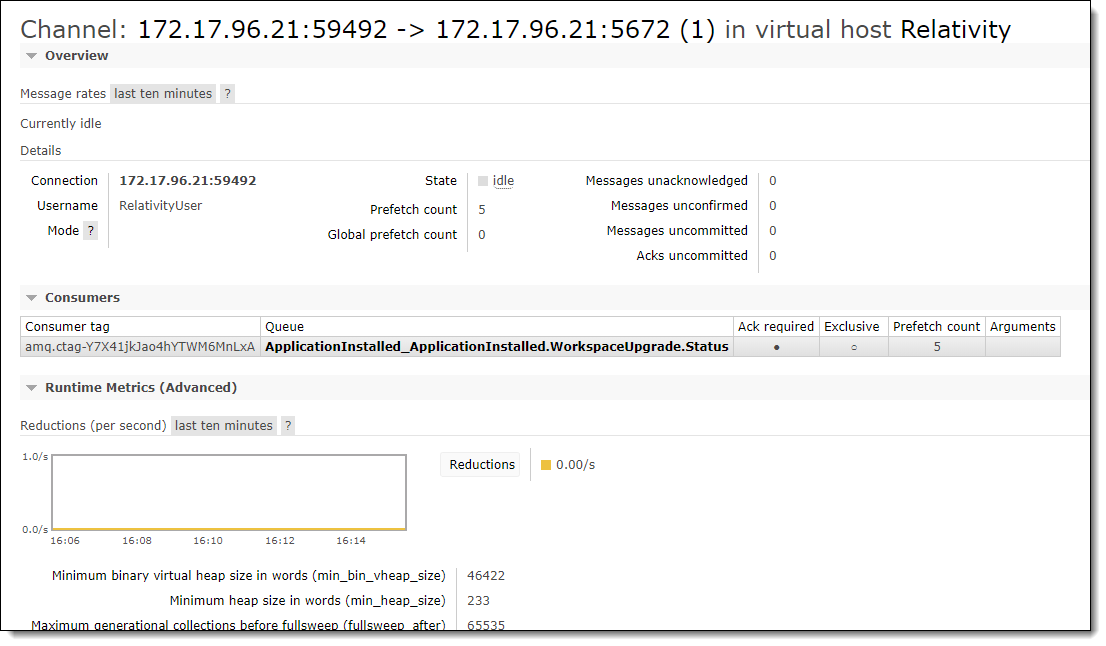
Clicking on a channel takes you to a page with additional information about that channel. This includes configuration values and any consumers.
Exchanges and Queues tabs
The exchange and queue tab displays the topics and queues within the RabbitMQ cluster. You can use these tabs to view details about the topic or queue and real-time message statistics.
Exchanges tab
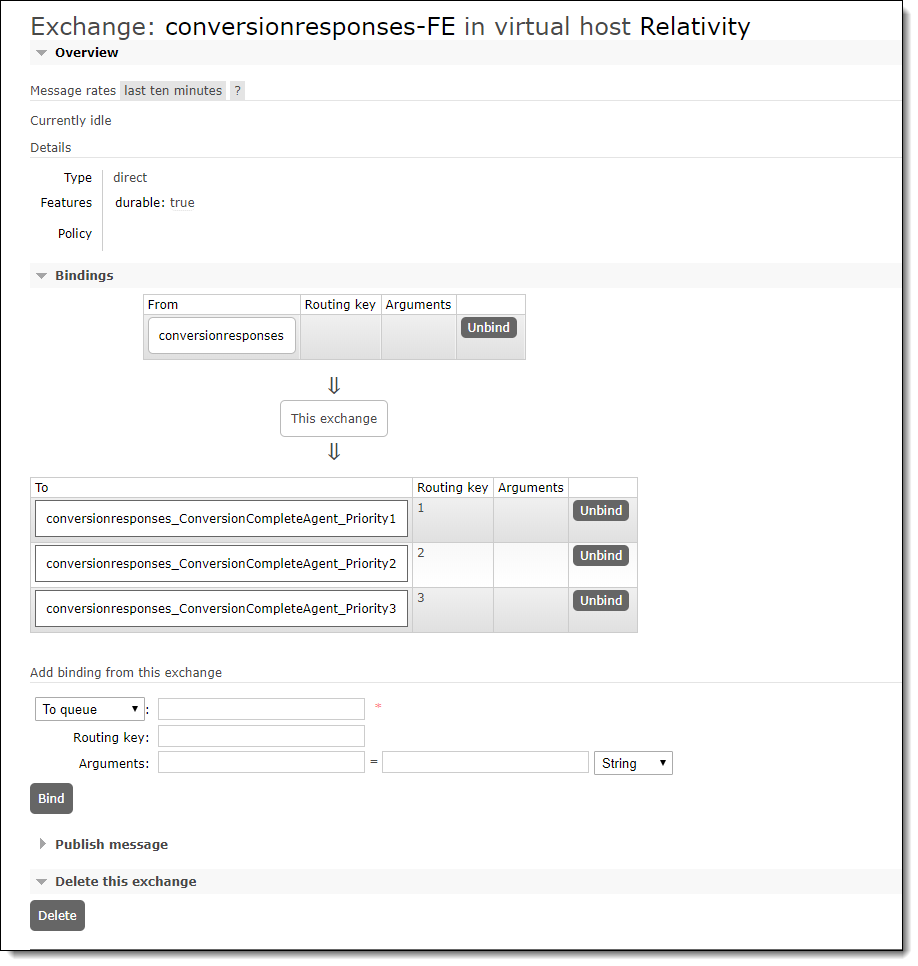
The exchange tab shows all the exchanges within the RabbitMQ cluster which translates to both topics and queues from the Relativity.ServiceBus library. The main table contains every name of topics and queues defined within the cluster and their respective deadletter queues which are identified by the characters "-DLE" appended to the end. If the exchange name ends in "-FE", it is an exchange for a filtered subscription; you can find what it is filtering on is in the exchange details under the binding's routing keys. There are also metrics on the current message's in and out rates.
Clicking on an exchange takes you to the exchange detail page where you can view a graph of the message rates and details about the exchange and its bindings. Bindings are what this exchange forwards the message to; the binding can either be another exchange or a queue (subscription in the Relativity.ServiceBus library). In the case of a fanout type exchange, it broadcasts all messages to everything it is bound to.With a direct exchange, messages are only forwarded to bindings for the routing key that they match. You can navigate to the queue or exchange that is bound to the exchange you are viewing by clicking on the name in the Bindings section.
From this page, you can perform actions like publishing a message or deleting the exchange.
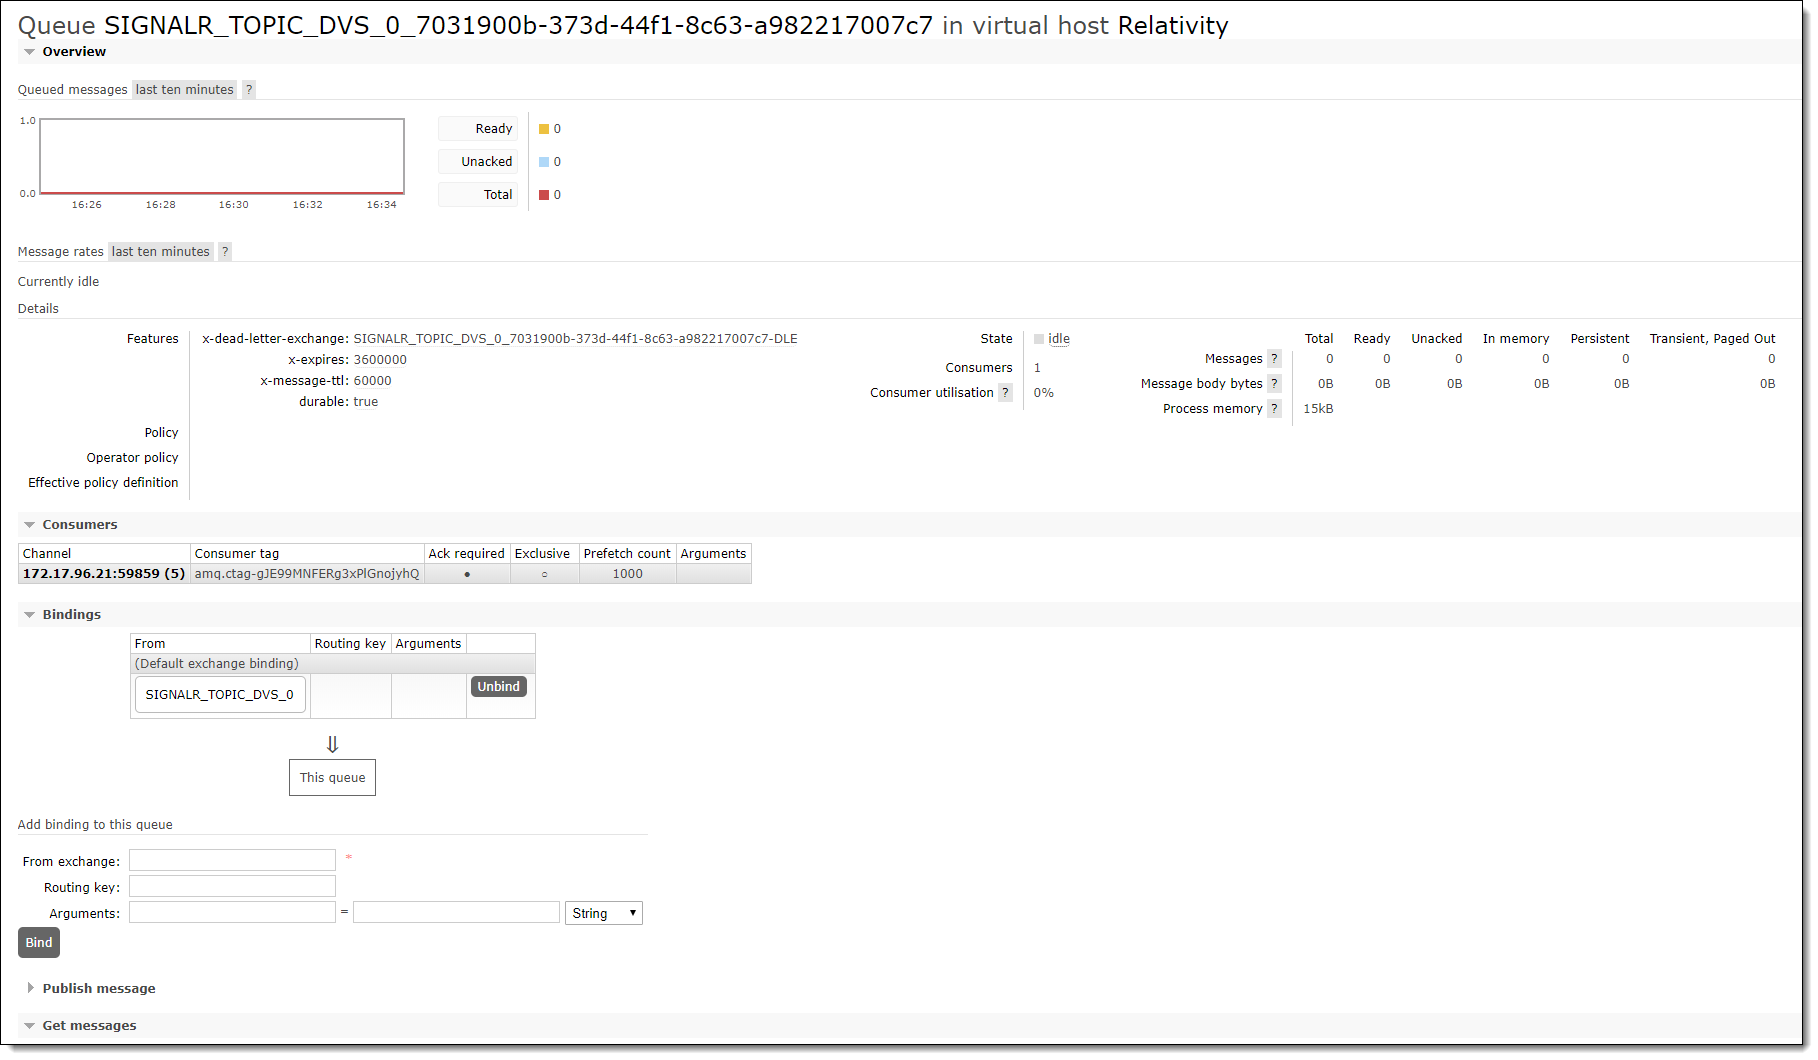
Queues tab
The queues tab is very similar to the exchanges tab. This page lists all the queues (subscriptions in Relativity.ServiceBus) that exist in the cluster. Queues ending in "-DLQ" are the deadletter subscriptions. The main differences are:
The State column shows whether the connection to that queue is active or not
- Messages information is displayed
- How many are ready and en queued
- How many messages were received but not acknowledged
- The total amount of messages associated with that queue
You can view more details about the queue from the queue details page. You can also publish, receive, and purge all messages from the queue; inspect current consumers; move messages from the queue; and delete the queue itself.
Admin tab
The admin page has multiple sub-tabs. These tabs are Users, Virtual Hosts, Policies, Limits, and Cluster.
- Limits - Allows for limiting the number of connections and queues.
- Cluster - Allows for setting the cluster name.
- Users and access control - Allows for setting user and access control. For additional information on these features, see https://www.rabbitmq.com/access-control.html
- Virtual hosts - Allows for setting the virtual host. For additional information on these features, see https://www.rabbitmq.com/vhosts.html
- Policies - Allows for setting policies. For additional information on these features, seehttps://www.rabbitmq.com/parameters.html
Note: For more information, see the RabbitMQ website.
Common troubleshooting tasks for RabbitMQ
Use these common troubleshooting tasks to resolve issues with RabbitMQ.
Queue is not draining
Complete the following steps if the queue is not draining:
- Log into the RabbitMQ management UI.
- Click the Queues tab.
- If there are no consumers, ensure there is at least one agent that handles the associated messages running and/or restart any existing agents and verify a consumer appears after the agent starts.
- If there is a consumer(s), but the deliver (manual ack) and consumer ack rates are zero. Check if there are unacked messages. If a consumer fails to ack messages, RabbitMQ will stop delivering new messages to it once the unacked message counts equals the prefetch value set for the associated channel.
- If there are unacked messages:
- Navigate to the consumer(s) connection(s) by clicking on the Channel link, then click the Connection link.
- Scroll down and expand Close this connection.
- Click Force Close. This will make the “stuck” messages available again, and the client process will automatically reconnect.
Relativity Web and/or Agent servers are unable to connect to RabbitMQ
Complete the following steps if Relativity Web and/or Agent servers are unable to connect to RabbitMQ:
- Verify the RabbitMQ server and/or cluster is running by logging into management UI and verifying each expected server is present and displaying as green under nodes. For more information, see RabbitMQ management UI.
- On the Overview tab in the management UI, ensure RabbitMQ is listening on the expected ports:
- amqp: 5672
- amqp/ssl: 5671 (if configured for TLS, see Configure RabbitMQ For TLS )
- http: 15672
- https:15671 (if configured for TLS, see Configure RabbitMQ For TLS )
- Verify RabbitMQ can be reached by navigating to the management page from the affected server(s).
- Additionally, ensure the settings do not contain any trailing or leading whitespace, and ensure the casing matches for RabbitMQ's SharedAccessKey, SharedAccessKeyName, and ServiceNamespace settings.
- Ensure the RabbitMQ user being used for authentication has full permission for the configured virtual host, see Configuring RabbitMQ .