


Using Pivot profiles, you can create, save, and edit custom Pivot settings to use at any time. Once saved, these profiles are accessible via a drop-down menu in the upper-right corner of the item list.
Pivot profiles include configured settings for the Group By, Pivot On, and Date fields, as well as the chart formats. When you select a profile, the fields in the Pivot menu automatically populate with predefined values. You can modify these values to run additional Pivot reports. Use the Save button to save any updates to the preexisting profile or use the Save As button to create a new Pivot profile.
If you create a Pivot without selecting a profile, you can click Save to make the active settings into a profile. The Pivot profile does not save the documents associated with it.
Note: You can't create or save modifications to Pivot Profiles unless you have the required permissions.
You're a litigation support specialist at a firm and one of your clients is in the middle of a case involving a large number of traders and funds at the nation's largest banks. Someone from your client's office has just contacted you because they need to know which trader at a particular fund has executed the most transactions. They also need to know which month and year saw the highest volume of transactions by this trader. They need this information by the end of the day.
Having worked on this case for the past two months, you're sure these pieces of data are already logged in Relativity, but you don't yet have a way to quickly report on them. You decide to leverage Relativity's Pivot feature. Assuming that you're going to be asked many times to find transaction histories for specified traders throughout the life of this case, you create a Pivot profile to display which traders worked on which funds and how many total transactions they made.
You call this profile Fund/Trader and associate it with the Transactional Data object type that you created to hold the names of traders, the funds they trade, and the total number of transactions they executed. You set your desired display options, making sure to sort on Grand Total, since you need to refer to this often for the total number of transactions made by each trader for each fund. For the Group By setting, you select the Fund Name field you already created. You select the Trader field you created for the Pivot On setting. Then you save the profile.
You then create another profile for the Transaction Data object called Trader/Date to bring together the Transaction Date and Trader fields. Once you save the Fund/Trader and Trader/Date profiles, you can select and run them on the item list in the Transactional Data object to easily get at the pieces of data your client needs.
See Running Pivot reports for more information.
Creating or editing a Pivot profile
Perform the following steps to create or edit a Pivot profile.
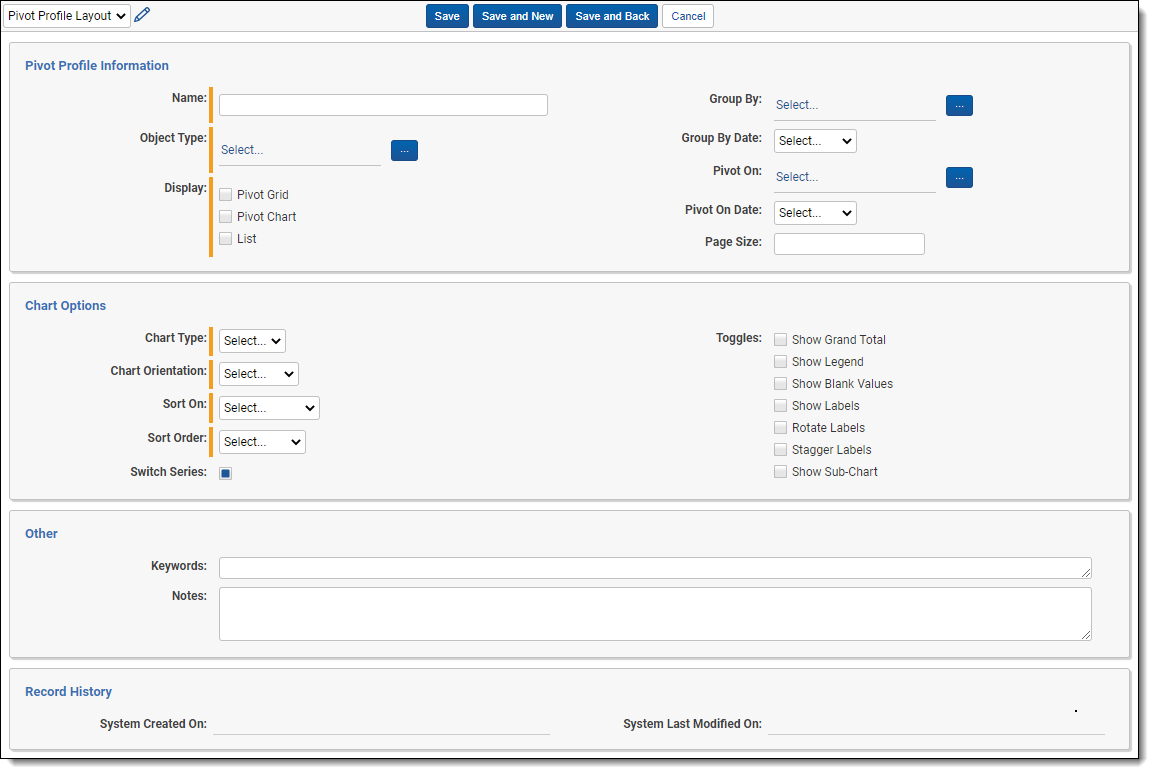
- Navigate to the Pivot Profiles tab, and then click New Pivot Profile. The Pivot Profile Information form appears with required fields in orange.

- Complete the fields on the Pivot Profile Information form.
- Name - the name of the profile. You may want the name to reflect fields on which you pivoted.
- Object Type - the object type you would like this profile to appear under.
- Display - provides three check boxes to specify which of the three possible Pivot display types you want to be used to represent your profile in the item list:
- Pivot Grid - designates the grid as part of the profile display.
- Pivot Chart - designates the chart as part of the profile display.
- List - designates the list as part of the profile display.
- Group By - a list from which you select the field you want to act as your Group By value in your profile. Only fields that are Pivot-enabled on the Field page are available in this list.
Note: Relativity does not recommend Group By for Long Text fields due to the performance impact. For more information, see Pivot.
- Group By Date - a drop-down menu providing the date values for the Group By field:
- Date - displays the date with day, month, and year.
- Week - displays week values.
- Two Weeks - displays every two weeks values.
- Year - displays only a year value.
- YearMonth - displays the year and month values.
- Pivot On - the Pivot On field in your profile. Only fields that are Pivot-enabled on the Field page are available in this list.
Note: Relativity does not recommend Pivot On for Long Text fields due to the performance impact. For more information, see Pivot.
- Pivot On Date - provides the same dates for the Pivot On field as found above on Group By, with the addition of the following:
- Month - displays only a month value. Month is only available in Pivot On if your Group By field is also a date.
- Page Size - determines the number of sets per page in Pivot chart or graph. Depending on the display specifications you set, you may want to make this value low.
- Chart Type - determines what kind of chart is used to represent the profile in the item list:
- Bar - represents values in bar form.
- Pie - represents values in pie form.
- Line - represents values in line form.
- Chart Orientation - determines how the chart is positioned. There are two options:
- Horizontal - arranges values horizontally.
- Vertical - arranges values vertically.
- Sort On - determines the basis on which the chart information is sorted. There are two options:
- Grand Total - sorts by the total.
- Group By Field - sorts by the Group By field you specified.
- Descending - sorts starting with the first record and ending with the last.
- Sort Order - determines the order in which records are sorted. There are two options:
- Ascending - sorts starting with the last record and ending with the first.
- Switch Series - switches the Group By and Pivot On fields' positions.
- Toggles - configure additional chart instructions. The options are:
- Show Grand Total - toggles the display of grand total in the Pivot Chart. This value can help add context, but may throw off the scale of the Pivot Chart and reduce readability.
- Show Legend - toggles the display of the Pivot Chart legend. This information can often be intuited from looking at the chart. If not, it can be added.
- Show Blank Values - toggles the display of blank values in the chart.
- Rotate Labels - rotates the group by labels at a 45 degree angle. This can help readability in fields with many values.
- Stagger Labels - another option to improve readability of group by values. Stagger labels varies the horizontal position of the labels to improve readability.
- Show Labels - toggles the value count labels on Pivot Charts.
Show Sub-Chart – toggles the display of sub-chart in Bar Chart, Stacked Bar Chart, and Line Chart.
- Click Save.
Note: Only fields that have been Pivot-enabled will be available to select in this form.