


Monitoring Elasticsearch
There are several tools external to Relativity that you can use to monitor and manage a Data Grid cluster. This page lists several of the most useful tools available with brief overviews of their functionality, installation instructions, and links to further documentation.
This page contains the following sections:
Head
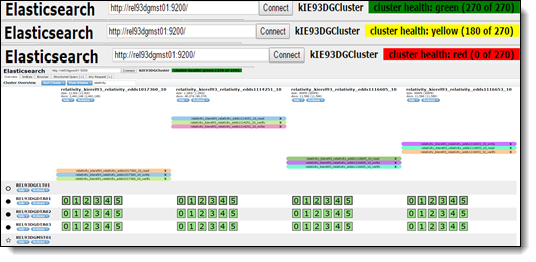
Head shows the overall health of the cluster, which nodes are connected, and the health of the indices. Using head, perform queries from the head console that retrieve JSON results. The head plugin is easily accessible and doesn't require extensive set up.
Head uses three color-coded statuses to report on shard allocation:
- green - all shards are allocated.
- yellow - the primary shards are allocated, but replicas are not.
- red - the primary shard isn't allocated in the cluster.
A red status indicates that the specific primary shard is not allocated in the cluster, yellow means that the primary shard is allocated but replicas are not, and green means that all shards are allocated. The index level status is controlled by the worst shard status. The cluster status is controlled by the worst index status, so what this means is that if a shard or index is red, the cluster will be red and so on. Grey means that the cluster is not connected.
Marvel
Note: You must install Marvel on each node in the cluster in order for it to properly work. Marvel's default settings are configured to store data in the same cluster that it monitors. If you use Marvel to monitor a production cluster, you must send the data to a secondary monitoring cluster. See this site for more information on setting up a secondary monitoring cluster.
The Marvel plugin provides the following features:
- Clusters - The clusters page shows you the clusters you're monitoring and allows you to select them.
- Overview dashboard - The overview dashboard displays a quick look at your cluster performance. The four counters are an aggregate of the entire cluster. If there are any performance issues, investigate the individual components of the cluster.
- Nodes - The nodes section lists all of the nodes that are in the cluster that are being monitored, as well as information on CPU usage, memory usage, disk free space, and the shard they contain. From the nodes section, you can select individual nodes for more detailed information about how those nodes are using the compute allocated to them as well as all indices and shards on the node.
- Indices - Indices show the same counters as the overview dashboard, but allow you to get more information on individual indices. Some indices on your cluster will be larger than others and require more monitoring. The indices page shows the size of indices from a data and document count perspective and the index and search rate for each individual index. From here, you can select individual indices to see the state of different shards (primary, replica, relocating, initializing and unassigned) and additional information which can be used to monitor performance.

Use the following steps to install Marvel and Sense on the monitoring cluster.
- Open the command prompt and navigate to the kibana/bin folder.
- Enter the following command to install Marvel:
kibana plugin --install elasticsearch/marvel/2.1.2
Note: Marvel versions must match the Data Grid version.
- Enter the following command to install Sense:
kibana plugin --install elastic/sense
- Open http://<<machine-name>>:5601/ to view Kibana.
Performing offline installations of Marvel
Use the following steps to download and install Marvel on a machine that doesn't have access to the internet.
- Download the installer from this URL on a machine that has internet:
http://download.elasticsearch.org/elasticsearch/marvel/marvel-latest.zip
- Save the zip file on the C: drive of your cluster node.
- Open a command prompt and execute the following command:
C:\RelativityDataGrid\elasticsearch-main>bin\plugin -i marvel -u file:///C:/marvel-latest.zip
See this site for more information on using the Marvel plugin.
Curator
The Curator Python API allows you to manage indexes and snapshots with the following features:
- Iterative methods - allow you to retrieve data across the cluster within specified parameters.
- Non-iterative methods - allow you to retrieve data within a single index or snapshot.
- Helper methods - allow you to retrieve values required to complete iterative and non-iterative methods.
You can install Curator on any machine that has access to the cluster. Use the following steps to install Python and Curator:
- Download and install the latest version of Python from this site.
Note: Verify that the version of Python you choose to install includes pip.
- Enter the following command in the Python command line interface (python.exe):
pip install elasticsearch-curator
Cluster metrics to monitor
There are certain metrics that you should always monitor such as availability and status, indexing rate, RAM usage, etc. Review the following sites for information on metrics to monitor:
- See this site for an extensive list of critical metrics.
- See this site for an Elasticsearch guide on monitoring individual nodes.
Monitoring bulk rejections
It is important that you monitor bulk rejections. You can access information on bulk rejections through Sense.
Use the following query to access information on bulk rejections for the cluster:
GET /_cat/thread_pool?v&h=id,host,bulk.active,bulk.rejected,bulk.completedv?
Monitoring backup and recover times
It's important to monitor backup and recovery times to properly set RTO and RPO expectations.
Use the following queries to access information on backup and restore operations:
GET /_cat/snapshots/{snapshotname}?vGET _cat/recovery?v
Additional cluster monitoring information
Use the following queries to access additional monitoring information form the cluster that may be useful to your team:
#Cluster information
Get _cat/health?v
#Node information
GET _cat/nodes?v
GET _cat/nodes?v&h=host,name,node.role,version,build,jdk,uptime
GET _cat/nodes?v&h=name,disk.avail,heap.percent,ram.percent,file_desc.percent,merges.total,segments.count,segments.memory
GET _cat/allocation?v
#Index information
Get _cat/indices?v
Get _cat/indices?v&h=index,tm
Get _cat/count?v/{indexname}#Shard information
Get _cat/shards?v
This page provides a list of the most commonly used queries.
This page contains the following sections:
- Creating and deleting indexes
- Retrieving documents and cluster settings
- Shutting down a cluster
- Backing up clusters
Creating and deleting indexes
Use the following query to create an index:
POST /index_name
Use the following query to delete an index:
DELETE /index_name*
Retrieving documents and cluster settings
Use the following query to retrieve the settings and fields for document mapping:
GET /relativity_relativity_edds1019984_10/_mapping/document
Use the following query to retrieve the settings for the specified index:
GET /relativity_relativity_edds1019984_10/_settings
Use the following query to retrieve the total count of documents in the specified index:
GET /relativity_relativity_edds1019984_10/document/_count
{
  "query": {
    "match_all": {}
  }
}
Use the following query to retrieve the top five documents in the specified index:
GET /relativity_relativity_edds1019984_10/document/_search?size=5
{
  "query": {
    "match_all": {}
  }
}
Use the following query to retrieve the documents containing a specified term:
POST /relativity_relativity_edds1019984_10/document/_search
{
  "query": {
    "query_string": {
      "query": "happy",
      "fields": [
        "Fields.ExtractedText.Value"
      ]
    }
  }
}
Use the following queries to retrieve cluster health information:
GET cat/health?v
GET _cluster/settings
Use the following query to retrieve all nodes detected by the master node:
GET _cat/nodes?v
Use the following query to retrieve information on the allocation of shards:
GET _cat/allocation?v
Use the following queries to retrieve the state of all indexes in the cluster:
GET _cat/indices
GET _cat/indices?v
GET _cat/indices/logstash*
GET _cat/indices/index_name*
Use the following queries to retrieve all aliases:
GET _cat/aliases
GET _cat/aliases/relativity_integration_edds9999*
Use the following query to update an alias:
POST /_aliases
{
    "actions" : [
        { "add" : { "index" : "relativity_integration_f176bd64-7926-4d59-9838-a88f3dfe9ab7_edds9999_10", "alias" : "relativity_integration_edds9999_10_read" } }
    ]
}
Use the following queries to retrieve and read templates:
GET /_template/
GET /_template/kcuratemplate
GET /_template/audit
Use the following commands to perform maintenance tasks on the cluster:
POST _flush/sync?wait_if_ongoing=true
POST _refresh
POST /relativity_integration_484a7590-3d90-4215-b5ab-e29aa91b99b8_edds9999_10/_refresh
POST _optimize
Shutting down a cluster
To shut down a cluster, copy and paste the following template into the Sense plugin of Kibana and follow the instructions:
##################################

# Reboot procedure for data nodes

##################################

# Step 1
# Disable or delete all Audit Migration agents.

# Step 2
# Check the cluster health.

GET _cluster/health

# Note the cluster health should be green for "status".
# Take note of the number of Data Nodes in "number_of_data_nodes".

# Step 3
# Perform a flush synced

POST _flush/synced
# Ensure there are no failed shards for the sync operation

# Step 4
# Turn off shard allocation

PUT _cluster/settings
{
"persistent": {
"cluster.routing.allocation.enable": "none"
}
}

# Step 5
# Perform maintenance on the node, for example Windows updates, and restart.

# Step 6
# Check the cluster health and wait for the "number_of_data_nodes" to be the same as step 2. You may need to run the command multiple times as the node comes online.

GET _cluster/health
# Note: After the data node comes online, the cluster will remain in "status" yellow

# Step 7
# Turn shard allocation back on.

PUT _cluster/settings
{
"persistent": {
"cluster.routing.allocation.enable": "all"
}
}

# Step 8
# Check the cluster health and esure it is green.

GET _cluster/health
# Note you may need to run the command multiple times until the "active_shards_percent_as_number" is 100

# Step 9
# Repeat these steps for the remaining nodes that need maintenance.

##################################

# Additional notes

# Single node clusters do not need to go through these steps. They can be rebooted once the migration agents are turned off.

# Clusters with single master nodes will go down completely when the master node is rebooted. When a single master node is used, make sure migration agents are turned off and reboot the master node.

# For clusters with multiple masters: Reboot each master in turn and allow them to come back up before rebooting the next master. This can be done with migration agents active.

# Client nodes can be rebooted without the above steps as long as migration is not active.
Backing up clusters
Use the following commands for backup and restore operations:
Use the following command to get all backup repositories:
GET /_snapshot/_all
Use the following command to create a backup repository:
PUT /_snapshot/my_backup
{
    "type": "fs",
    "settings": {
        "location": "/shares/backups/my_backup",
        "compress": true
    }
}
Use the following command to create a backup:
PUT /_snapshot/my_backup/snapshot_1
{
    "indices": "relativity_test_loadfile,trial_loadfile",
    "ignore_unavailable": "true",
    "include_global_state": false
}
Use the following command to check running status of a snapshot:
GET /_snapshot/_status
Use the following command to check the status of a specific snapshot even if not running:
GET /_snapshot/my_backup/snapshot_1/_status
Use the following command to restore a backup:
POST /_snapshot/my_backup/snapshot_1/_restore
{
    "indices": "relativity_test_loadfile,trial_loadfile",
    "ignore_unavailable": "true",
    "include_global_state": false,
    "rename_pattern": "relativity_test_(.+)",
    "rename_replacement": "restored_$1"
}