


Creating commonly-used dashboards
This topic walks through the fields to group by and pivot on to create some commonly used dashboards in your case life cycle. With these workflows, you and your case team will be better equipped to explore and prioritize your review, identify patterns and trends across custodians, and develop better review strategies with real-time insight with these dashboards.
Use the examples described below to generate ideas for dashboards you may want to create in your cases.
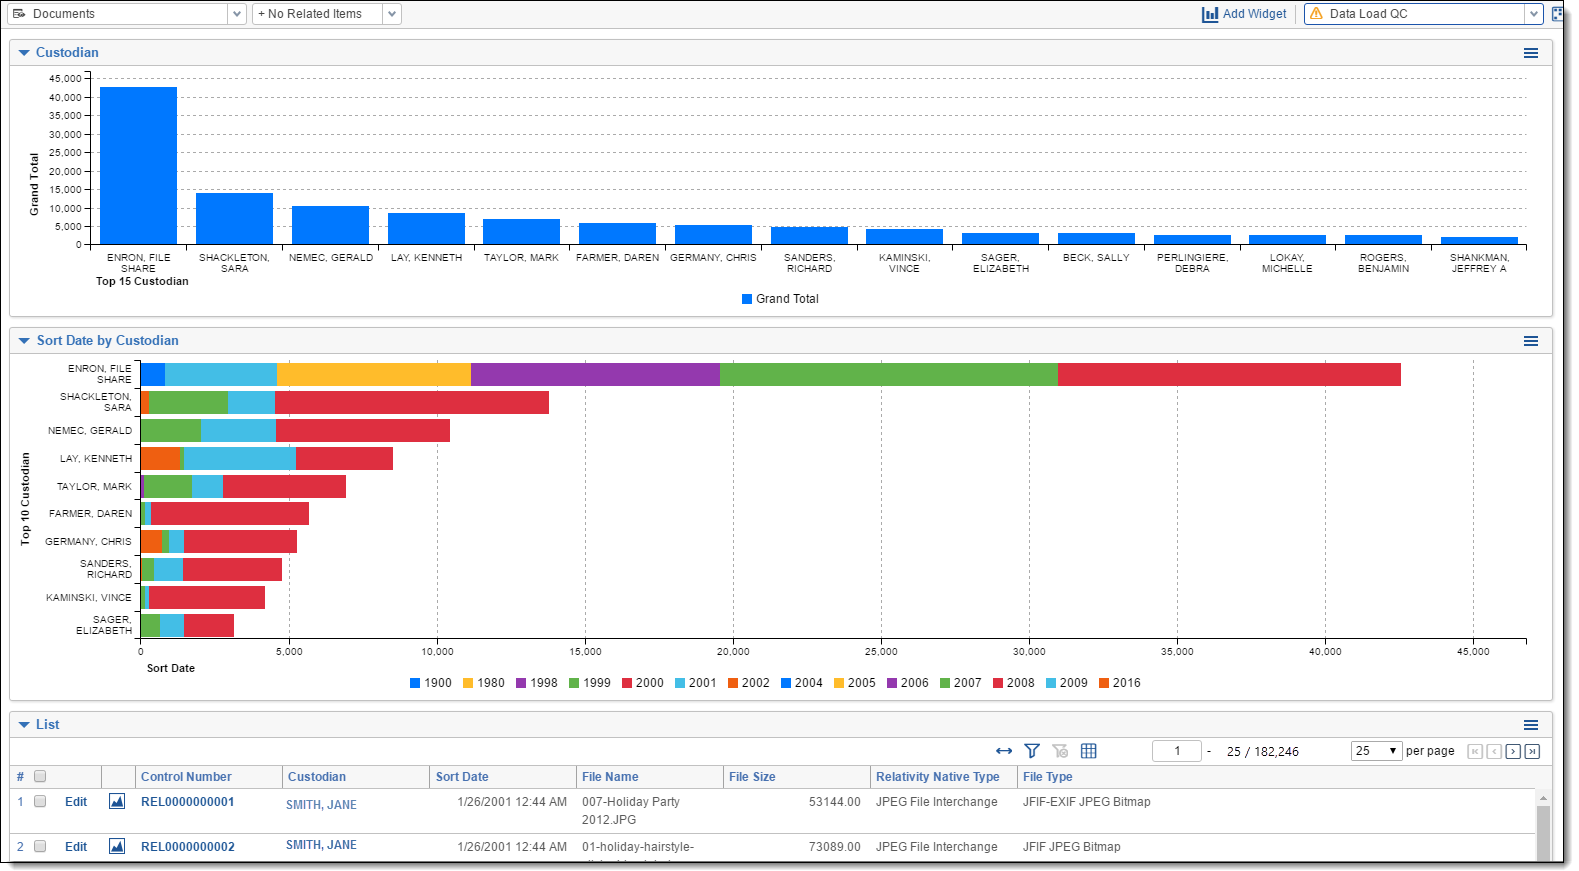
Data Load QC
To create the Data Load QC dashboard, group by and pivot on the following fields:
- Group by Custodian
- Group by Custodian and pivot on Sort Date (Year)
(Click to expand)
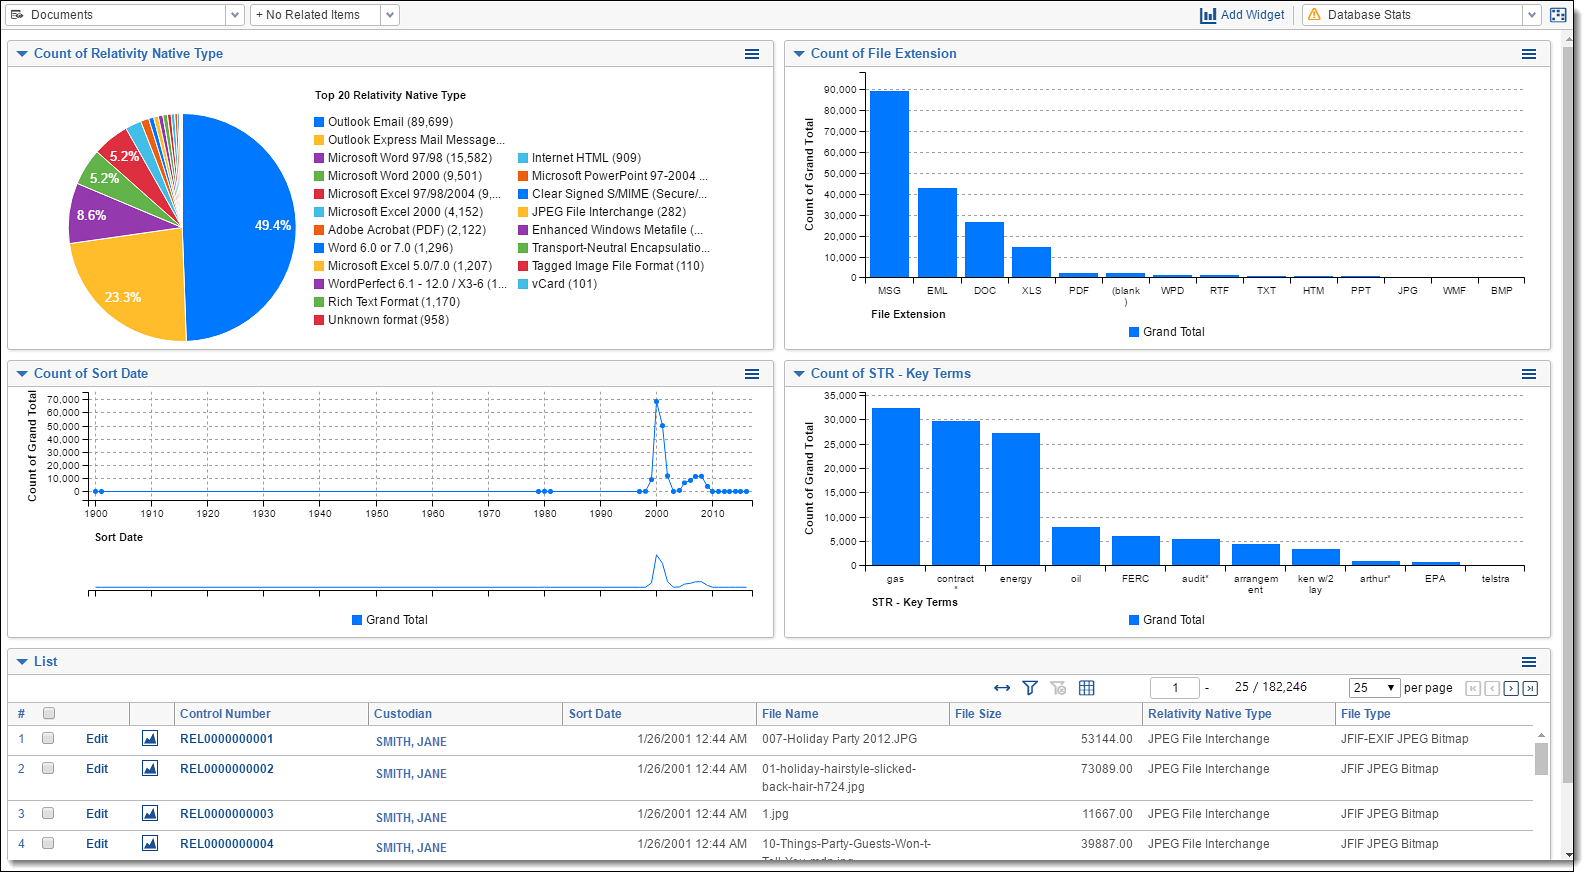
Database Stats
To create the Database Stats dashboard, group by and pivot on the following fields:
- Group by Native Type
- Group by Extension
- Group by Sort Date
- Group by Key Term STR
(Click to expand)
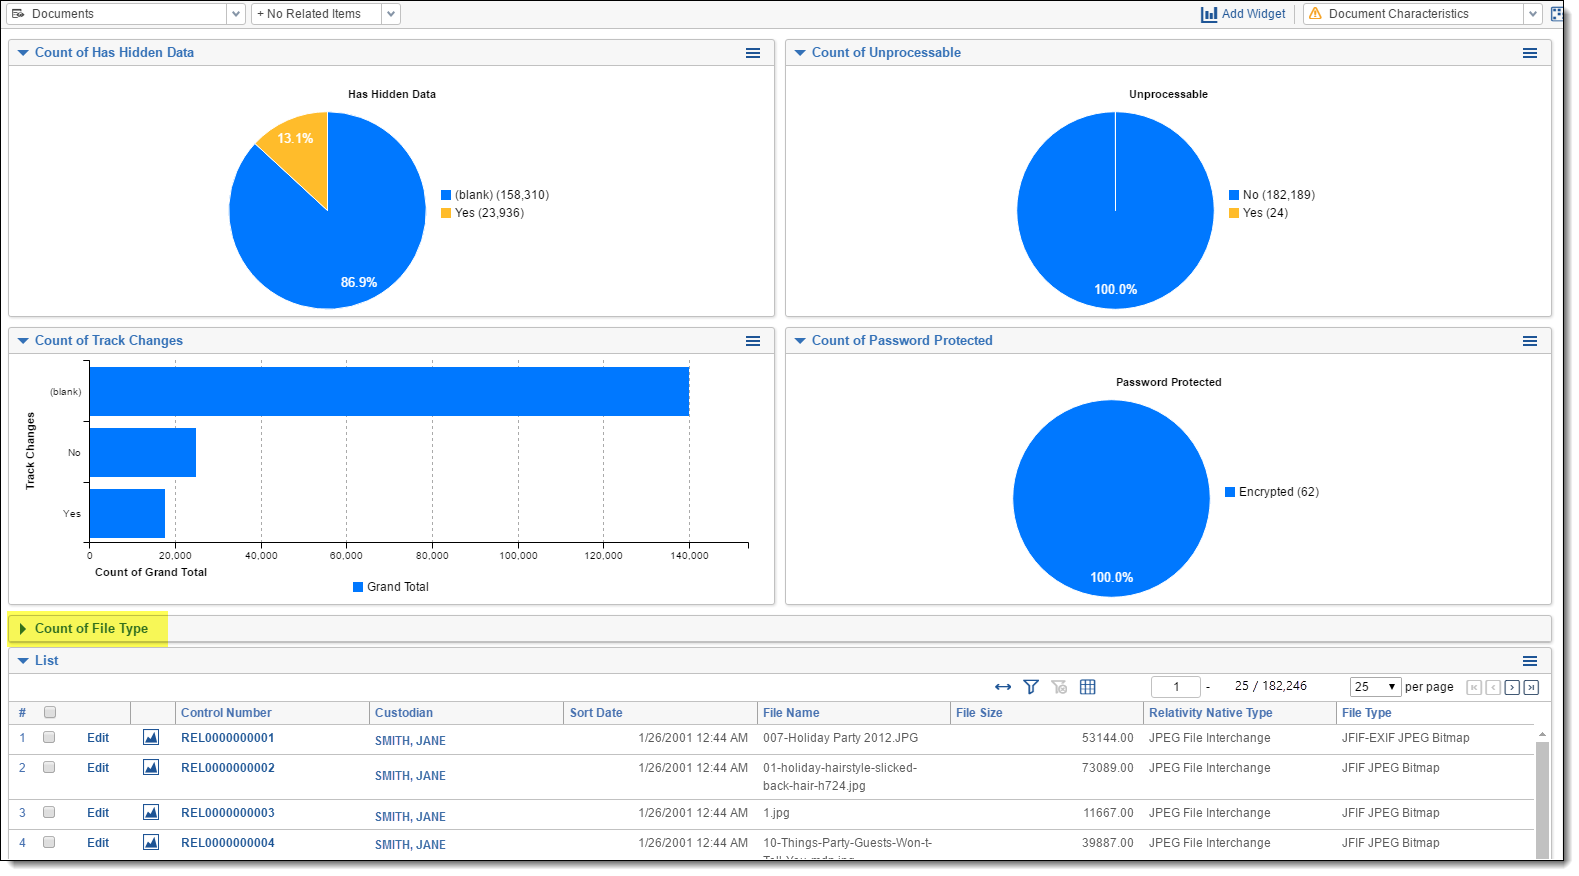
Document Characteristics
To create the Document Characteristics dashboard, group by and pivot on the following fields:
- Group by Has Hidden Data
- Group by Unprocessable
- Group by Track Changes
- Group by Password Protected
- Group by File Type - Note that this field collapsed in the dashboard example below.
Note: You can collapse your widgets (Count of File Type highlighted below). If you save your dashboard with a widget collapsed, it will remain collapsed.
(Click to expand)
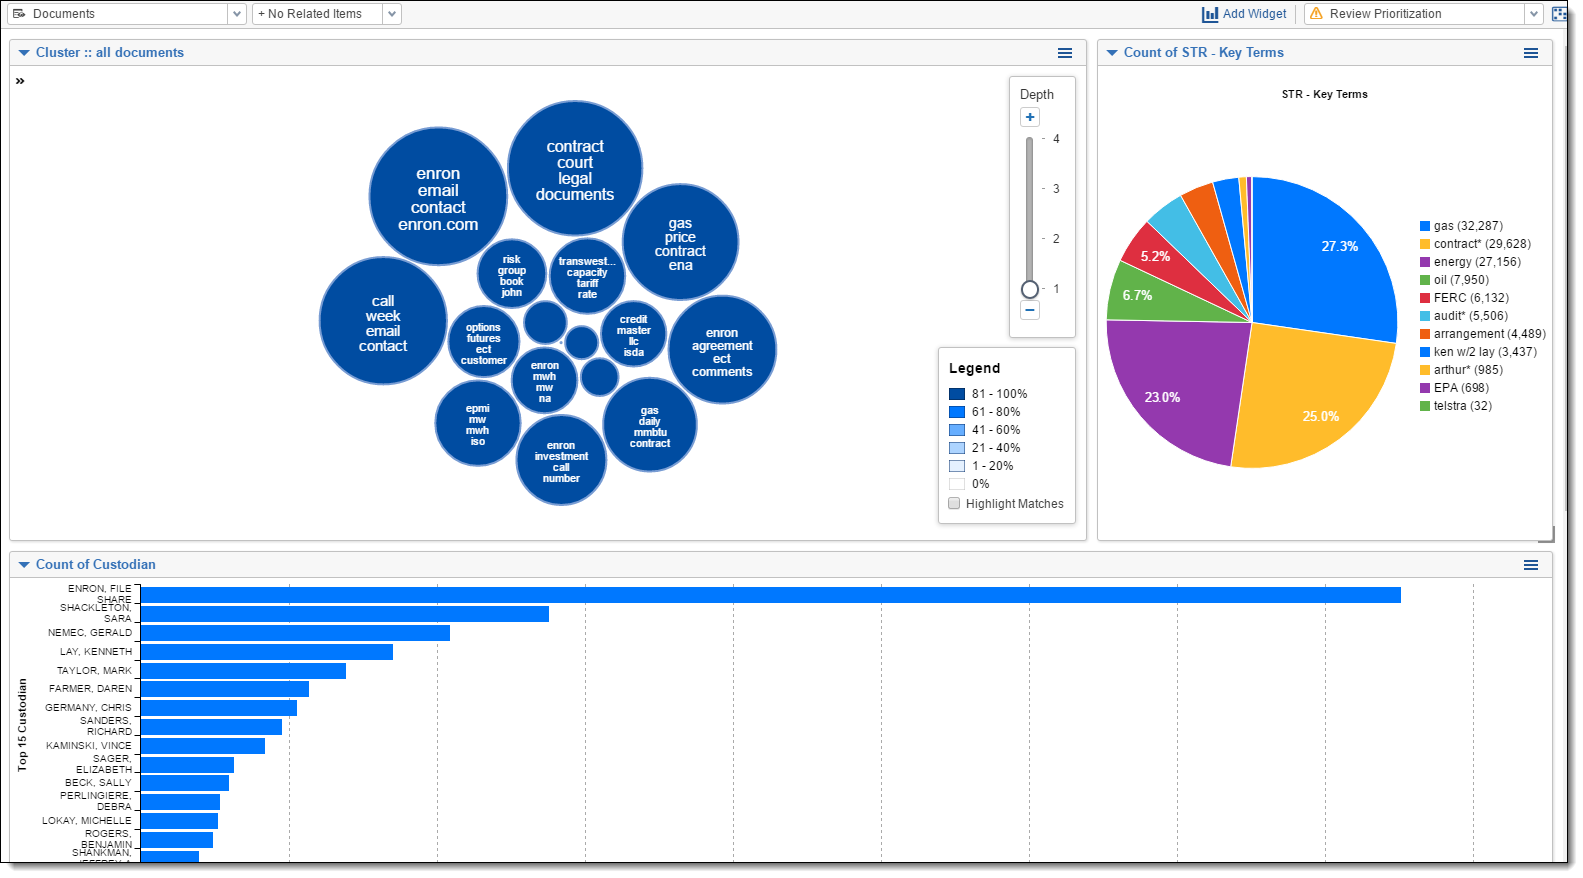
Review Prioritization
To create the Review Prioritization dashboard, group by and pivot on the following fields:
- Cluster Visualization Widget
- Group by Key Term STR
- Group by Custodian
(Click to expand)
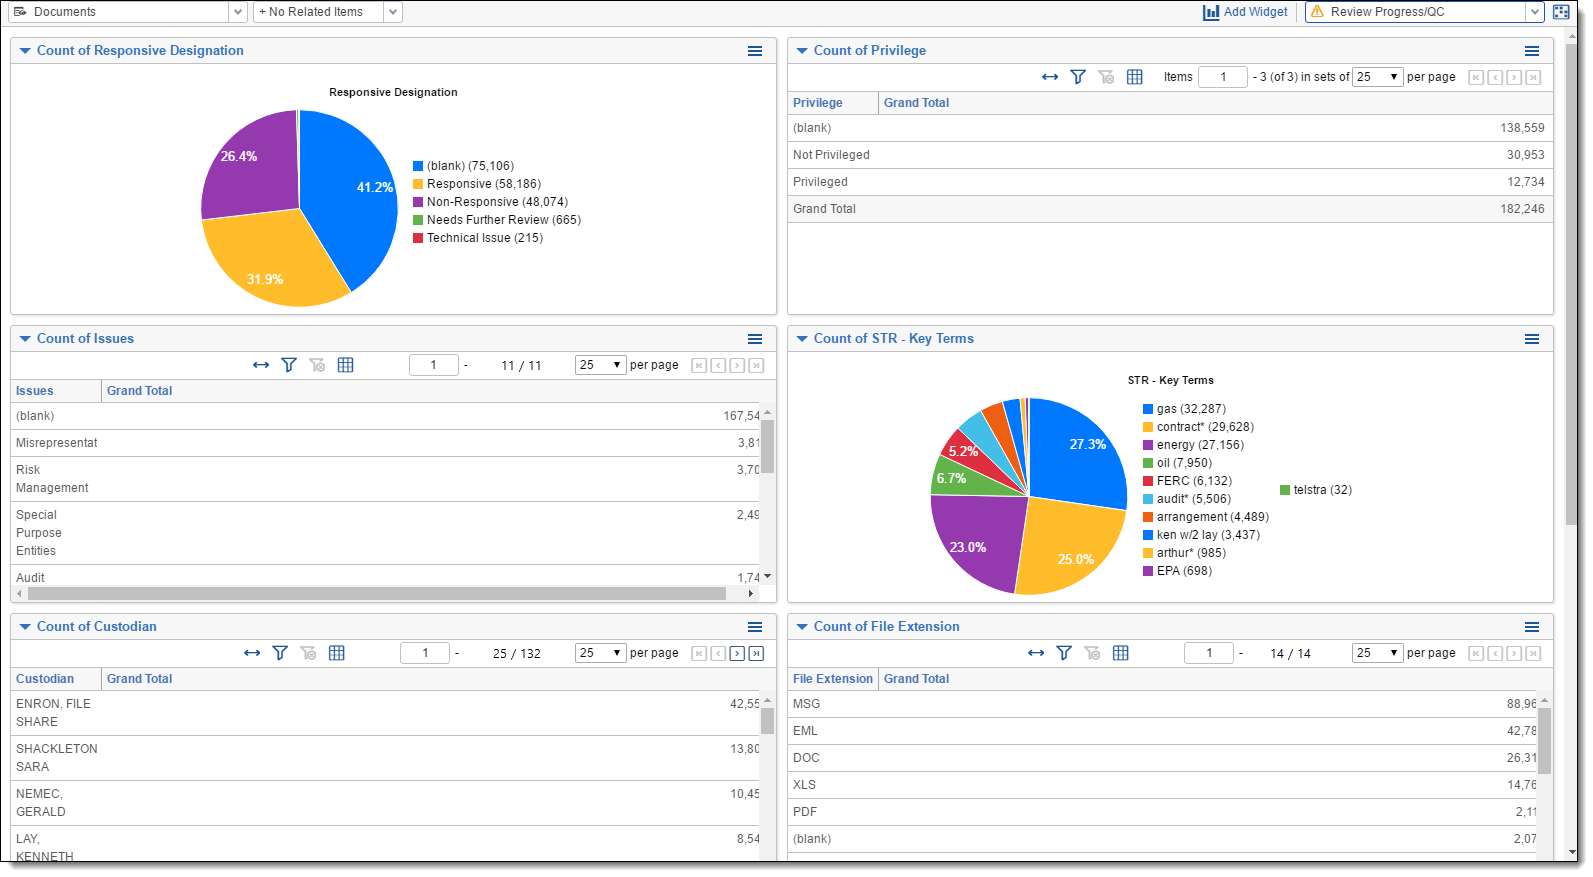
Review Progress/QC
To create the Review Progress/QC dashboard, group by and pivot on the following fields:
- Group by Responsive Designation
- Group by Privilege
- Group by Issues
- Group by Key Term STR
- Group by Custodian
- Group by File Extension
(Click to expand)
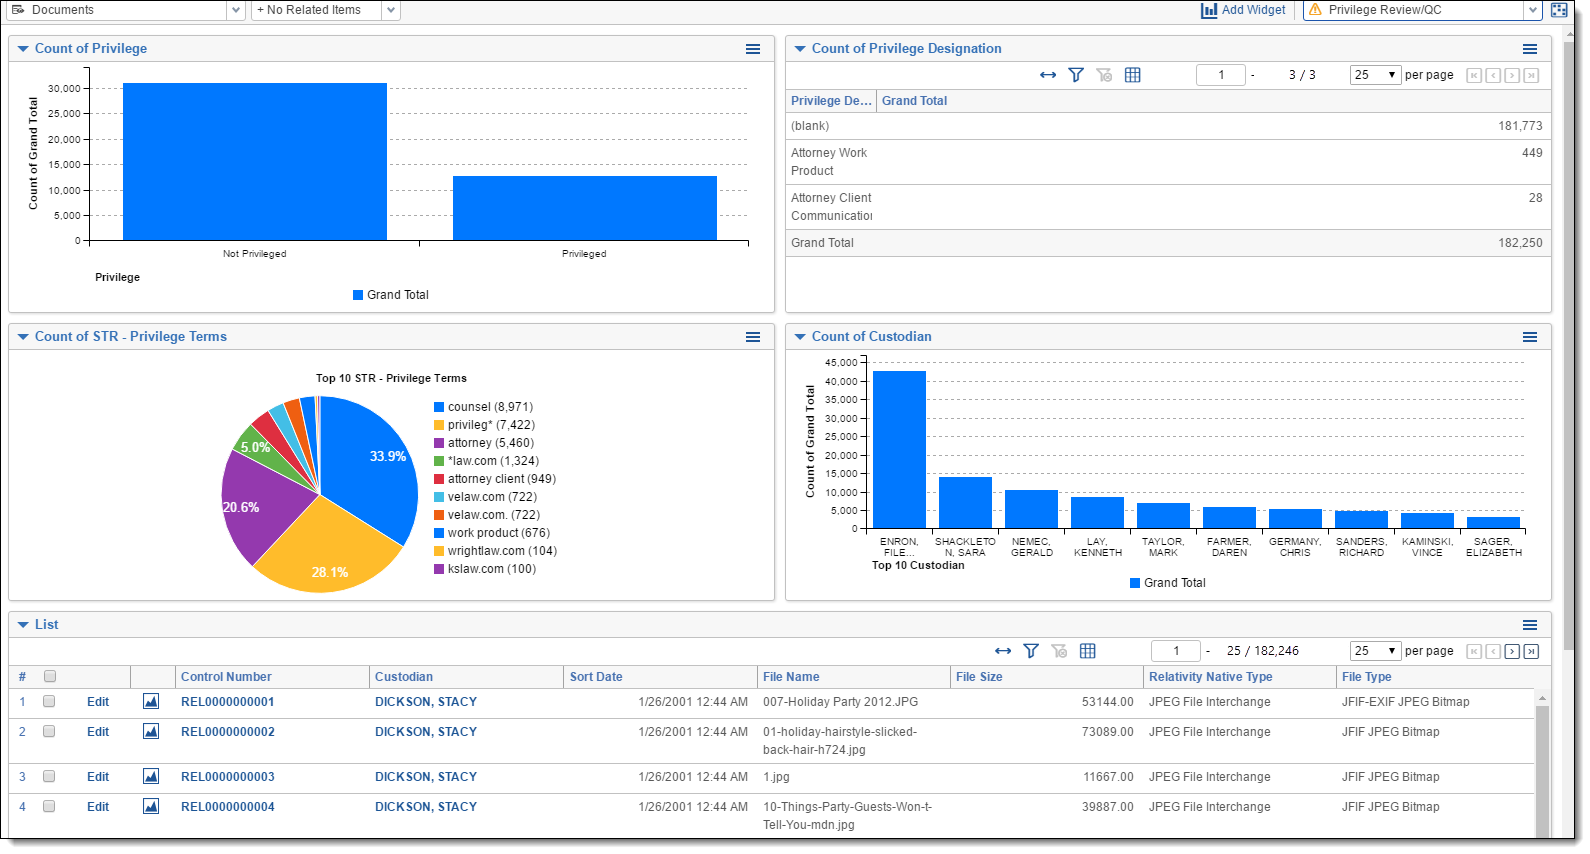
Privilege Review/QC
To create the Privilege Review/QC dashboard, group by and pivot on the following fields:
- Group by Privilege
- Group by Privilege Designation
- Group by Privilege Terms STR
- Group by Custodian
(Click to expand)
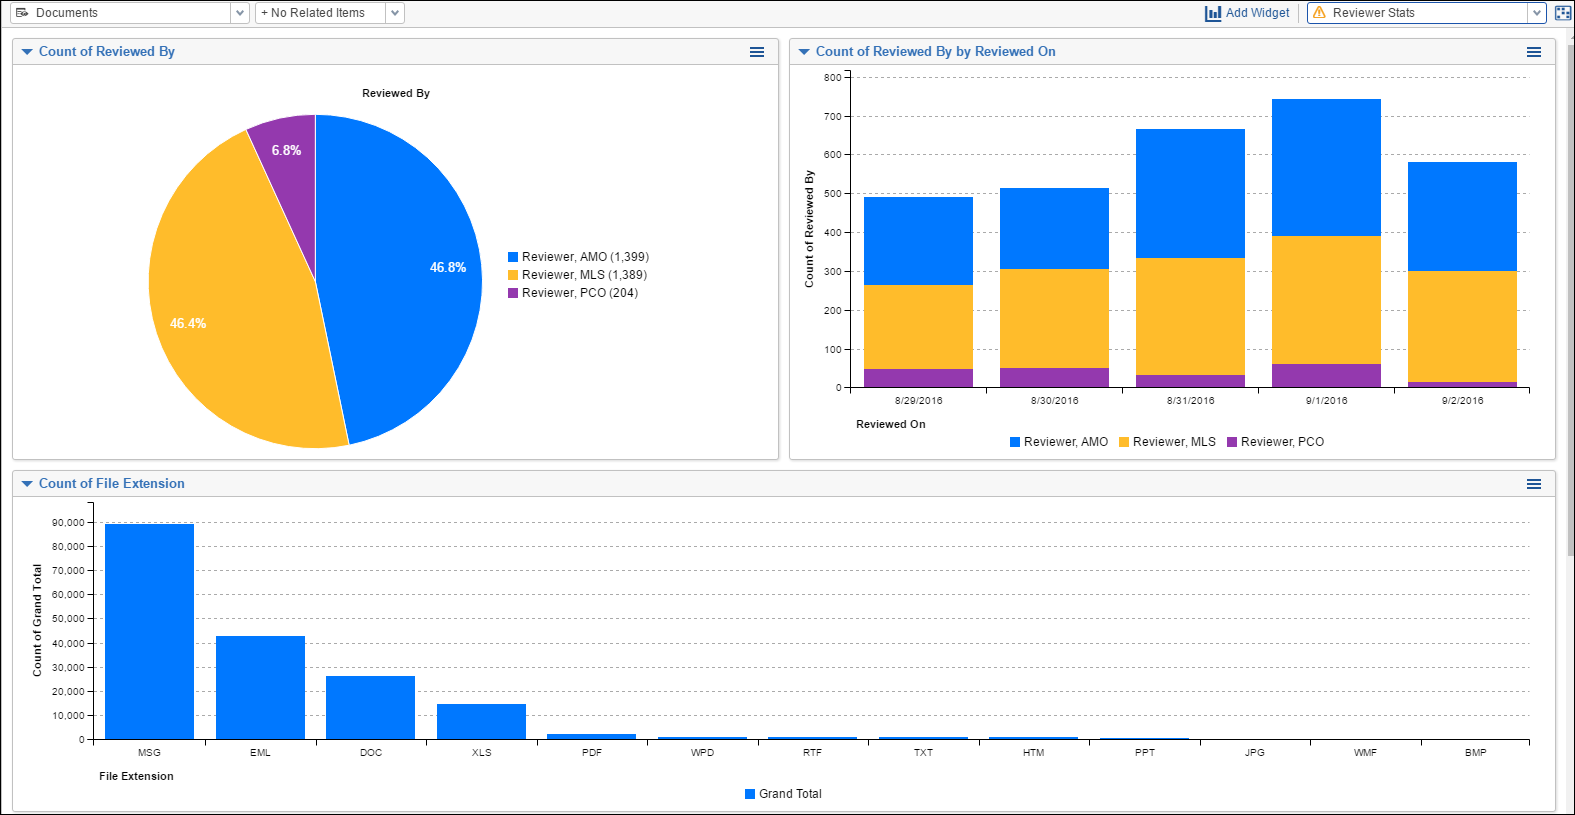
Reviewer Stats
To create the Reviewer Stats dashboard, group by and pivot on the following fields:
- Group by Reviewed By
- Group by Reviewed By and Pivot on Reviewed On
- Group by File Extension
Note: This was created using the Track Document Field Edits by Reviewer application, found in the Relativity Community. It was set up to track the first edit on the Responsive Designation field. If you aren't setting up this application in your template, you'll need to create this dashboard in your workspace, once you’ve installed the application and created the fields.
(Click to expand)
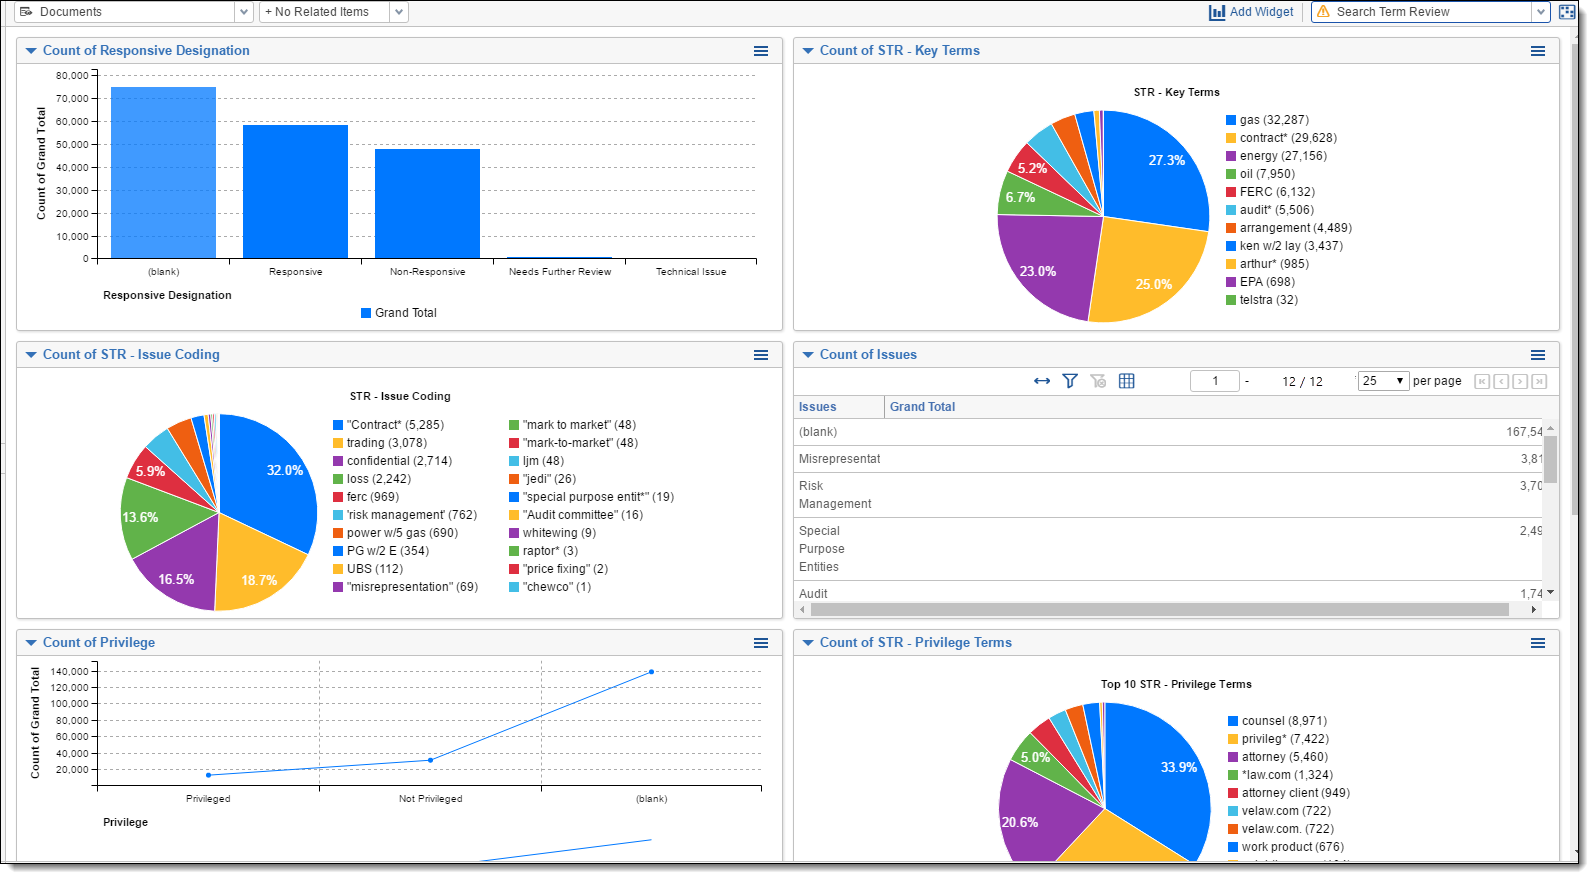
Search Term Review
To create the Search Term Review dashboard, group by and pivot on the following fields:
- Group by Responsive Designation
- Group by Key Term STR
- Group by Issue Coding STR
- Group by Issues
- Group by Privilege
- Group by Privilege Terms STR
(Click to expand)
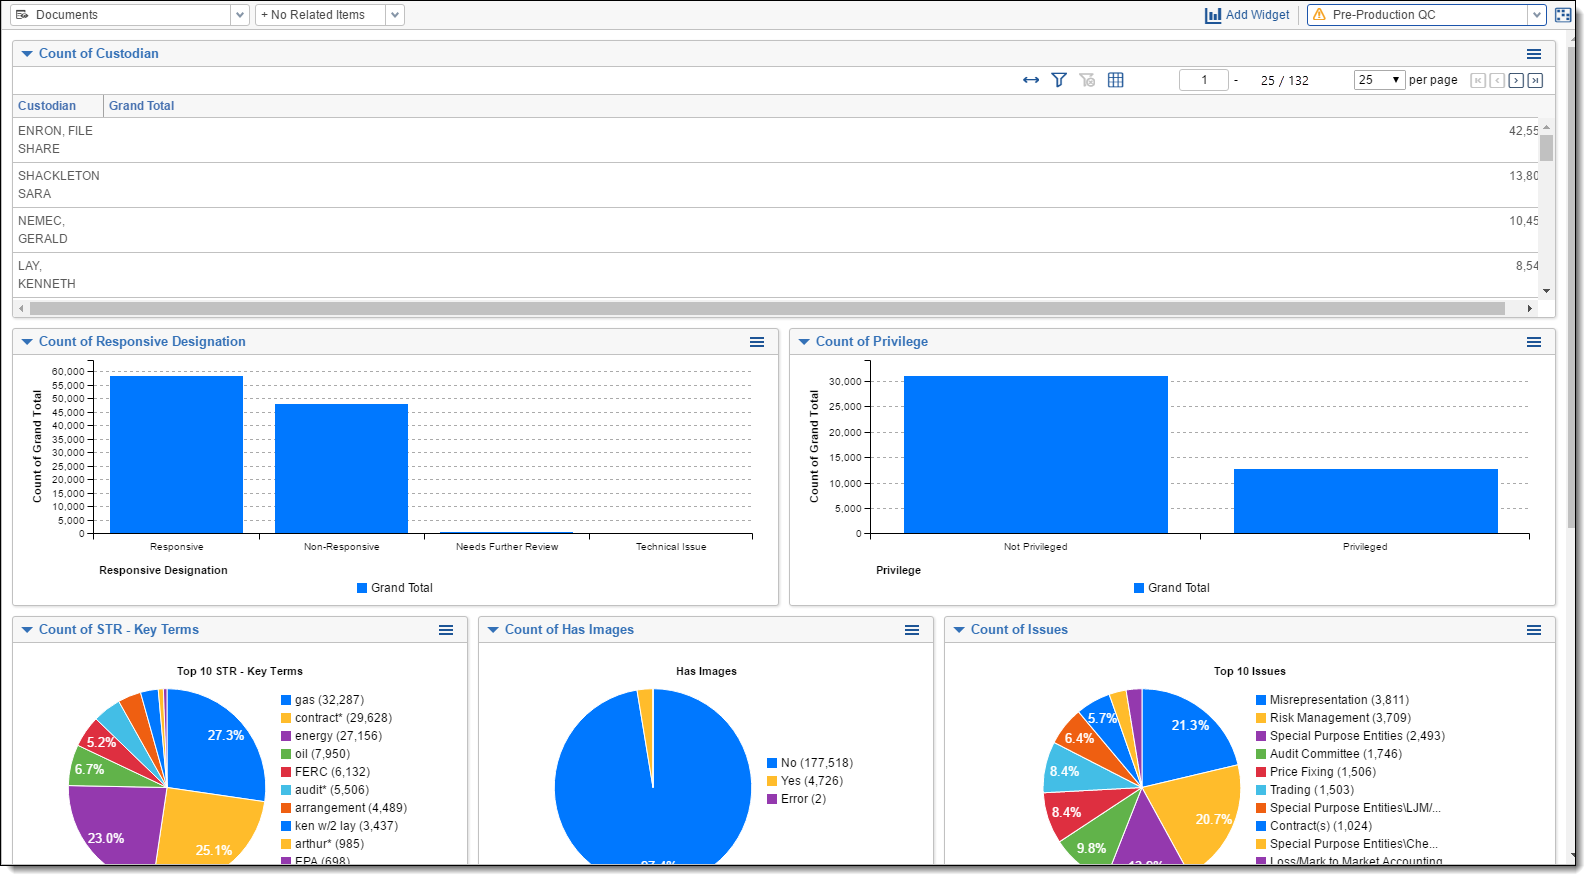
Pre-Production QC
To create the Pre-Production QC dashboard, group by and pivot on the following fields:
- Group by Custodian
- Group by Responsive Designation
- Group by Privilege
- Group by Key Term STR
- Group by Has Images
- Group by Issues
(Click to expand)
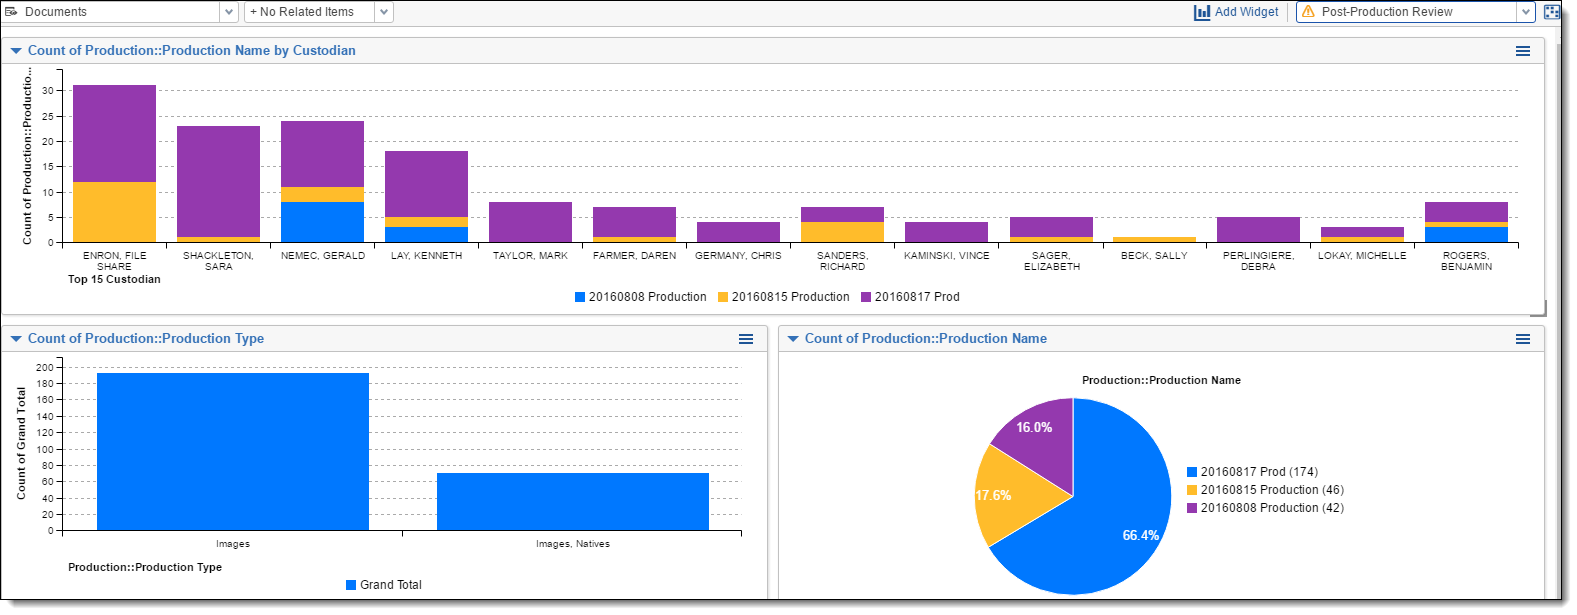
Post-Production Review
To create the Post-Production Review dashboard, group by and pivot on the following fields:
- Group by Custodian and pivot on Production::Production Name
- Group by Production Type
- Group by Production::Production Name
Note: Currently the production fields are not enabled for group by/pivot on and the application is locked. In future releases we plan to have the fields enabled for grouping and pivot in the production application.
(Click to expand)
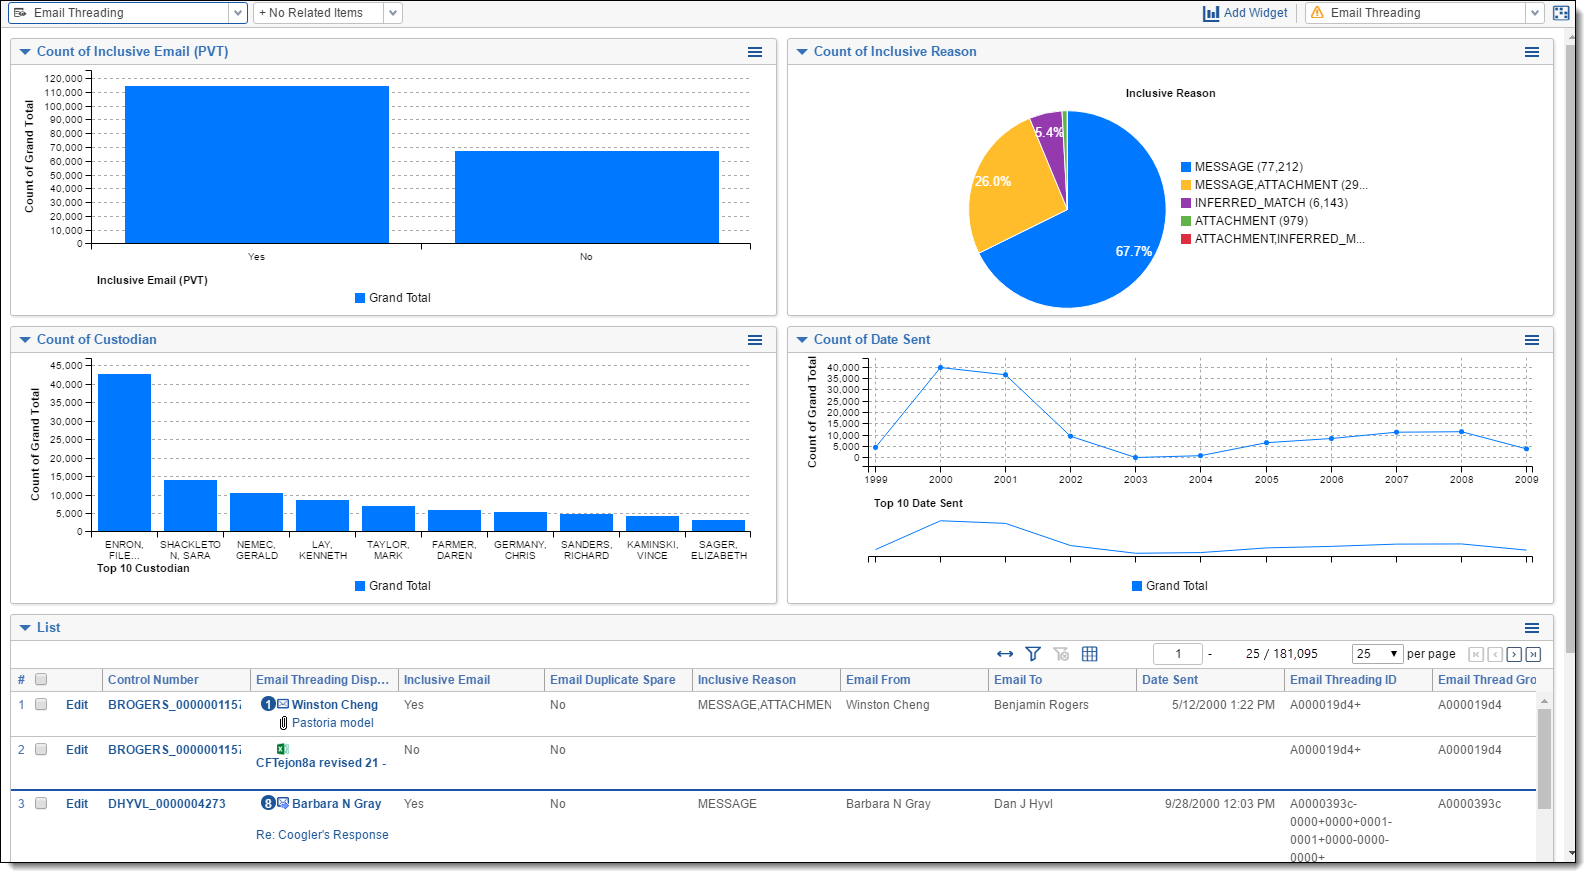
Email Threading
To create the Email Threading dashboard, group by and pivot on the following fields:
- Group by Inclusive Email
- Group by Inclusive Reason
- Group by Custodian
- Group by Date Sent (year)
Note: We recommend using your Email Threading view with this dashboard.
(Click to expand)
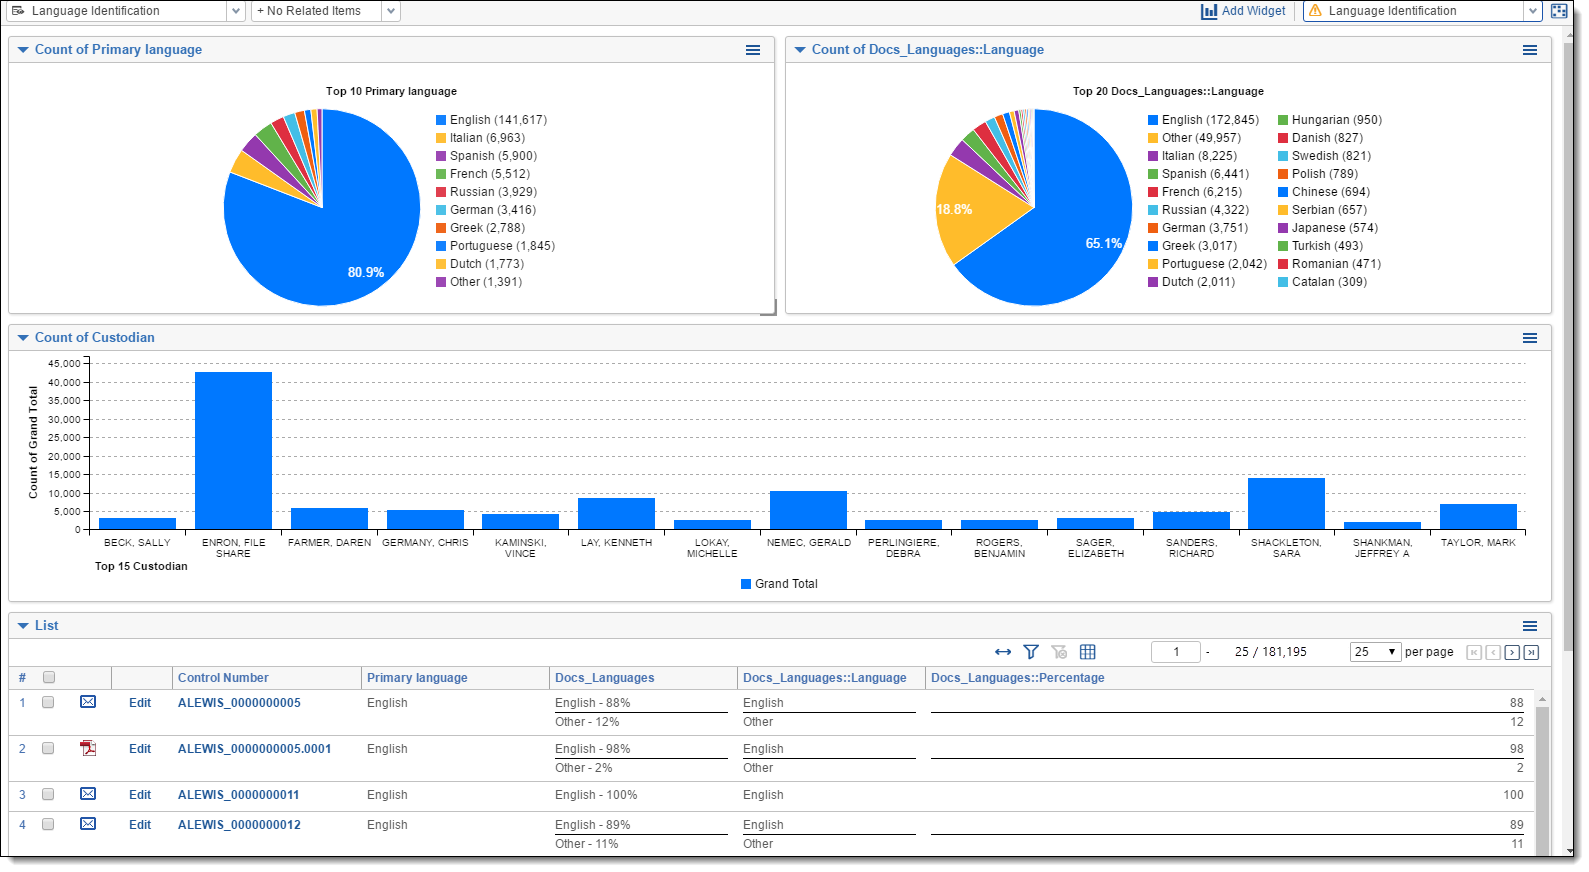
Language Identification
To create the Language Identification dashboard, group by and pivot on the following fields:
- Group by Primary Language
- Group by Docs_Languages::Language
- Group by Custodian
Note: We recommend using your Language Identification view with this dashboard.
(Click to expand)
Special considerations
- Create a default Document List dashboard (lowest order number) with only the item/document list, no additional widgets.
- You can only have one Cluster Visualization widget on a dashboard.
- You can create dashboards on other objects.
- Dashboards can be created in your template, so they carry over to your new workspaces. However, some dashboards, such as those with search term report widgets or cluster visualization, will need to be created in the individual workspace once you’ve created your clusters and/or STRs.