Communication analysis
The Communication Analysis widget is a dashboard widget for Analytics. After running the name normalization operation within structured analytics, you can use this widget to visualize communication frequencies, patterns, and networks between the entities linked to the documents in the view.
Security permissions
The following lists the security permissions required for interacting with the Communication Analysis widget:
| Object Security | Tab Visibility | Other Settings |
Item-level Security
|
|---|---|---|---|
|
|
|
|
*The Communication Analysis Widget permission grants group members permission to add the Communication Analysis widget to a dashboard via the Add Widget drop-down menu. Groups without this permission can still view and interact with the Communication Analysis widget assuming they have access to the dashboard the widget is part of.
- Notes:
- Documents that a user does not have permission to view are omitted from the Communication Analysis visualization. This means that entities that only exist in those documents are not included in the visualization and count calculations are adjusted accordingly.
- Entities that a user does not have permission to view are omitted from the Communication Analysis visualization.
Adding the Communication Analysis widget to your dashboard
To add the Communication Analysis widget:
- Navigate to the Documents tab.
- Click Add Widget to display a drop-down menu.
- Select Communication Analysis from the Add Widget drop-down menu.
Note: If name normalization has not been run, you can still add the widget, but an error message appears.
Understanding the Communication Analysis widget
The Communication Analysis widget queries and renders entity data directly from the Entity From and Entity Recipient document fields populated by name normalization. For more information, see Name normalization. The widget counts each document as one communication between the top segment senders (Entity From) and recipients (Entity Recipient). It does not display or count entities found in lower segments of an email document (Entity Participant). By default, the visualization displays the largest 500 communicating entities identified within the document list view. Entities that fall outside the top 500 are not rendered in the visualization, even though they are still communicators within the document view. The communication counts are only based off of the entities rendered in the visualization.
- Notes:
- For best results, keep all unique documents in your document view rather than inclusive email documents only.
- For best results, remove duplicate email documents so as not to double count a single communication.
Nodes
Each entity is represented by a blue circle called a node. Nodes are sized based on the number of times the entity appears in the Entity From and Entity Recipient document fields, which represents the total amount of communications the entity was involved in. By looking at the size of the nodes in comparison to one another, you can determine the entity that communicated on the most documents.
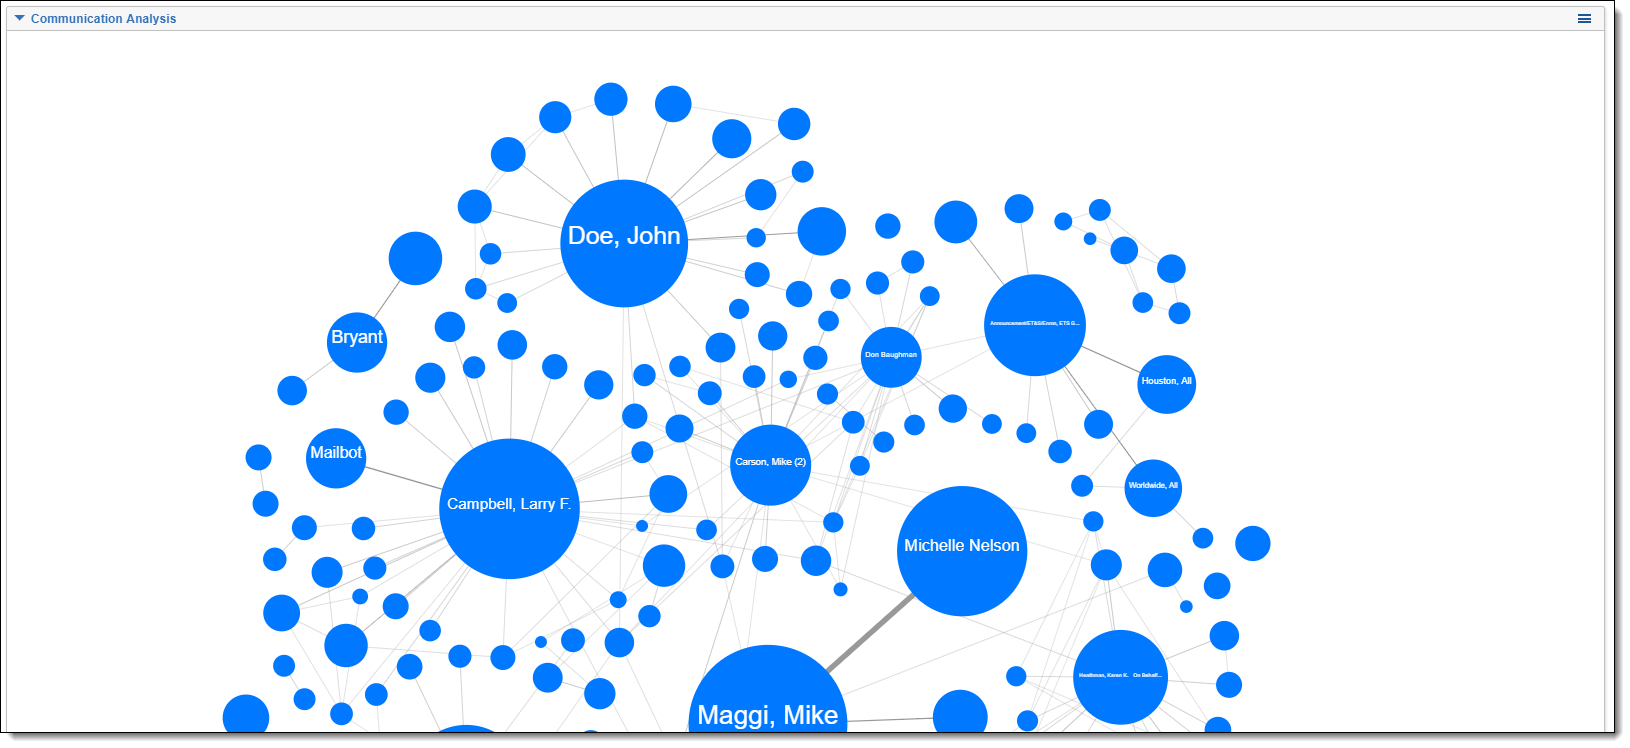
Links
Links are the gray lines that represent the communication between two entities. The width of the link between two entities is based on the amount of bidirectional communications between the two entities. In other words, the link width represents the number of documents where EntityA/EntityB lives in the Entity From field and EntityB/EntityA lives in the Entity Recipient field.
By looking at the link width, you can determine with whom a certain entity communicated the most.
Communication Analysis widget actions
You can perform the following actions on the Communication Analysis widget:
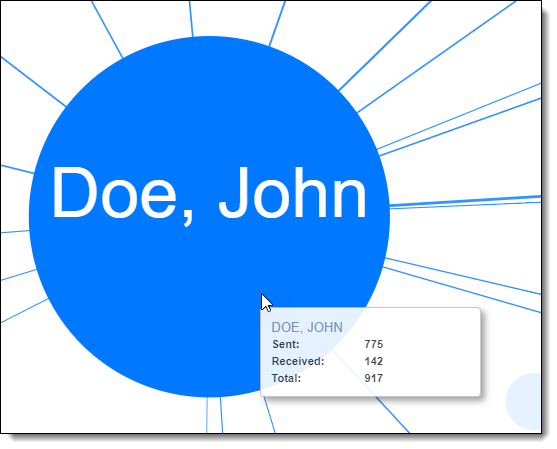
- Hover over a node - hover over a node to view the following details:
- Name of the entity
- Sent - the number of documents where this entity appeared in the Entity From field.
- Received - the number of documents where this entity appeared in the Entity Recipient field.
- Total - the sum of the Sent and Received counts. This value determines the node size.
(Click to expand)
- Left-click - left-click on a node to add a search condition card in the search panel. This action narrows the visualization down to where the selected entity is either a sender or recipient in a document. If Auto-run search is set to On, the document list and visualization automatically re-renders with the search condition applied. If Auto-run search is set to Off, you won't see any changes in the document list or visualization until you run the search. Selecting another node doesn't remove or update the previously added search card. Instead, another search card is added for the new node, separated by an AND statement.
- Filter on document list - you can apply filters on your document list and the Communication Analysis widget updates to display the communicating entities within the new set of documents.
Note: An error message appears if none of the documents in your view have Entity From or Entity Recipient values. This can occur if you have filtered out documents that were analyzed by name normalization.
- Move the visualization - click and drag anywhere to move the visualization within the widget. If the widget moves out of view, click the search button to refresh the widget and bring the visualization back into view.
- Zoom in and out - use the mouse wheel to zoom in and out of the visualization. Zooming in makes all nodes and links appear larger and exposes the full entity name on smaller nodes.
- Maximize or remove widget - click the menu icon in the upper-right corner to maximize the widget to take up the entire view or remove it from the dashboard entirely.