Feedback
Data Store
The Data Store domain provides observability into the core data systems supporting Relativity, focusing on the performance and stability of SQL Server and Elasticsearch components.
SQL Server
Relativity-built dashboards offer detailed insights into SQL Server health, resource usage, and performance trends across multiple hosts.
Available dashboards:
- SQL Overview
- SQL Instance Overview
- SQL Resources
- SQL Disk I/O Details
- SQL Database Activity
- SQL Statistics
- SQL Connections
Elasticsearch
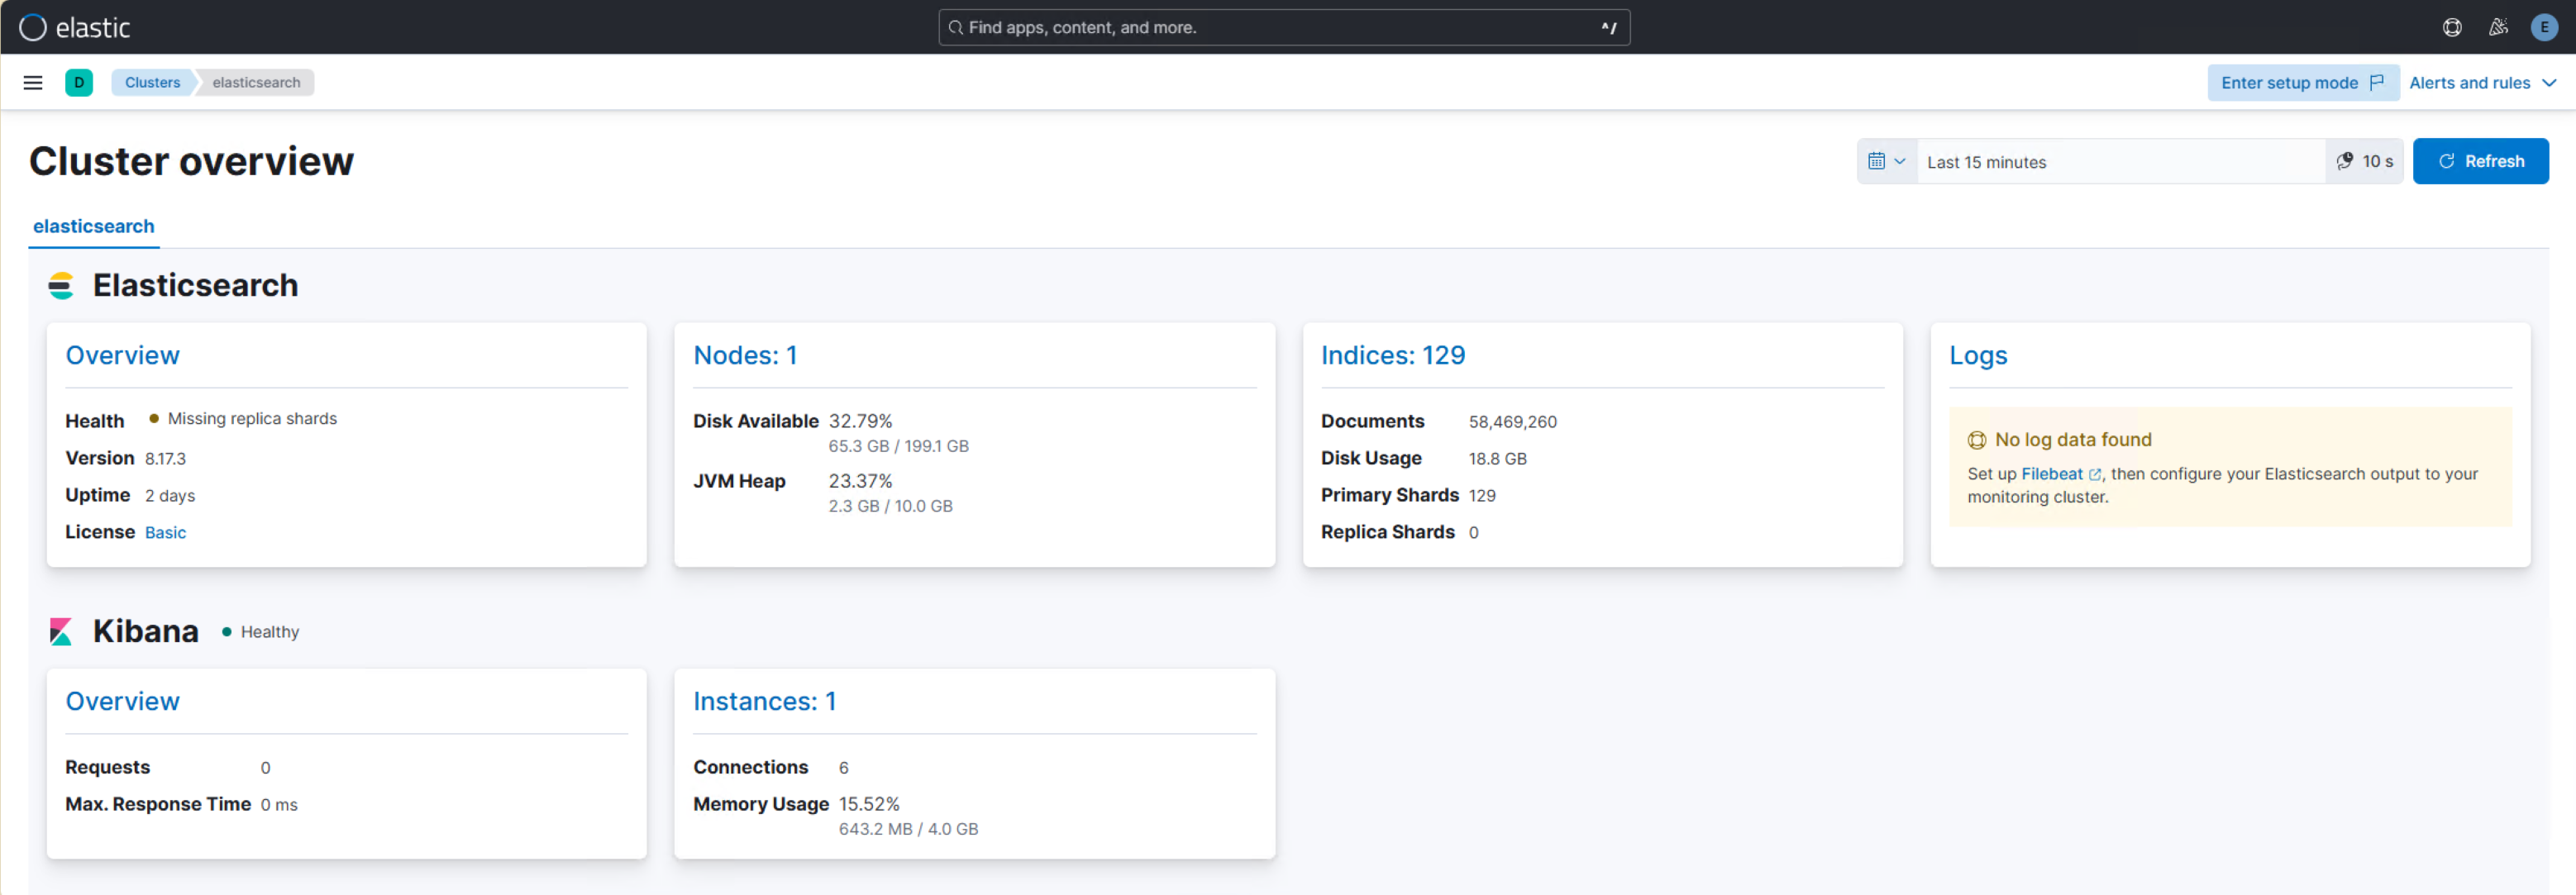
Relativity leverages the built-in monitoring capabilities of Elasticsearch + Kibana (via stack monitoring). Once enabled using the official Elastic Stack configuration, metrics and logs are collected (e.g. via Metricbeat or Elastic Agent), and monitoring data is surfaced through Kibana's Stack Monitoring UI, giving cluster-level and service-level observability (cluster health, node status, Elasticsearch / Kibana metrics, etc.).
- Cluster Overview
- Elasticsearch Overview
- Kibana Overview
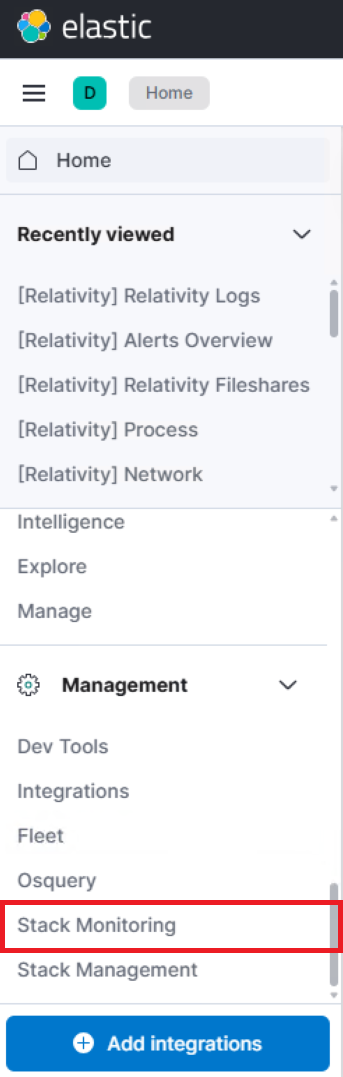
Stack Monitoring is accessed from the main Kibana navigation menu. Navigate to:
Kibana | Menu | Stack Monitoring