


Feedback
SQL Server Database Activity
This dashboard provides a comprehensive view of your SQL Server's performance, memory usage, transaction activity, and query efficiency. By visualizing key metrics, this dashboard helps database administrators quickly identify performance bottlenecks, optimize queries, and maintain overall database health.
Memory and Transaction Activity Overview
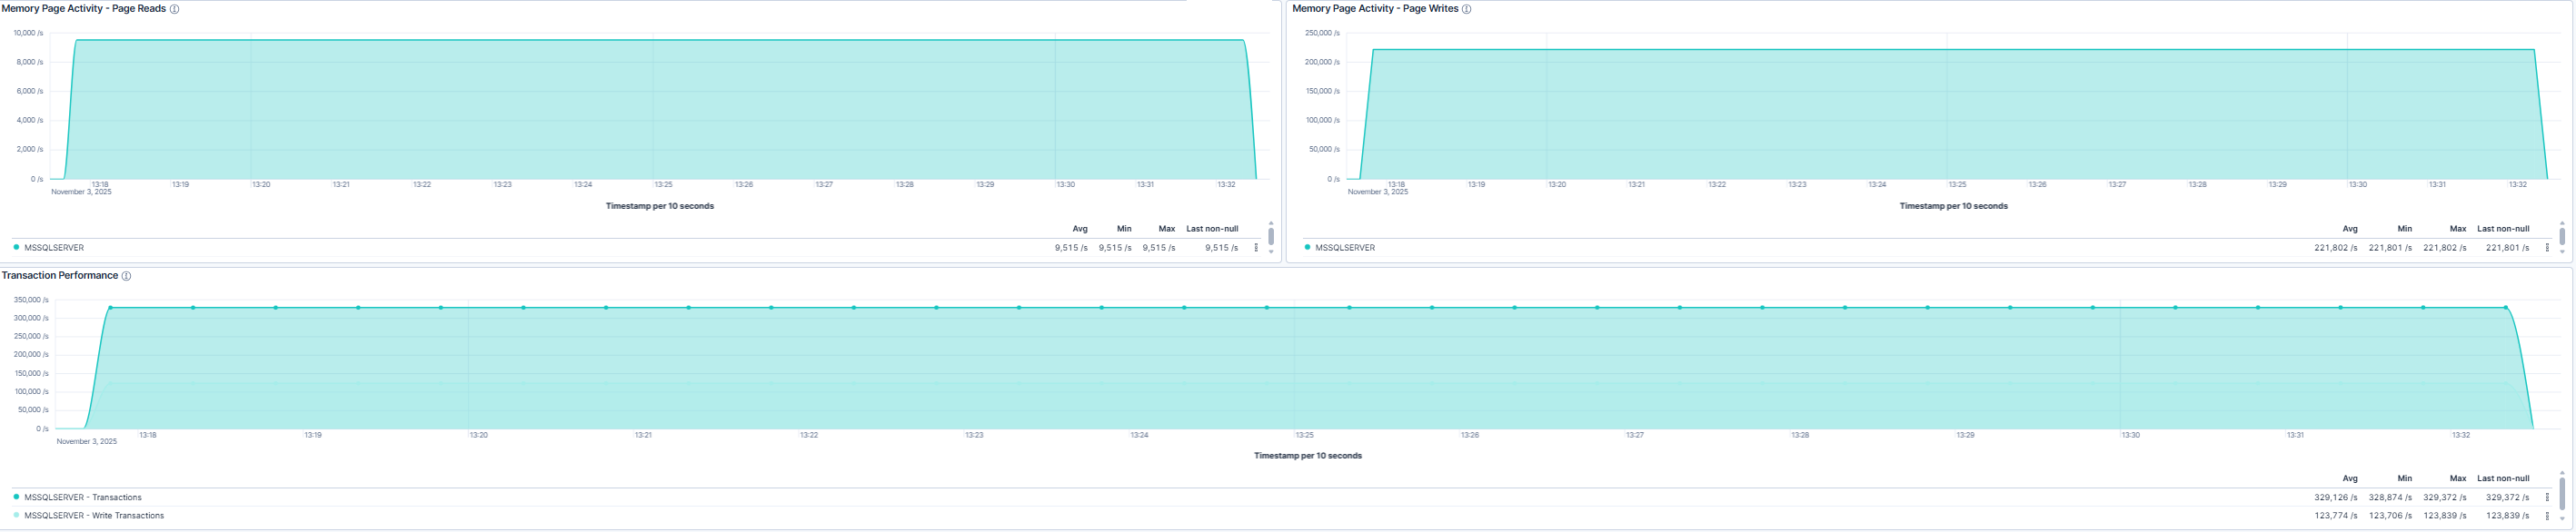
This dashboard shows memory and transaction activity:
- Memory Page Activity - Page Reads: Shows data reads from memory and disk. High reads may indicate missing indexes or table scans.
- Memory Page Activity - Page Writes: Shows data writes to memory and disk. High writes can cause I/O contention and slow inserts/updates.
- Transaction Performance: Tracks total and write transactions. High values may lead to locking, contention, or log growth issues.
Query Performance and Concurrency Overview
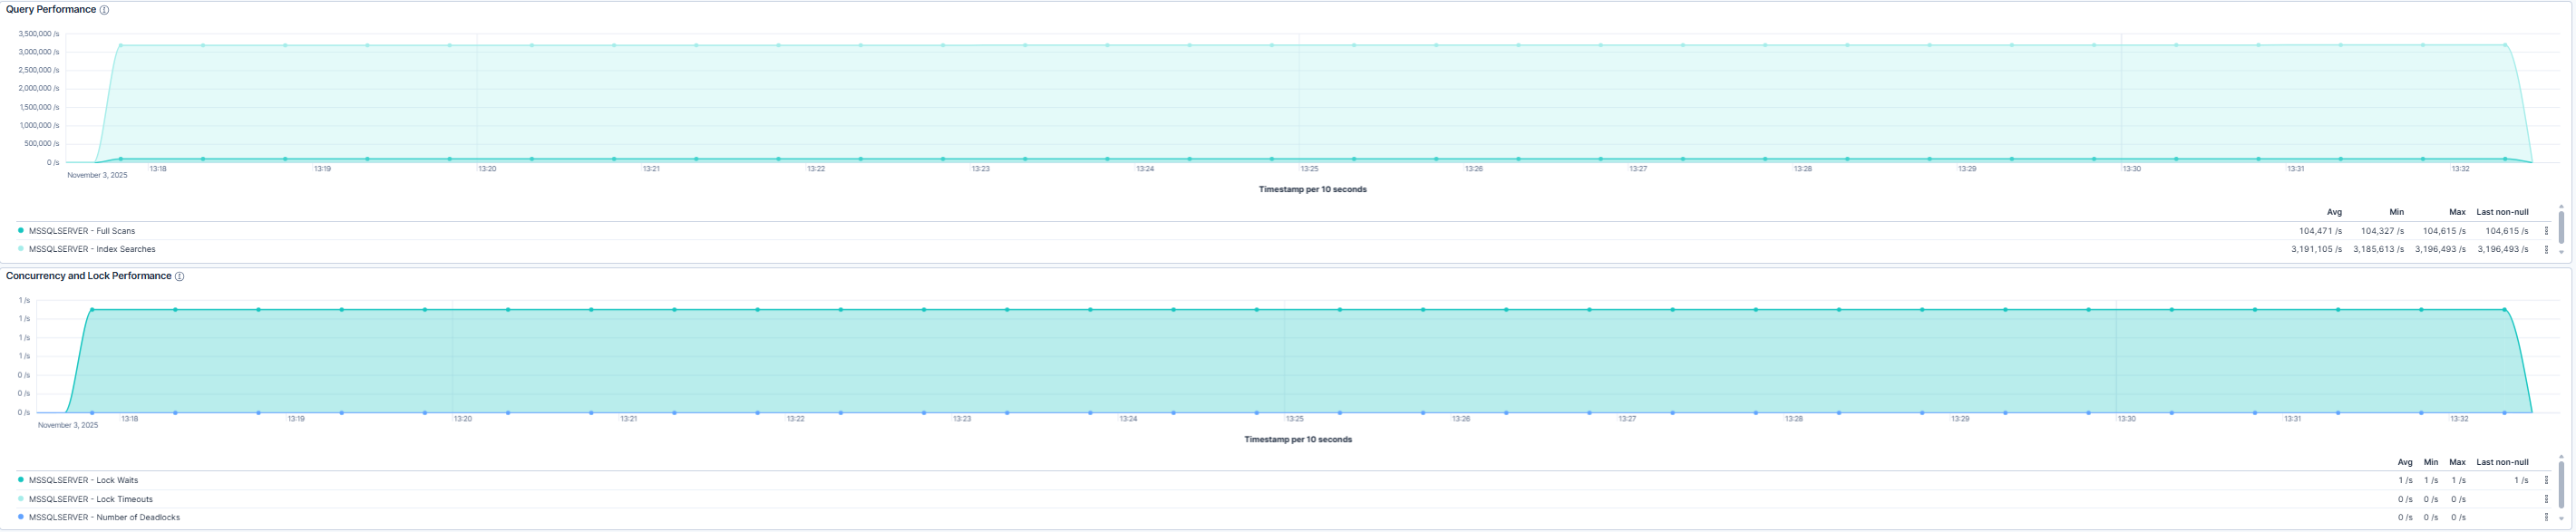
This dashboard shows query efficiency and database concurrency:
- Query Performance: Full table scans indicate slow queries; high index searches signal efficient queries.
- Concurrency and Locks: Lock waits, timeouts, and deadlocks show resource contention and potential performance issues.
Use cases
| Use Case | Description |
|---|---|
| Monitor database performance | Monitor memory usage, page reads/writes, and transaction activity to identify performance bottlenecks. |
| Detect inefficient queries | Detect inefficient queries via full scans and optimize indexes. |
| Track locking and deadlocks | Track locking and deadlocks to maintain smooth database operations. |
| Plan database capacity | Plan capacity based on trends in transactions and I/O activity. |