


Feedback
SQL Server Connections
This dashboard provides an overview of active SQL server database connextions, user activity, and system-level patterns. It helps database administrators monitor who is connected, track connection trends over time, and drill down into specific hosts or instances for deeper analysis.
User and Host Connection Insights
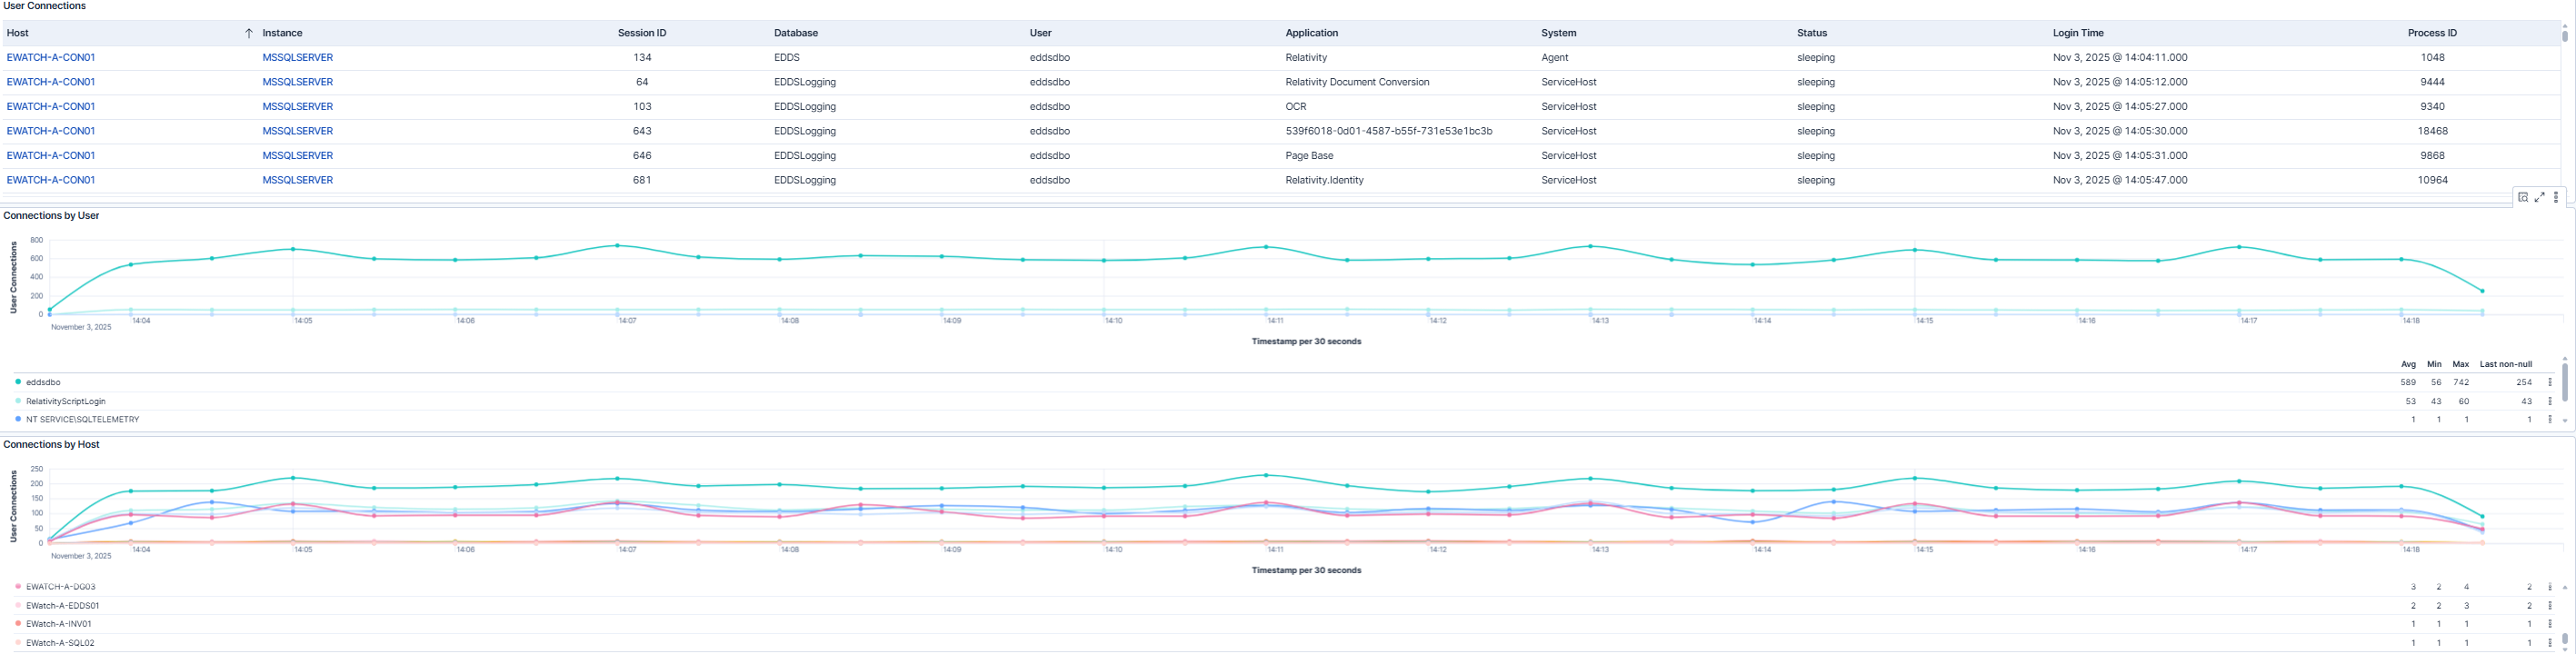
This dashboard displays a table of active connections with details such as host, instance, session ID, database, user, application, system, status, login time, and process ID. The Host and Instance columns are filterable, allowing users to drill down directly from the dashboard. Two accompanying graphs show connections by user and connections by host over time, with the vertical axis representing connection count and the horizontal axis showing timestamps.
System and Application Connection Trends
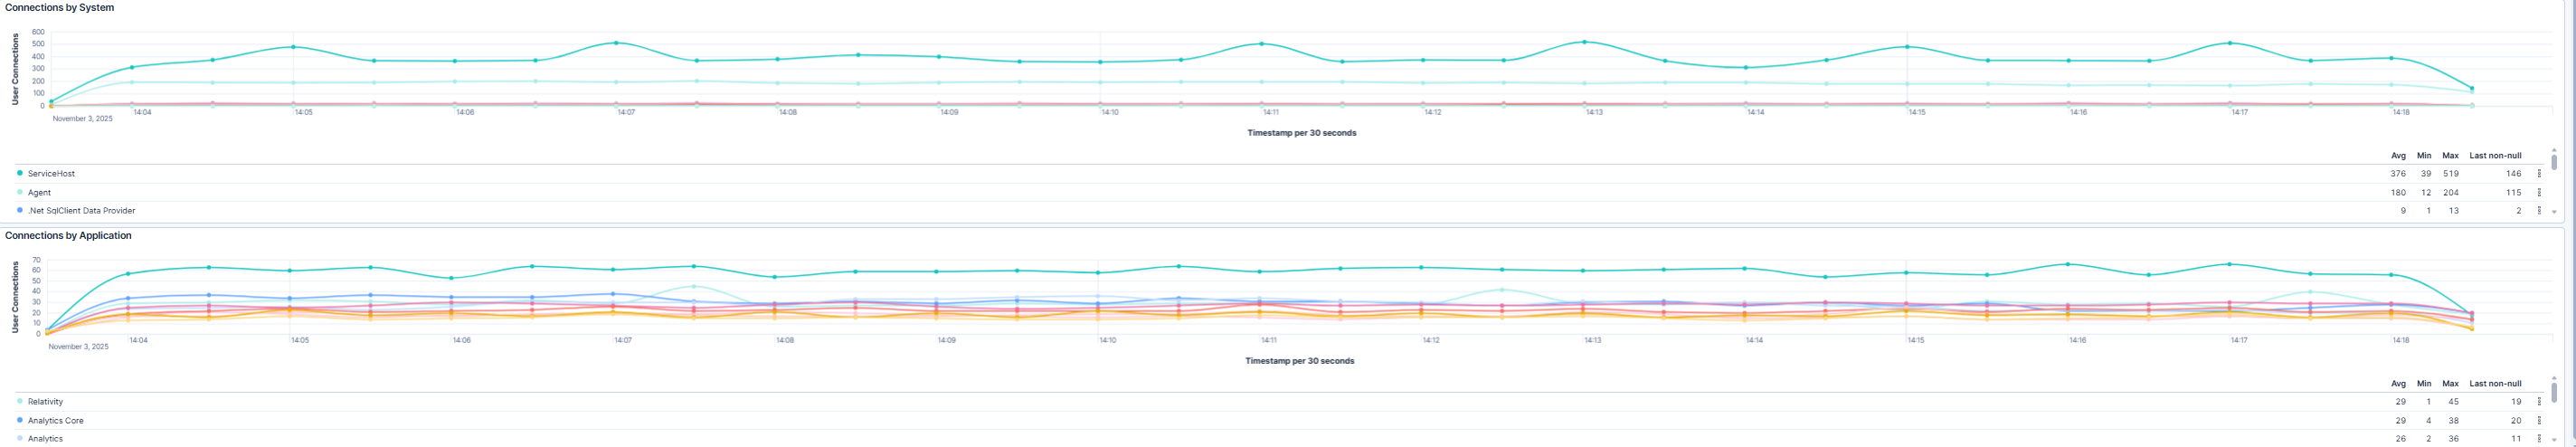
This dashboard highlights connections grouped by system and application. It visualizes how different systems and applications interact with the database over time, helping administrators identify unusual patterns, peak usage periods, or potential bottlenecks. The graphs use connection count on the vertical axis and time on the horizontal axis for easy trend analysis.
Use Cases
| Use Case | Description |
|---|---|
| Monitor active database connections | Monitor active database connections in real-time to ensure system stability. |
| Track connection trends | Track connection trends by user, system, or application to identify peak usage periods. |
| Detect unusual patterns or spikes | Detect unusual patterns or spikes that may indicate potential issues or inefficiencies. |