


Feedback
SQL Server Statistics
This dashboard provides insights into SQL Server query performance and overall database workload. It tracks key metrics such as query execution, compilation, and user activity, helping database administrators understand workload patterns, identify performance bottlenecks, and optimize SQL Server execution plans.
Query Execution and Compilation Metrics
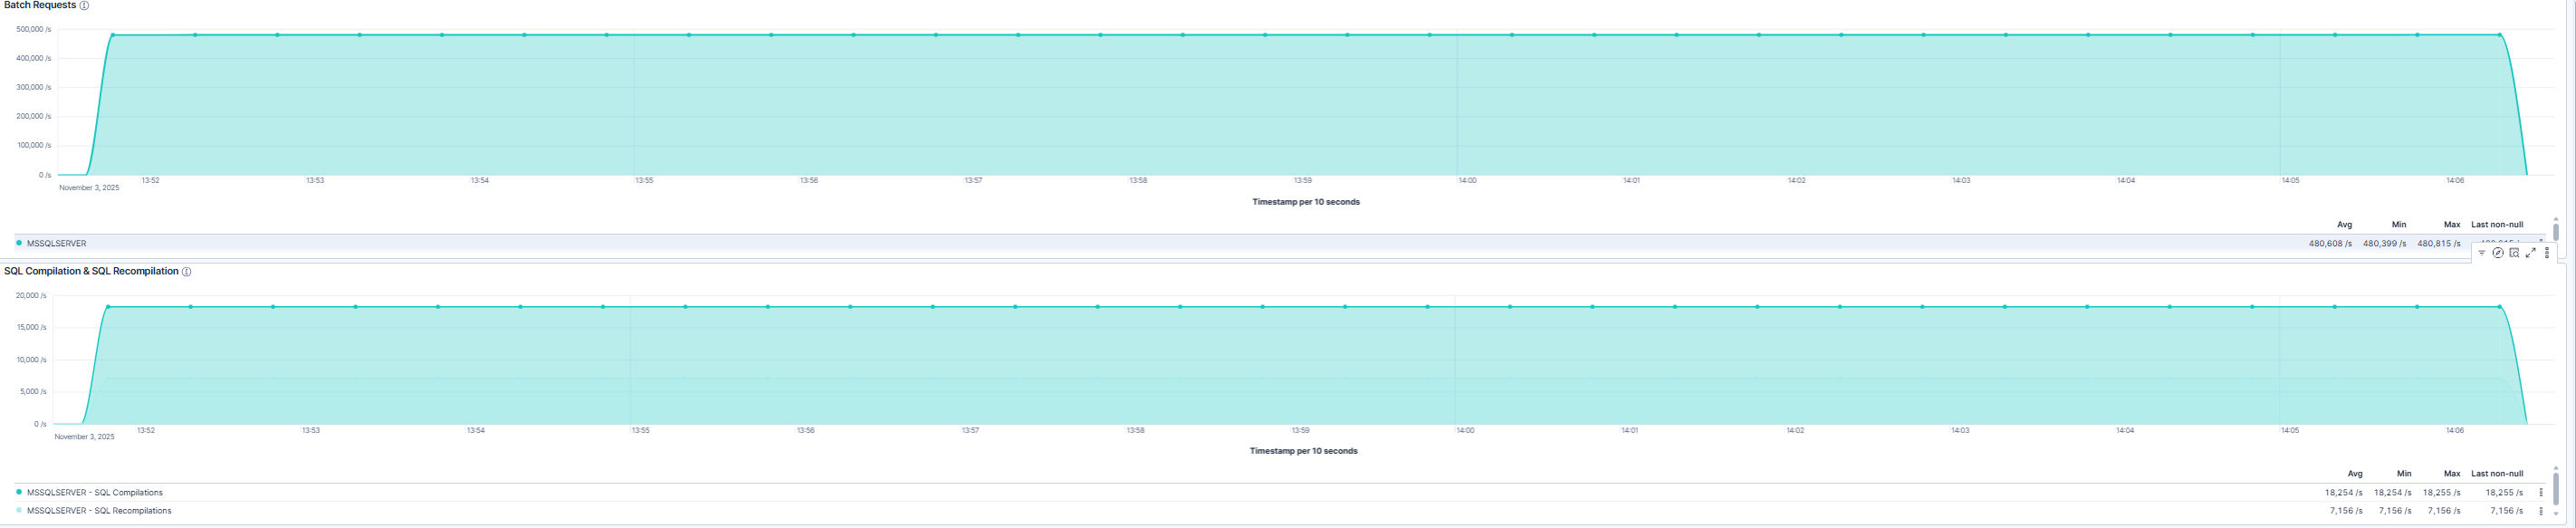
This dashboard shows SQL Server query activity, including the number of batches executed per second and the frequency of SQL statement compilation and recompilation. High compilation or recompilation rates may indicate inefficient query plans or frequent schema changes, while batch request metrics help track overall workload intensity.
User Activity and Process Monitoring
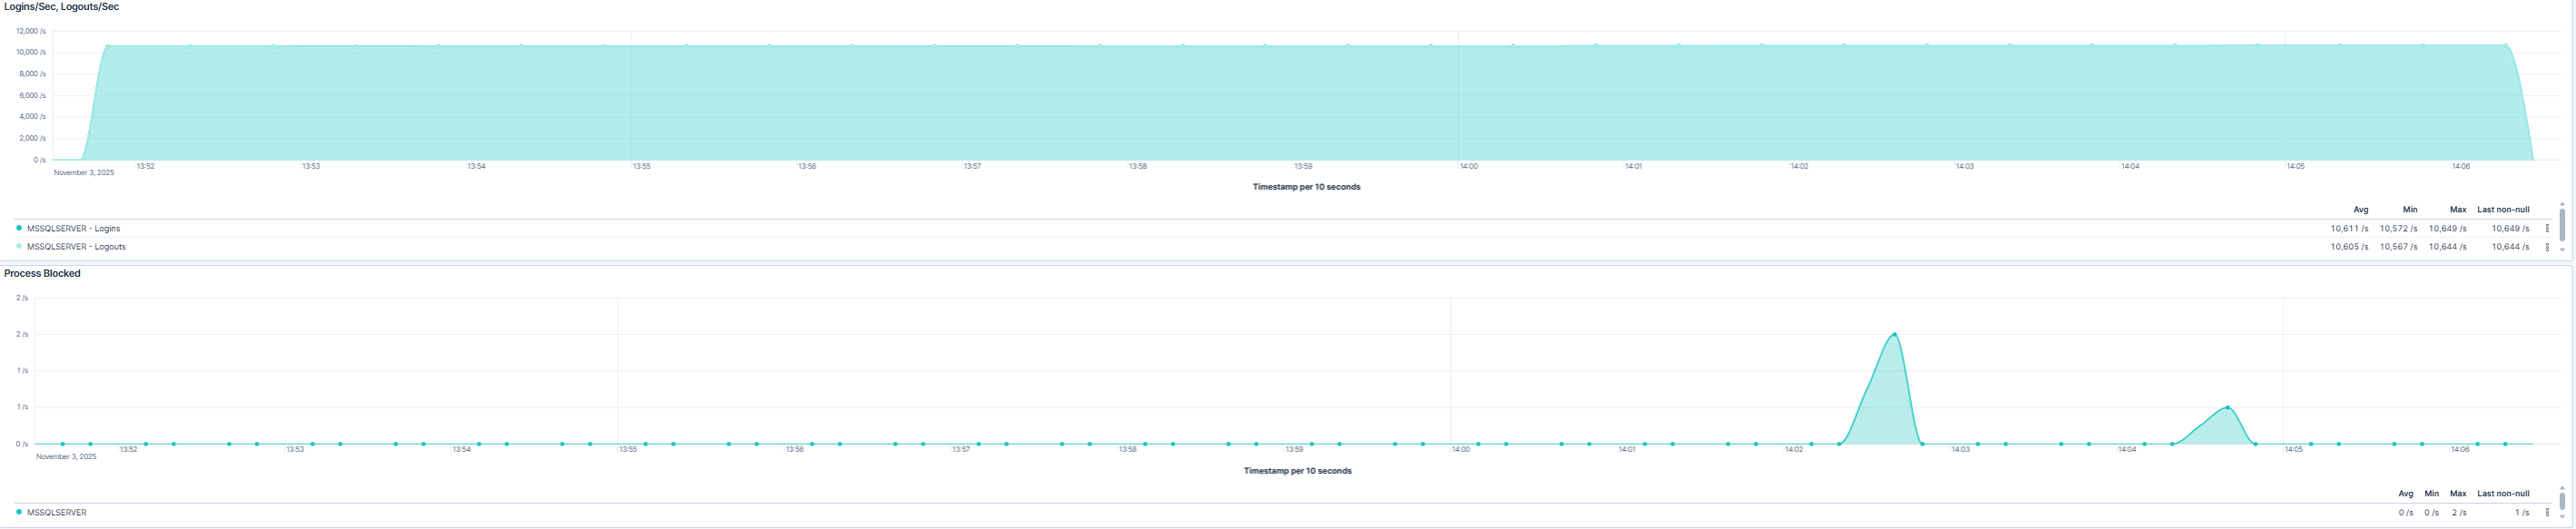
This dashboard provides insights into SQL Server user connections and database process health. It tracks logins and logouts per second to identify peak usage patterns and monitors blocked processes, which can signal contention or locking issues that affect performance.
Use Cases
| Use Case | Description |
|---|---|
| Identify query performance bottlenecks | Identify performance bottlenecks by monitoring SQL Server query execution and compilation trends. |
| Understand workload patterns | Understand workload patterns and peak usage through login and logout metrics. |
| Troubleshoot blocked processes | Troubleshoot blocked processes and resolve contention or locking issues. |
| Optimize execution plans | Optimize SQL Server execution plans by analyzing trends in batch requests and recompilation. |