


Feedback
SQL Server Overview
This dashboard provides real-time insights into SQL Server health, including CPU and memory utilization, deadlocks, disk utilization, and long-running queries. It helps monitor SQL Server status and performance across multiple hosts, ensuring visibility into database-level resource usage and stability.
SQL Overview
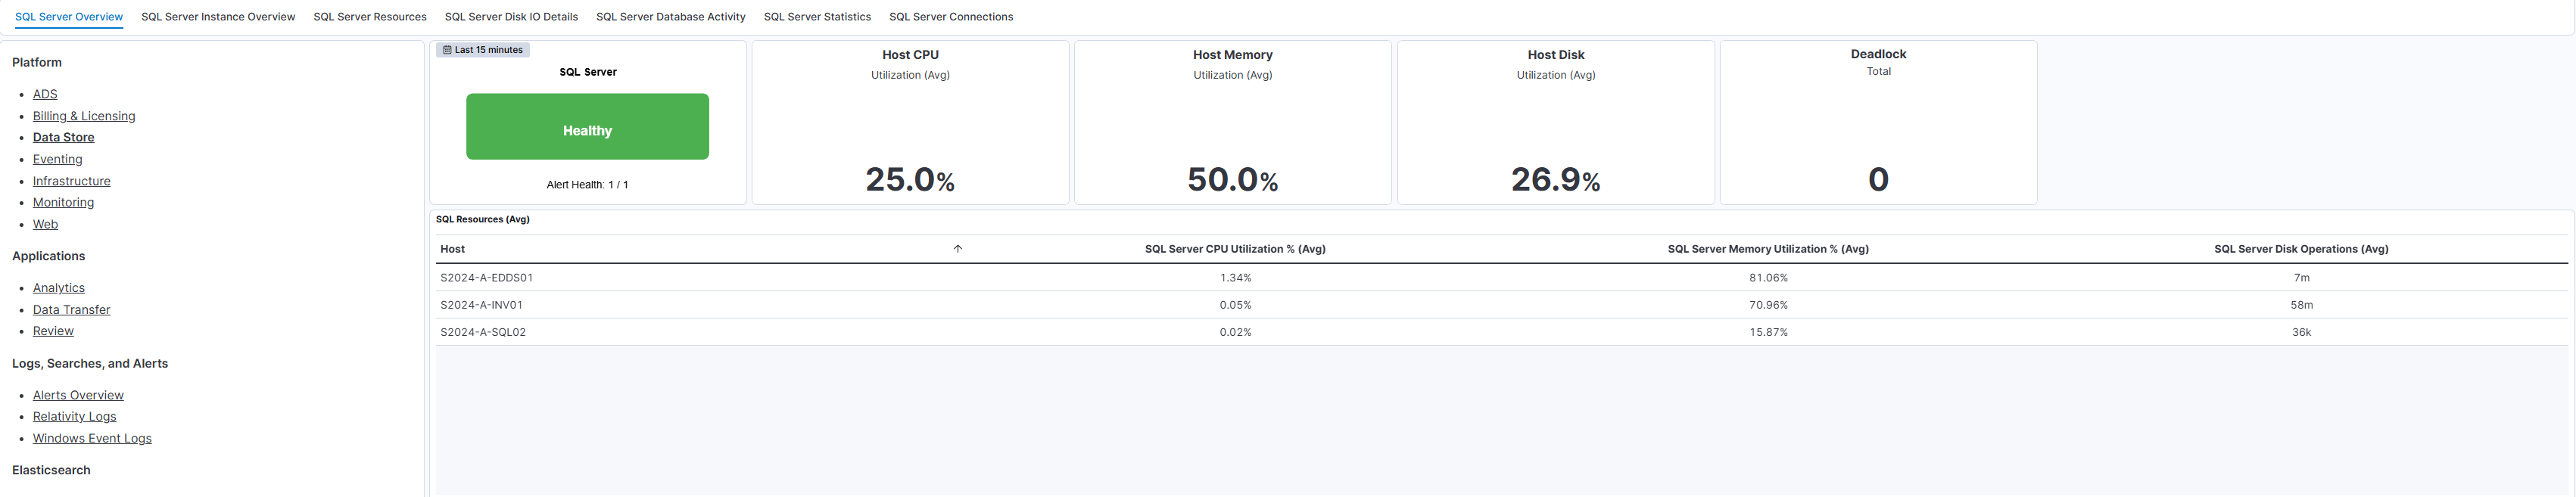
This dashboard provides a consolidated view of SQL Server health and resource utilization across hosts. It highlights overall server status, showing whether the environment is healthy, along with key performance indicators such as average host CPU usage,host memory utilization, and host disk utilization. Below the metric indicators, the dashboard lists individual hosts with their corresponding SQL Server CPU and memory utilization percentages and disk operation averages, enabling quick identification of resource-heavy instances. Use this dashboard to monitor infrastructure health, detect potential bottlenecks, and ensure optimal performance of SQL Server workloads.
SQL Instance Details
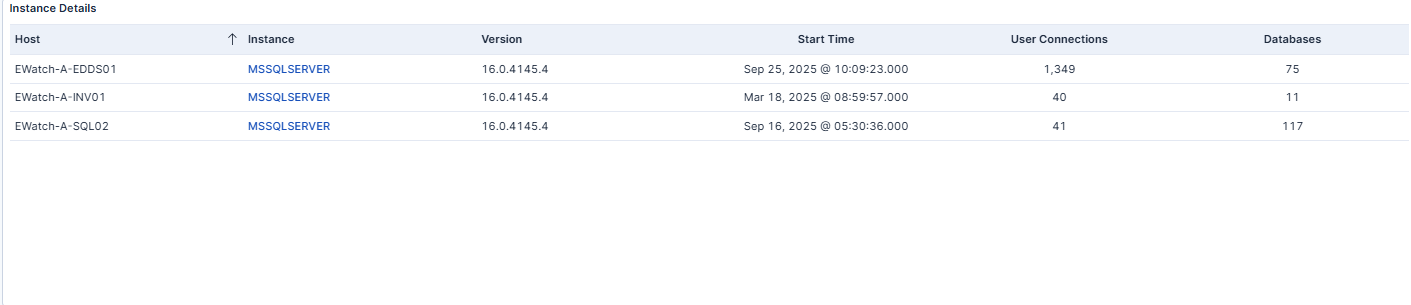
This panel lists active SQL Server instances, displaying host names, versions, uptime, active user connections, and database counts. Users can click an instance name in the table to drill down into detailed status information and key metrics for that instance. This feature provides quick navigation for deeper insights directly from the dashboard. Use this information to track environment inventory and monitor utilization across all servers.
Use Cases
| Use Case | Description |
|---|---|
| Identify SQL Server performance issues | Quickly identify SQL Server performance issues or anomalies. |
| Monitor resource utilization | Monitor key resource utilization (CPU, Memory, Disk) over time. |
| Track deadlocks and long-running queries | Track deadlocks and long-running queries affecting SQL Server performance. |
| Correlate SQL Server health with Relativity services | Correlate SQL Server health metrics with Relativity services for end-to-end visibility. |