


Feedback

This dashboard breaks imaging output down by imaging method and file type. Relativity images documents using two imaging methods:
The dashboard presents the two methods side by side. Each document is counted under the imaging method that was actually used to image it, so a single imaging job can contribute to both columns. For each method the dashboard summarizes how many documents and images were produced, how that work is distributed across file types, and how efficient imaging was per file type (images per document and time per page/document). It helps administrators understand which content types dominate imaging volume, which are the most expensive to image, and whether a particular method or file type is driving errors.
The following table maps the labels shown in this dashboard to the terminology used in the public Relativity imaging documentation:
| Dashboard label | Relativity documentation term | Meaning |
|---|---|---|
| Imaging Method | Imaging method (Basic or Native engine options) | The imaging engine that was actually used to image each document. |
| Native | Native imaging engine options | Images documents using the Worker Manager Server with an expanded range of settings. |
| Basic | Basic imaging engine options | Images documents using Oracle with a select number of settings. |
| File Type | File type | The document's file type as detected during imaging. |
The Imaging Native & Basic dashboard is available in Relativity Server 2026 and later and is the Native & Basic sub-tab of the Imaging suite. For availability requirements, prerequisites, dashboard navigation, and the shared time-range and KQL filter controls, see Imaging Overview. If the dashboard loads empty, the likeliest causes are that no imaging activity occurred in the selected time range, or telemetry is not reaching the Elastic/Kibana stack.
The dashboard is organized into two parallel columns so the two methods can be compared side by side:
Comparing the two columns. The columns are best compared at the totals level (documents, images, errors, and the efficiency averages). The per-file-type breakdowns may not line up row for row, because each column groups by a different file-type source: the Native column groups by the file type detected during imaging, while the Basic column groups by the document's Relativity native type. In day-to-day use both simply read as the document's file type (for example, PDF, DOCX, or JPEG), but the same document can appear under a differently named file type in each column.
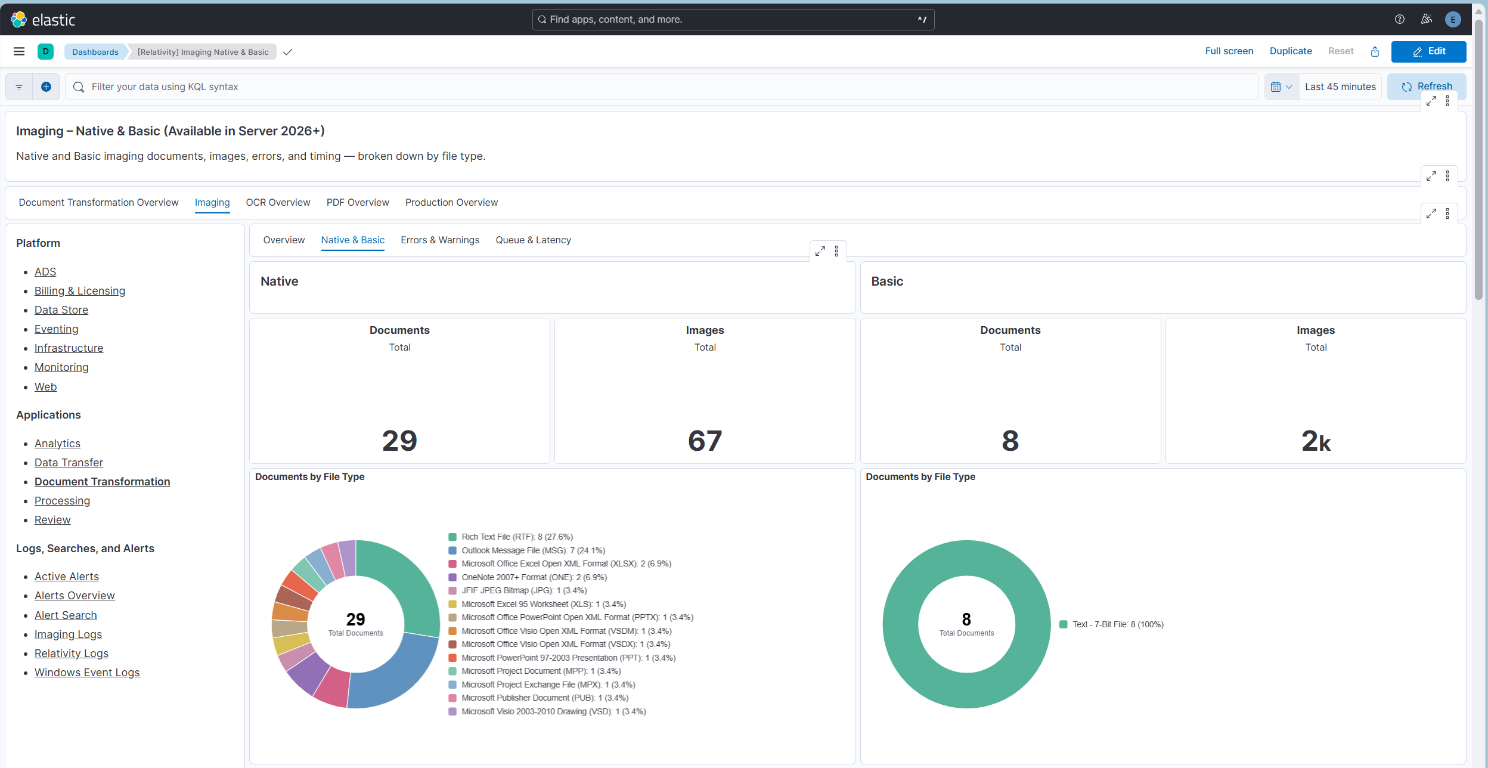
At the top of each column, two metric tiles summarize output for the selected range:
Comparing the Native and Basic tiles shows how imaging volume splits between the two methods. The two columns are independent: each document is counted only in the column for the method that actually imaged it, so the counts can differ or be close, depending on workload mix and imaging profile configuration.
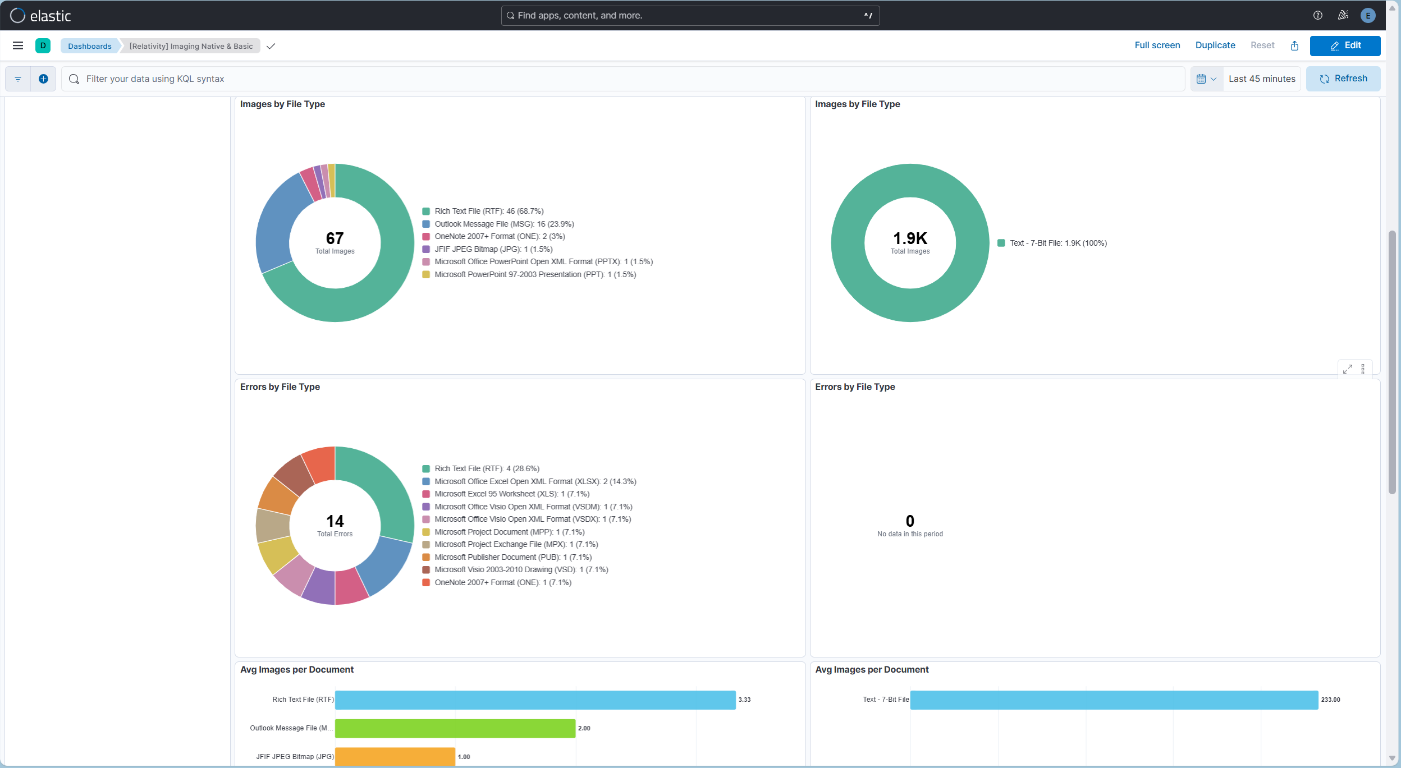
Beneath the tiles, three donuts per column show how that method's work is distributed across file types (the Documents by File Type donut appears with the summary tiles in the figure above; Images by File Type and Errors by File Type are shown here):
These distributions make it easy to see which file types dominate imaging volume and which are responsible for a disproportionate share of errors.
How to read it: Hover any slice for the exact count and percentage. Compare the Documents and Images donuts to spot file types that expand into many images, and watch the Errors by File Type donut for a file type whose error share is much larger than its document share - a sign that the content type is driving failures.
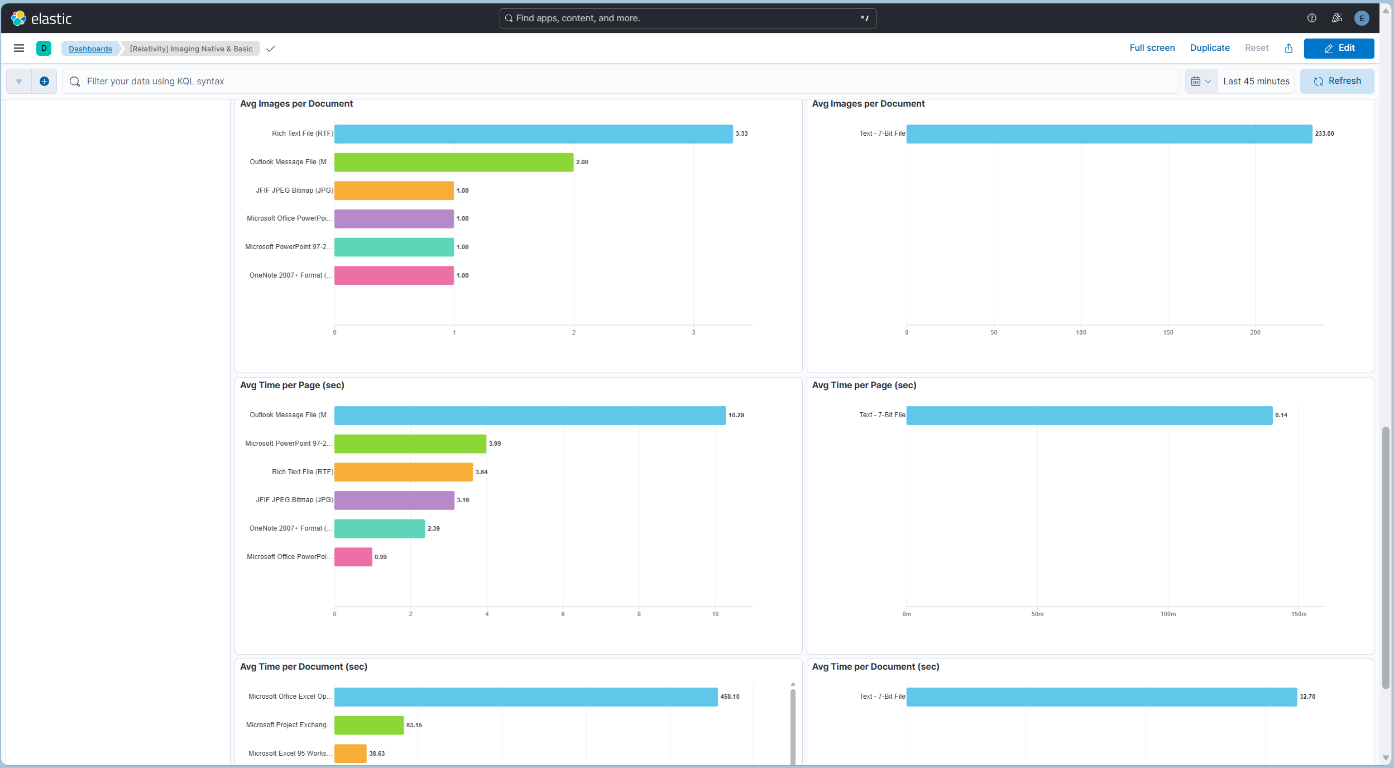
The bottom of each column presents three horizontal bar charts that measure imaging efficiency per file type:
Each chart shows the top 10 file types. The averages are weighted by volume - by document count for Avg Images per Document and Avg Time per Document, and by image count for Avg Time per Page - so a large job counts in proportion to its size rather than counting the same as a small one.
Together these charts help administrators identify which file types are the slowest or most image-heavy to process, informing profile tuning and capacity planning.
How to read it: Bars are ranked highest-value first and labeled with their value; the file types at the top of the Avg Time charts are your most expensive content to image. Cross-reference them with the Documents by File Type donut - a slow file type that also drives high volume is the best candidate for profile tuning or capacity planning.
| Use Case | Description |
|---|---|
| Compare Native vs Basic output | Use the Documents/Images tiles to see how imaging volume splits between the Native and Basic methods. |
| Identify high-volume file types | Use the Documents / Images by File Type donuts to find the content types that dominate imaging work. |
| Isolate error-prone file types | Use the Errors by File Type donuts to pinpoint file types responsible for a disproportionate share of imaging errors. |
| Find expensive content | Use the Avg Time per Page and Avg Time per Document bars to identify file types that are slowest to image. |
| Spot image-heavy content | Use the Avg Images per Document bar to find file types that expand into many images, which can affect storage and review load. |
| Tune imaging profiles | Combine the distribution and efficiency charts to inform profile and method choices for specific content types. |
No imaging-specific Environment Watch alerts are currently associated with this dashboard. This section will be updated as imaging alerts are published.
