


Feedback

This dashboard consolidates imaging failures and warnings so administrators and support engineers can investigate what went wrong, how often, and where. It covers three areas: document-level imaging errors (including the categories of error), agent-level errors and exceptions emitted by the imaging agents, and imaging warnings (such as cut-off text/images, table splits, malformed RTF, and encoding mismatches). Trend charts show how errors and warnings move over time, summary tables break them down by workspace and file type, and raw-data tables provide row-level detail with jump-links into Discover for deep investigation.
The Imaging Errors & Warnings dashboard is available in Relativity Server 2026 and later and is the Errors & Warnings sub-tab of the Imaging suite. Its imaging panels depend on imaging OpenTelemetry (OTEL) metrics, and its agent panels additionally depend on imaging agent logs flowing into the logs-* indices. For availability requirements, prerequisites, dashboard navigation, and the shared time-range and KQL filter controls, see Imaging Overview. If the dashboard loads empty, the likeliest causes are that no imaging activity occurred in the selected time range, or telemetry is not reaching the Elastic/Kibana stack.
This dashboard adds a native controls filter bar for error/warning investigation. Four option-list controls let you scope the imaging panels interactively:
Created, PickedUpByAgent, SubmittedToInvariant, and so on); for what each code means, see the Job Results Status column reference on the Imaging Overview dashboard. The same raw codes appear in the Job Status column of the Raw Error Data table below.The controls operate on imaging OTEL fields, which do not exist in the agent-log indices. The three agent panels (Agent Errors Over Time, Agent Exceptions by Type, Agent Error Logs) are intentionally configured to ignore these controls so they stay populated while you filter the imaging metric panels.
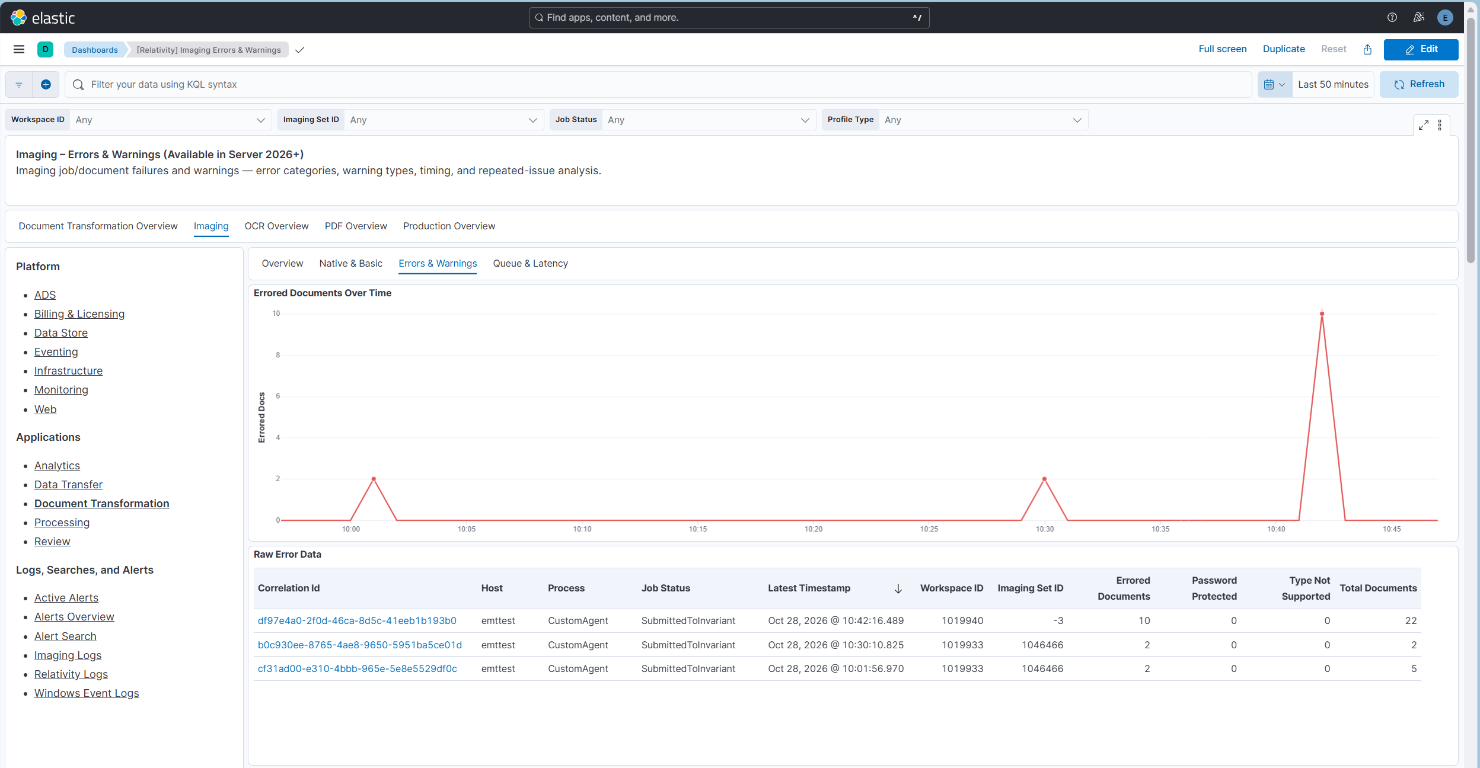
Toggle dependency: The Password Protected and Type Not Supported columns (and the related "Real vs Expected" split on Imaging Overview) depend on the detailed imaging error statistics toggle. The toggle is off by default. While it is off, the per-cause error breakdown is not collected, so both columns are always 0 and the Real vs Expected donut always shows 100% real errors. To enable the toggle, contact Relativity Support.
The Password Protected and Type Not Supported columns separate failures that usually need no action from genuine processing errors, which helps triage which errored documents are actionable. Both columns count only documents that were part of the imaging job and errored - they are tallied from the job's population table, so files that are excluded before they reach imaging are not counted:
How to read it: Start with Errored Documents Over Time to spot when errors spiked, then use Raw Error Data to find the specific jobs in that window and click a jump-link to investigate a single job in Discover.
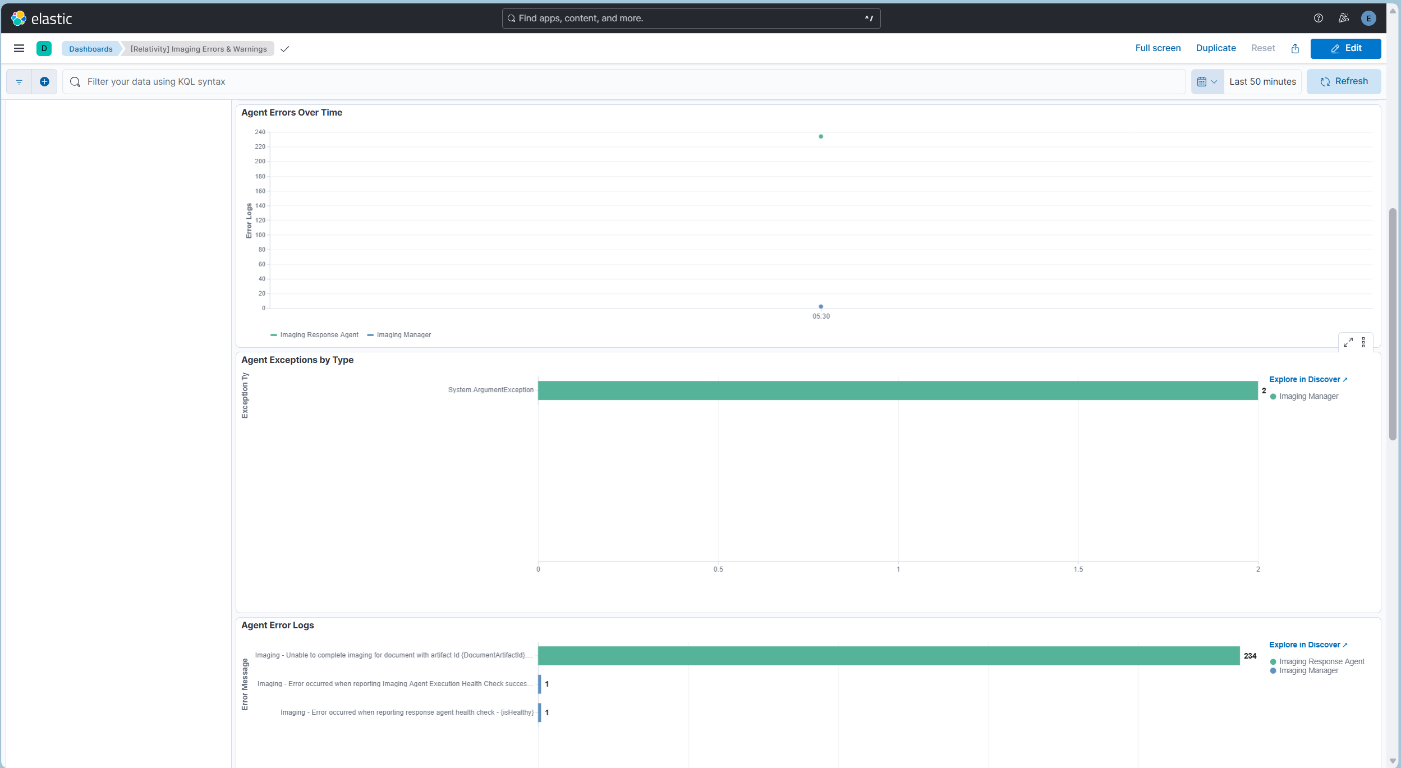
These three panels are sourced from the imaging agent error logs (agent logs filtered to the imaging agent application and an error or fatal log level) rather than from an imaging OTEL metric. They expose agent-side failures that are not tied to a specific document.
The per-agent breakdowns are grouped by agent. Imaging runs three agents:
The panels are:
Agent Exceptions by Type vs Agent Error Logs. Both panels summarize the same agent errors from different angles: Agent Exceptions by Type groups by the technical exception class, while Agent Error Logs groups by the readable log message. Read Agent Exceptions by Type to categorize failures, then Agent Error Logs to see the exact wording.
Explore in Discover: Agent Exceptions by Type and Agent Error Logs both open the underlying agent error logs in Discover, in a new browser tab, using the same time range as the dashboard:
The Discover view uses the logs-* data view with the columns needed for investigation (log level, agent name, exception type or message template, message, and stack trace), sorted newest first. The Discover hit count matches the count shown on the bar. Hover over a bar, total, or label to see its tooltip before you click.
Need the full log stream? These three panels show only error- and fatal-level agent logs. To read the complete imaging log stream for deeper investigation, open the [Relativity] Imaging Logs saved search in Discover, available from the Logs, Searches, and Alerts list in the Imaging dashboard navigation.
Screenshot note: The screenshot is illustrative; in some environments, high-volume entries can include telemetry or health-check reporting failures rather than document-imaging failures, so always confirm context in the raw log rows.
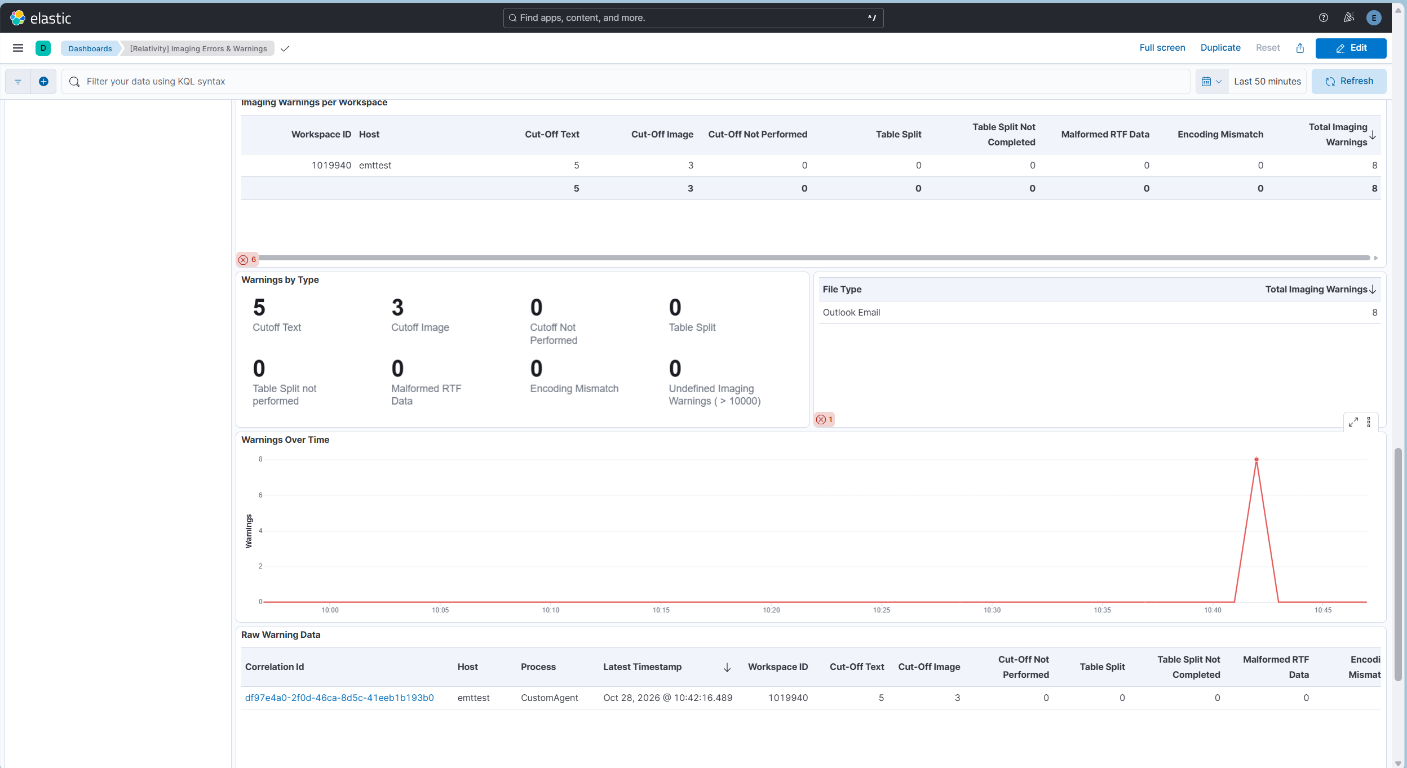
Imaging warnings capture non-fatal issues raised during imaging. All warning panels share the same seven warning types, which sum into Total Imaging Warnings:
The panels are:
How to read it: Use Warnings by Type and Warnings Over Time to see which warning categories dominate and whether they are rising, Imaging Warnings per Workspace and Warnings by File Type to localize them to specific workspaces or content types, and Raw Warning Data (with its jump-links) to inspect individual warning events.
| Use Case | Description |
|---|---|
| Investigate an error spike | Use Errored Documents Over Time to find when errors spiked, then drill into Raw Error Data for the specific jobs. |
| Separate real vs expected errors | Use the Password Protected and Type Not Supported columns in Raw Error Data to distinguish actionable failures from failures that usually need no action (password-protected files and unsupported file types). |
| Diagnose agent-side failures | Use Agent Errors Over Time, Agent Exceptions by Type, and Agent Error Logs to identify which imaging agents are failing and why, then click a bar or Explore in Discover to read the matching log entries and stack traces. |
| Find the noisiest workspaces | Use Imaging Warnings per Workspace to rank workspaces by warning volume. |
| Identify warning-prone content | Use Warnings by File Type to find content types that most often trigger warnings. |
| Track warning trends | Use Warnings Over Time and Warnings by Type to monitor whether warnings are rising and which categories dominate. |
| Deep-dive a specific job | Use the jump-links in Raw Error Data / Raw Warning Data to open a filtered Discover view scoped to a correlation ID, workspace, or imaging set. |
No imaging-specific Environment Watch alerts are currently associated with this dashboard. This section will be updated as imaging alerts are published.
