


Feedback
Windows Service Configuration
This section describes how to configure Windows service monitoring using the environmentWatchConfiguration JSON configuration file.
Overview
This configuration monitors the status of specified Windows services to ensure they are running as expected. Some Windows services are monitored by default depending on the installed products, even if they are not explicitly configured in the custom JSON configuration file.
The table below lists the service names that are monitored by default depending on the installed products.
Default Services
| Service Name | Description |
|---|---|
| apm-server | Elastic Stack APM Server |
| elasticsearch | Elastic Stack Elasticsearch Service |
| W3SVC | Internet Information Services (IIS) |
| QueueManager | Invariant Queue Manager |
| RabbitMQ | RabbitMQ Message Broker |
| kCura EDDS Agent Manager | Relativity Agent Manager |
| Relativity Analytics Engine | Relativity Analytics Engine (CAAT) |
| Relativity Secret Store | Relativity Secret Store |
| kCura Service Host Manager | Relativity Service Host Manager |
| kCura EDDS Web Processing Manager | Relativity Web Processing Manager |
Properties Table
The following table lists the properties used to configure Windows services monitoring in the custom JSON configuration file.
| Property | Type | Description |
|---|---|---|
enabled
|
boolean | Enables or disables monitoring for Windows services. |
include
|
array | List of Windows service names (not display names) to monitor (for example, "WinDefend"). |
To identify the correct service name:
- Navigate to the Services application on the host.
- Right-click the desired service and select Properties.
- Copy the Service name value (not the display name).
Configure Windows Services
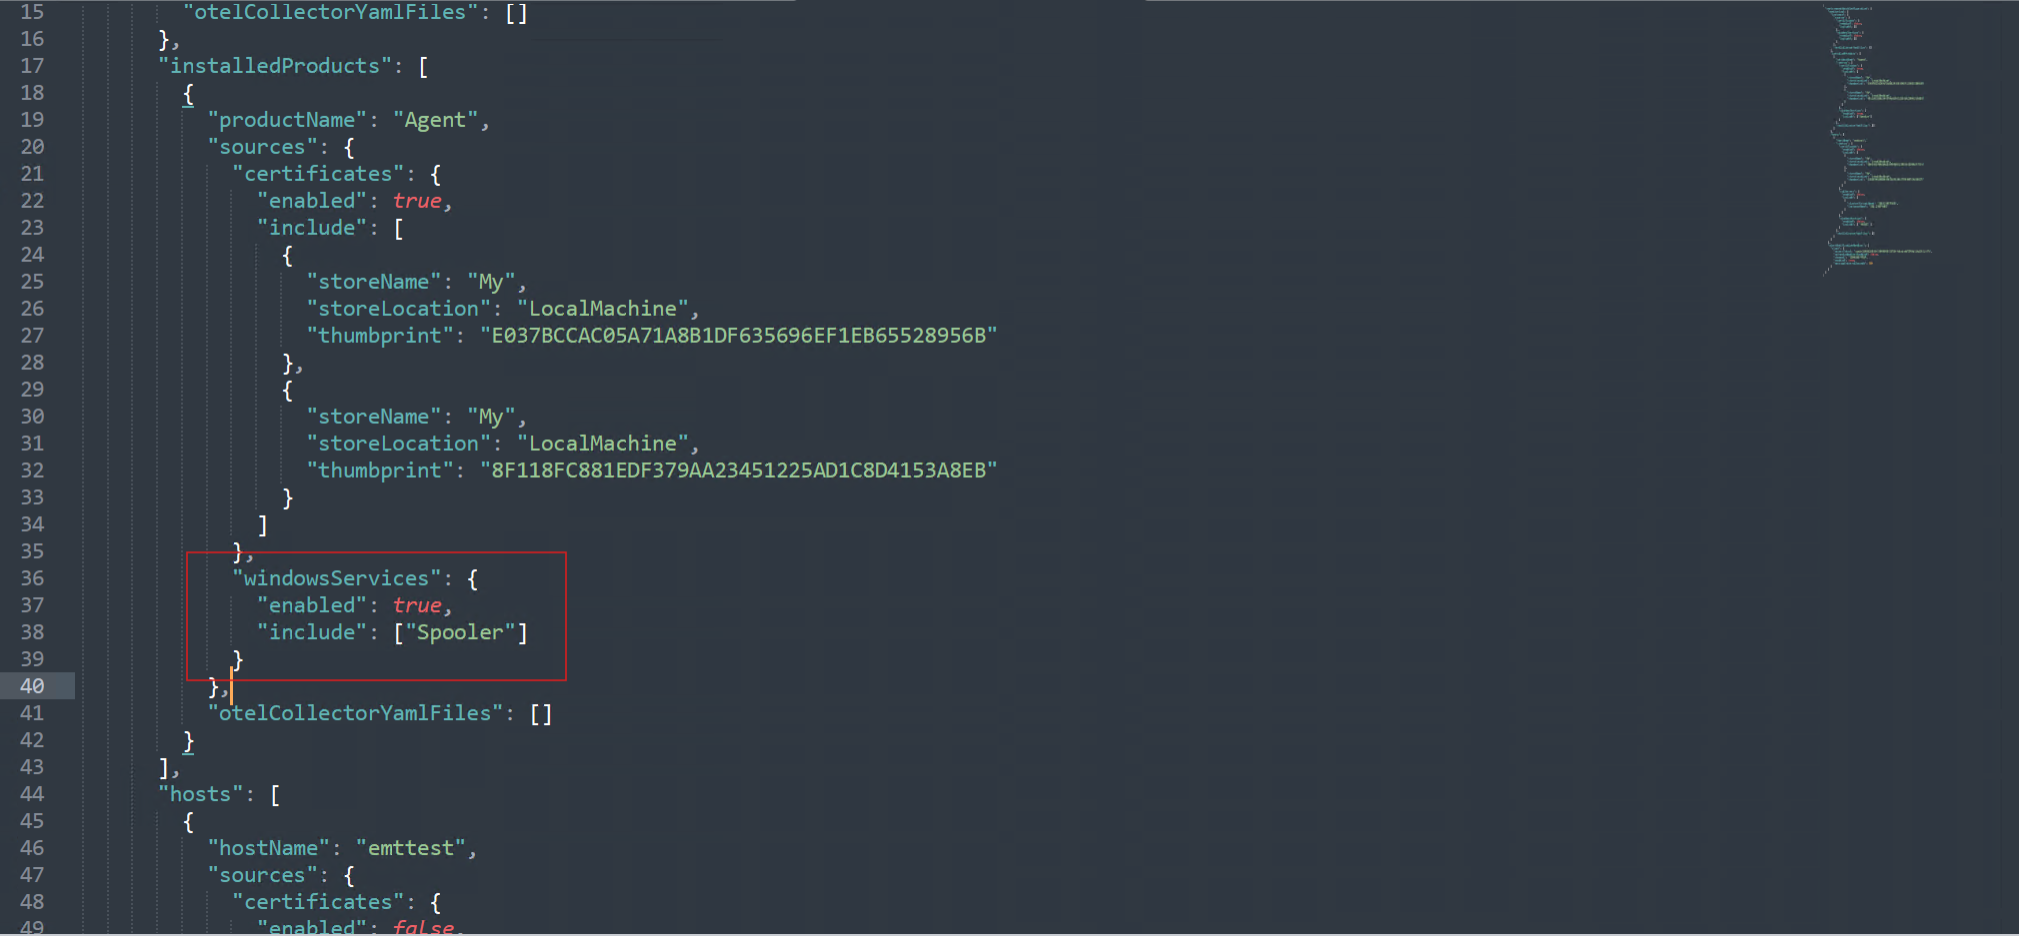
Windows services can be monitored at the "hosts", "instance", or "installedProducts" level. For services to monitor, locate "windowsServices" under the desired section and update the configuration as shown below.
enabled: Set totrueto enable Windows services monitoring.include: List the service names to monitor.
Example
Copy
{
  "environmentWatchConfiguration": {
    "monitoring": {
      "instance": {
        "sources": {
          "certificates": {},
          "windowsServices": {
            "enabled": false,
            "include": []
          }
        },
        "otelCollectorYamlFiles": []
      },
      "installedProducts": [
        {
          "productName": "Agent",
          "sources": {
            "certificates": {
              "enabled": true,
              "include": []
            },
            "windowsServices": {
              "enabled": true,
              "include": [
                "Spooler"
              ]
            }
          },
          "otelCollectorYamlFiles": []
        }
      ],
      "hosts": [
        {
          "hostName": "emttest",
          "sources": {
            "certificates": {
              "enabled": false,
              "include": []
            },
            "sqlServers": {
              "enabled": false,
              "include": []
            },
            "windowsServices": {
              "enabled": true,
              "include": [
                "W3SVC"
              ]
            }
          },
          "otelCollectorYamlFiles": []
        }
      ]
    },
    "alertNotificationHandlers": {}
  }
}
If the Windows service specified in the custom JSON configuration file cannot be found on the host, an alert will be triggered indicating that the service is stopped or missing. For troubleshooting guidance, refer Troubleshooting section.
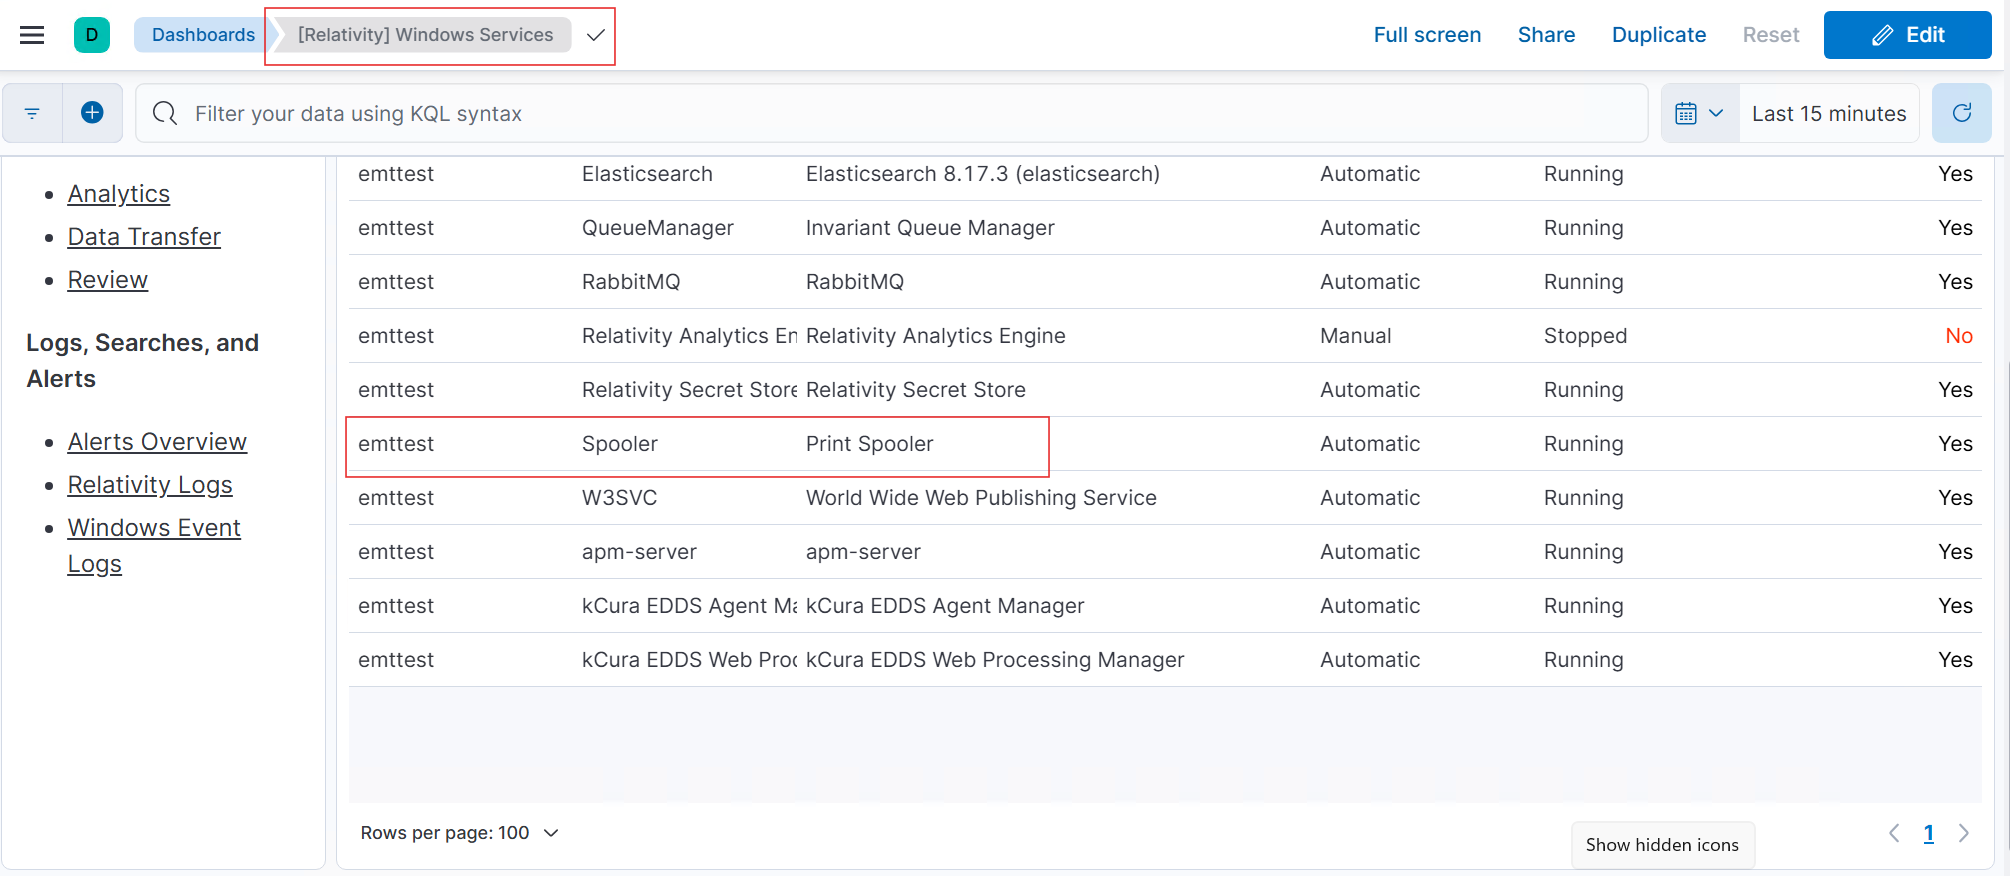
Verification in Kibana
- Navigate to Kibana Dashboard.
- Ensure that the Windows services defined in the custom JSON configuration file appear on the Kibana Windows services dashboard. The example below demonstrates how a Windows service specified in the custom JSON configuration file is successfully monitored and displayed on the Windows services dashboard.
Troubleshooting
Refer to the Troubleshooting Guide to resolve any custom JSON windows services configuration issues.