


Feedback
Custom JSON Configuration Troubleshooting
This document provides guidance for troubleshooting issues related to custom JSON configuration file in Relativity Server environments.
Prerequisites
- Install the latest Server Bundle to ensure support for custom JSON configuration. The most recent release can be downloaded from the Server Bundle releases page.
Common Issues
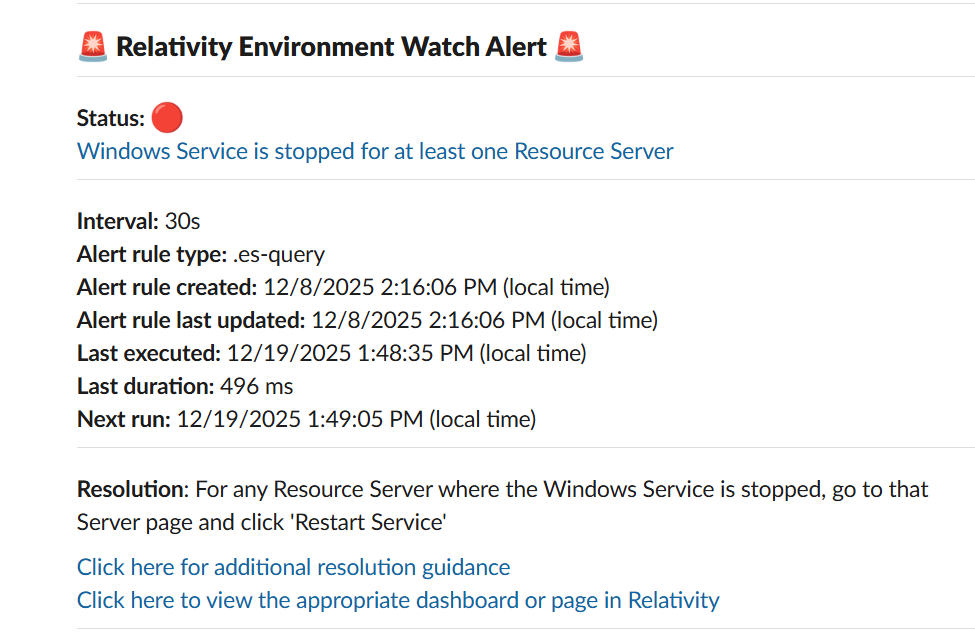
If the log message "The Environment Watch shared configuration object is not empty" does not appear in Kibana, review the following potential causes:
Copy
"The Environment Watch shared configuration object is not empty"
![]()
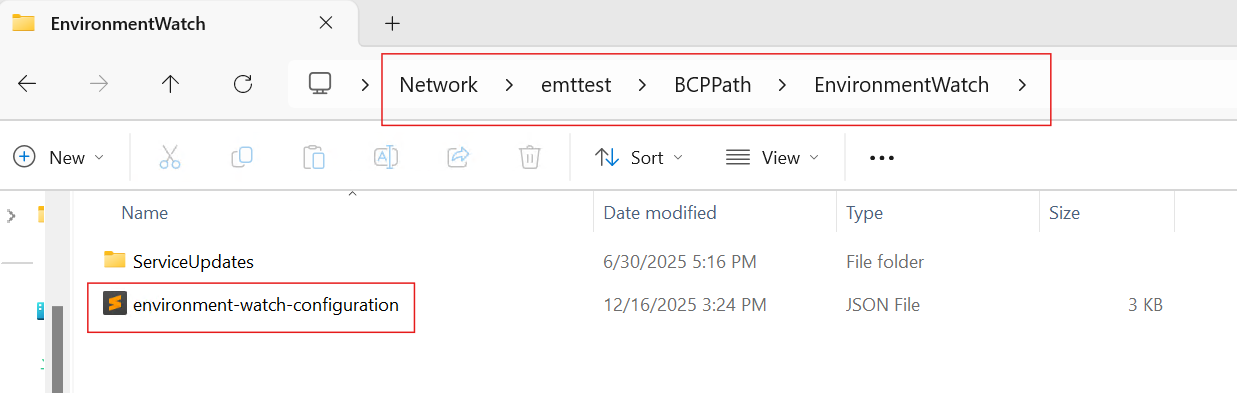
The custom JSON configuration file is not placed in the correct BCP path.
Verify that the custom JSON configuration file is located in the correct BCP path.
Base path: BCPPath
Folder: EnvironmentWatch
File name: environment-watch-configuration.json
Environment Watch automatically reads this file and applies the defined monitoring rules to the relevant instances, products, and hosts.
To identify the BCP path for the environment, navigate to the "Server" tab in the Relativity front end as below:
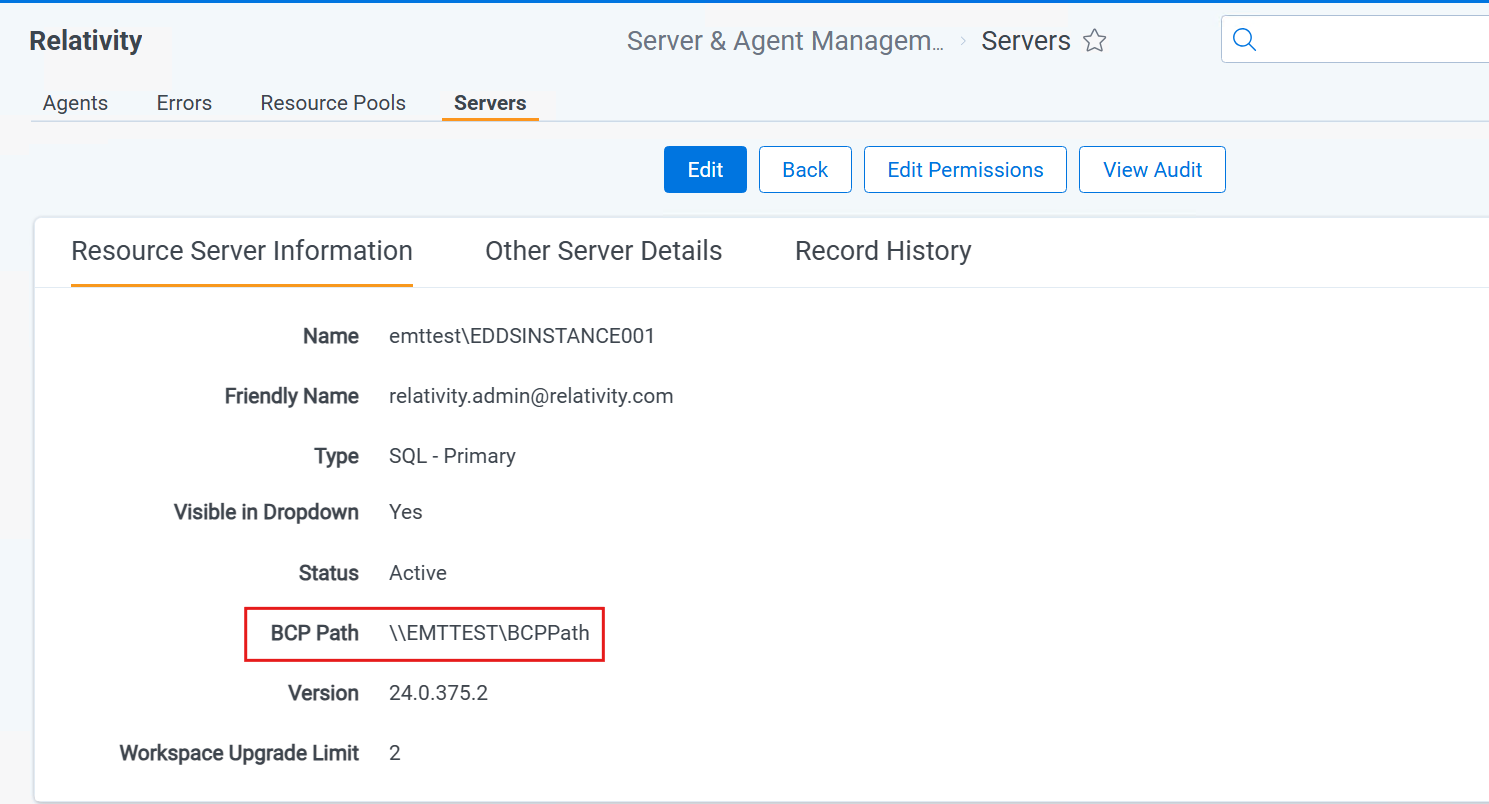
Complete path to the custom JSON configuration file will be:
Copy
\\EMTTEST\BCPPath\EnvironmentWatch\environment-watch-configuration.json
An example of the BCPPath and folder structure is shown below:
EW supports all BCP share configuration options available in Relativity. Primary SQL is just one of several supported configurations.
Activate the BCP path if it is not active.
- Log in to the Relativity application.
- Navigate to Servers.
- Filter by
SQL - Primaryin the Type column.
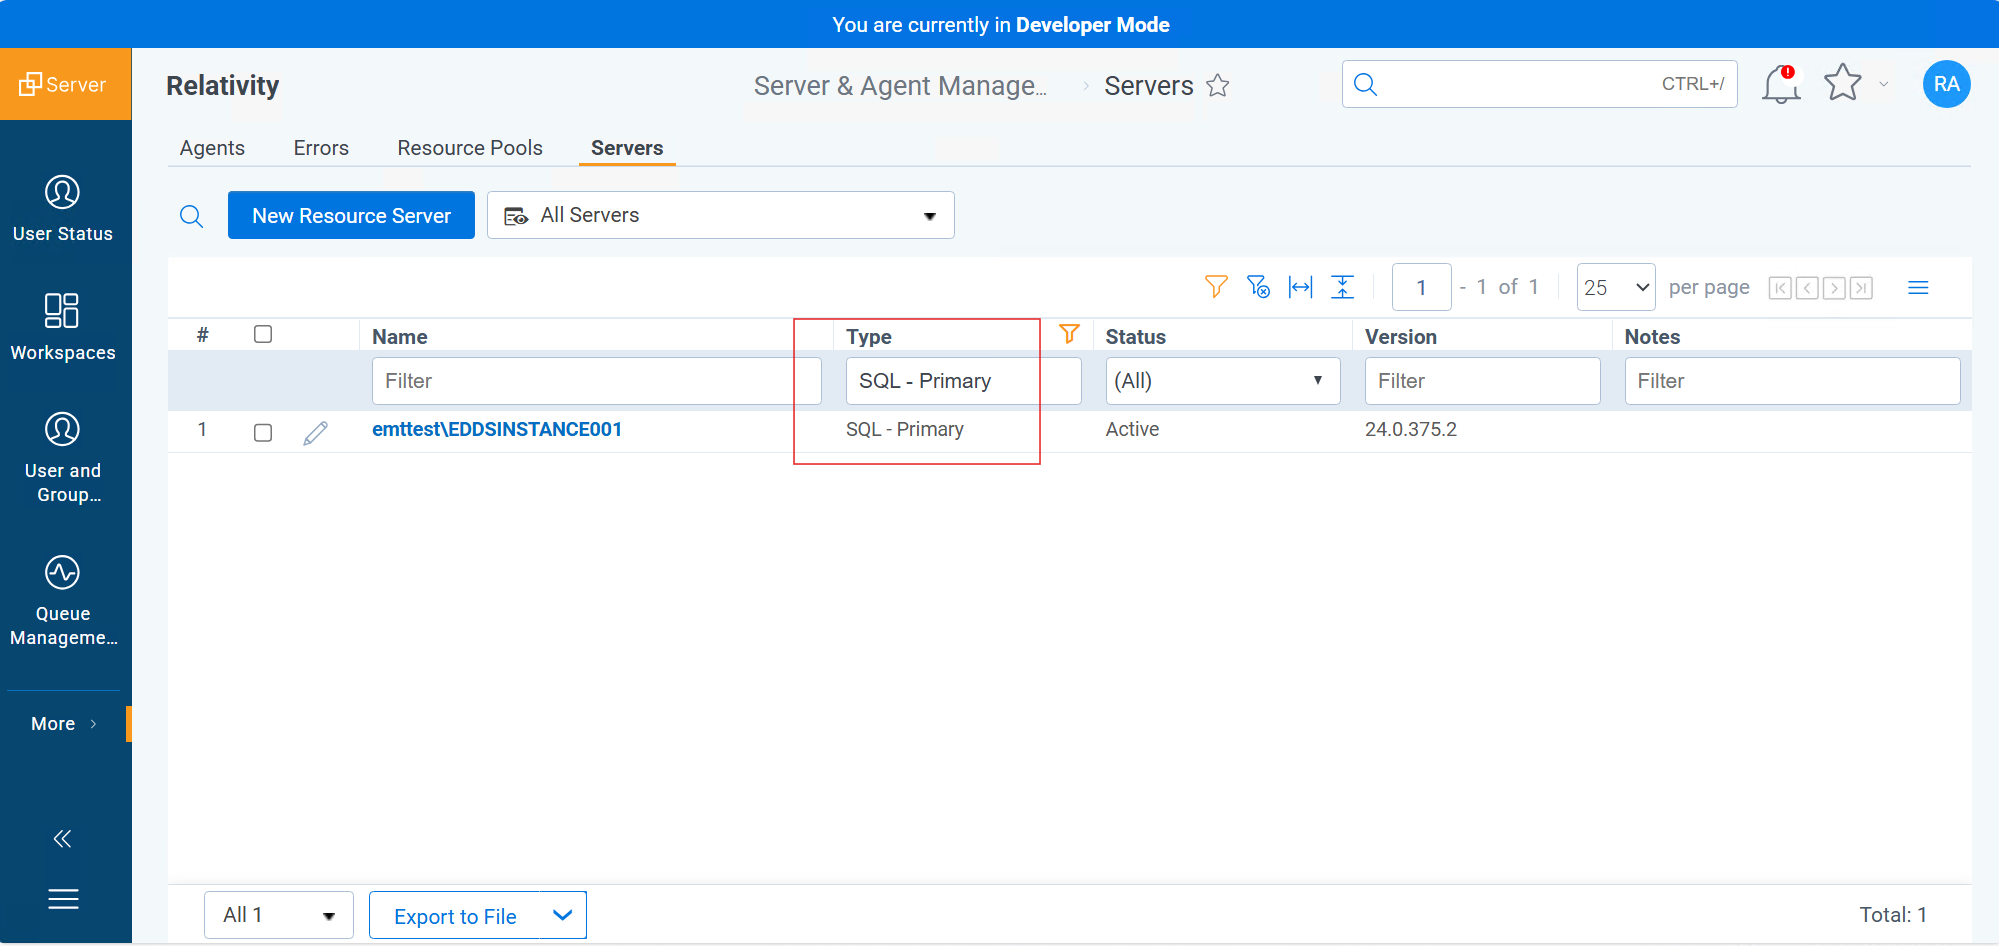
- Ensure the BCP path is active and Visible in Dropdown is set to 'Yes'.
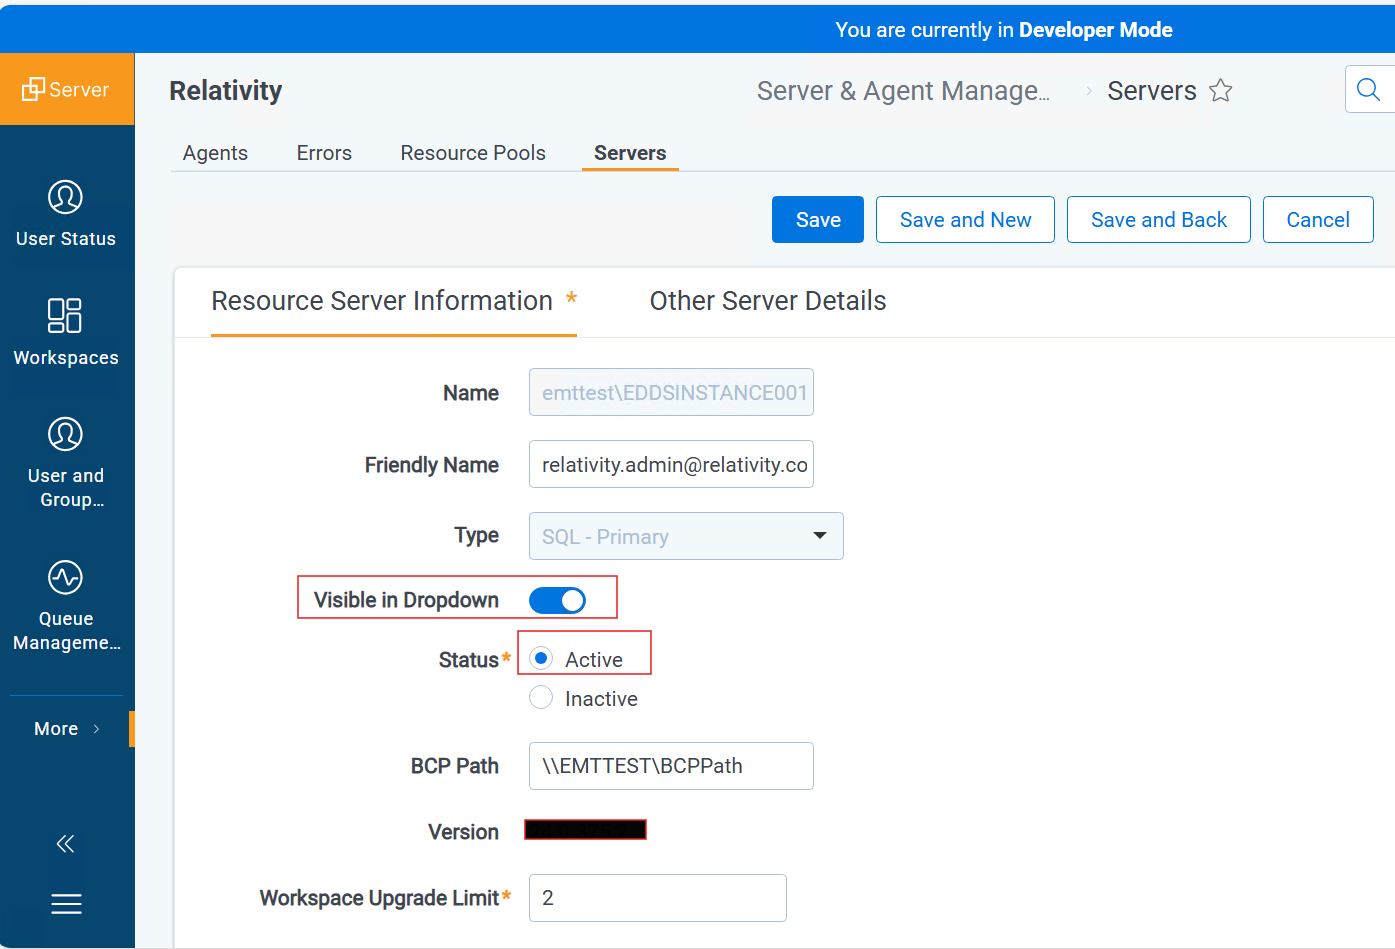
- Click on 'Edit' and toggle the Status to 'Inactive' and save it.
- Again, click on 'Edit' and toggle the Status to 'Active' and save it.
- Restart the Environment Watch Windows Service to apply the changes.
Check the custom JSON configuration file for syntax errors.
- Download the sample JSON file from the link below and compare it with your custom JSON configuration file to identify any syntax errors.
Sample Custom JSON Configuration File
- Restart the Environment Watch Windows Service to apply the changes.
Update the Environment Watch Windows Service to the latest version.
- Verify the installed version of the Environment Watch Windows Service.
- Ensure the service is updated to latest version, as custom JSON configuration file support was introduced in latest version.
- If the service is running an earlier version, review the Prerequisites section to confirm you're on the latest Server Bundle, then upgrade the Environment Watch Windows Service to the latest available version.
Ensure the enabled flag is set to true in the custom JSON configuration file for the relevant monitoring section (hosts, instance, or installedProducts).
Before proceeding with the troubleshooting steps in later sections, review and fix the common issues outlined above to ensure the Environment Watch Windows Service correctly picks up the custom JSON configuration file changes.
Certificates
If certificates do not appear in the Kibana dashboard after configuring the custom JSON configuration file, fix the common issues outlined in Common Issues before reviewing the following potential causes:
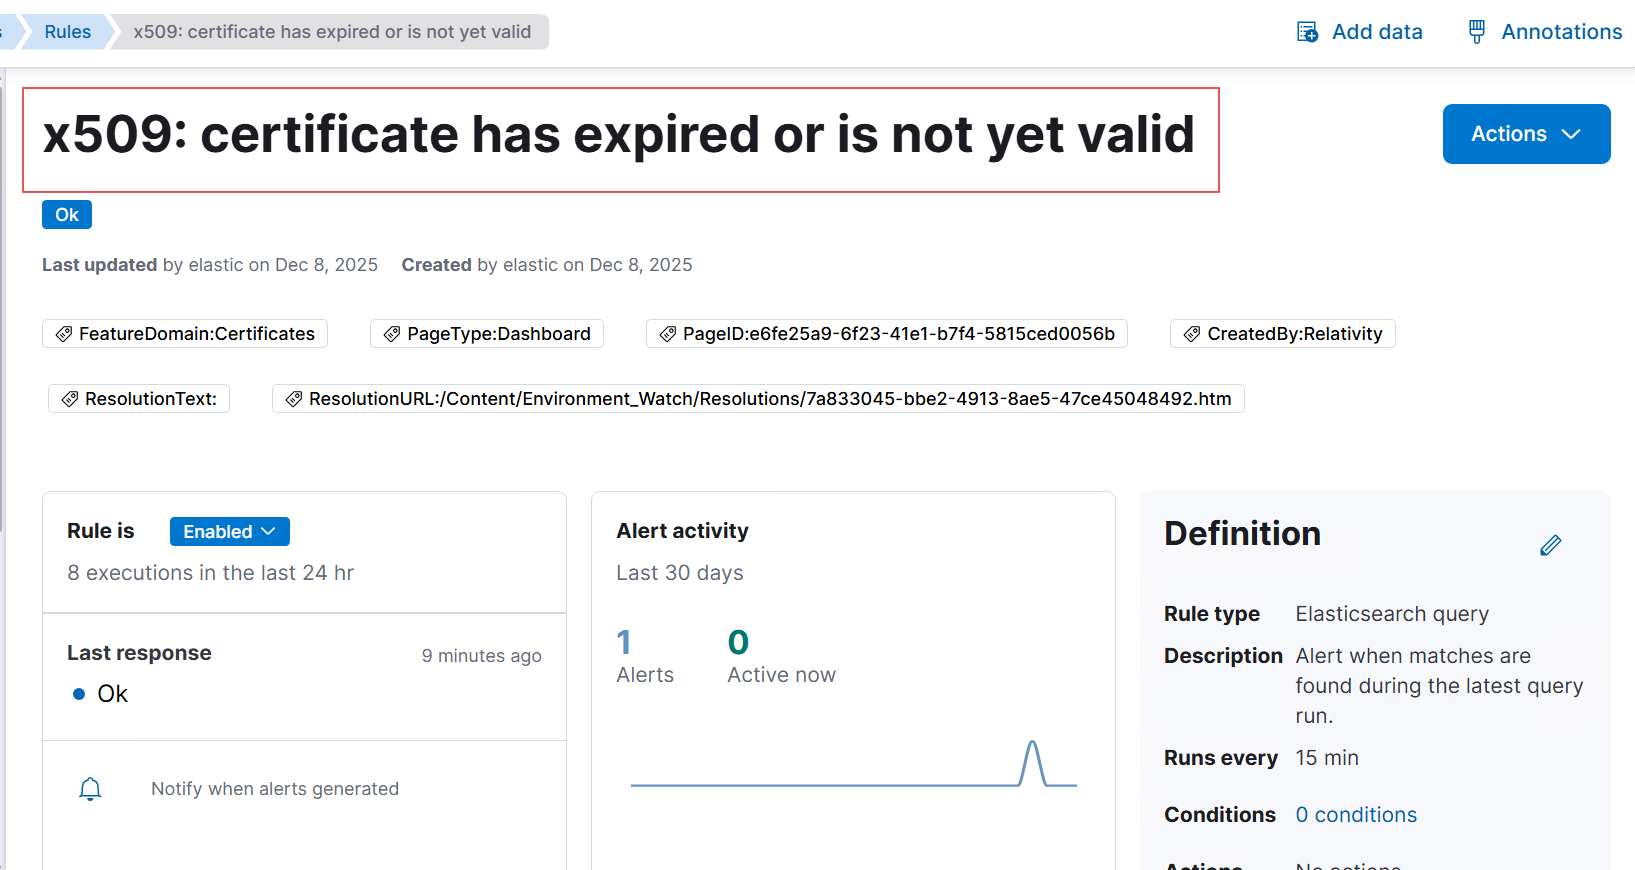
After fixing the common issues, If a certificate alert is triggered in Kibana, review the following potential causes:
Certificate is misconfigured.
Run the following PowerShell command based on the certificate store location and name. For LocalMachine and My, use:
Copy
Get-ChildItem Cert:\LocalMachine\My
Certificate configured correctly, but the certificate is expired.
- Verify whether the certificate is expired from the certificate dashboard.
- If it is expired, replace it with a valid certificate. For
LocalMachineandMy, use:
Copy
Get-ChildItem Cert:\LocalMachine\My
Ensure the host name is correct for monitoring by Host or Installed Product.
- Run the following PowerShell command:
Copy
hostname
- Ensure the
hostNameproperty in your configuration matches the output. Example:
Copy
{
  "environmentWatchConfiguration": {
    "monitoring": {
      "instance": {
        "sources": {
          "certificates": {},
          "windowsServices": {
            "enabled": false,
            "include": []
          }
        },
        "otelCollectorYamlFiles": []
      },
      "installedProducts": [
        {
          "productName": "Agent",
          "sources": {
            "certificates": {
              "enabled": true,
              "include": []
            },
            "windowsServices": {
              "enabled": true,
              "include": []
            }
          },
          "otelCollectorYamlFiles": []
        }
      ],
      "hosts": [
        {
          "hostName": "SQL01",
          "sources": {
            "certificates": {
              "enabled": true,
              "include": []
            },
            "sqlServers": {
              "enabled": true,
              "include": [
                {
                  "clusterVirtualName": "SQLCLUSTER",
                  "instanceName": "SQL_INSTANCE"
                }
              ]
            },
            "windowsServices": {
              "enabled": true,
              "include": []
            }
          },
          "otelCollectorYamlFiles": []
        }
      ]
    },
    "alertNotificationHandlers": {}
  }
}
Avoid configuring certificate thumbprints in Monitoring by instance.
Example configuration for instance monitoring:
Copy
{
  "environmentWatchConfiguration": {
    "monitoring": {
      "instance": {
        "sources": {
          "certificates": {
            "enabled": false,
            "include": []
          },
          "windowsServices": {
            "enabled": true,
            "include": [
              "WindowsAzureGuestAgent",
              "mpssvc"
            ]
          }
        }
      },
      "installedProducts": [
        {
          "productName": "Agent",
          "sources": {
            "certificates": {
              "enabled": false,
              "include": []
            },
            "windowsServices": {
              "enabled": false,
              "include": []
            }
          },
          "otelCollectorYamlFiles": []
        }
      ],
      "hosts": [
        {
          "hostName": "SQL01",
          "sources": {
            "certificates": {
              "enabled": false,
              "include": []
            },
            "sqlServers": {
              "enabled": false,
              "include": []
            },
            "windowsServices": {
              "enabled": false,
              "include": []
            }
          },
          "otelCollectorYamlFiles": []
        }
      ]
    },
    "alertNotificationHandlers": {}
  }
}
Windows Services
If Windows services do not appear in the Kibana dashboard after configuring the custom JSON configuration file, fix the common issues outlined in Common Issues before reviewing the following potential causes:
After fixing the common issues, if Windows services still do not appear in the Kibana dashboard, review the following potential causes:
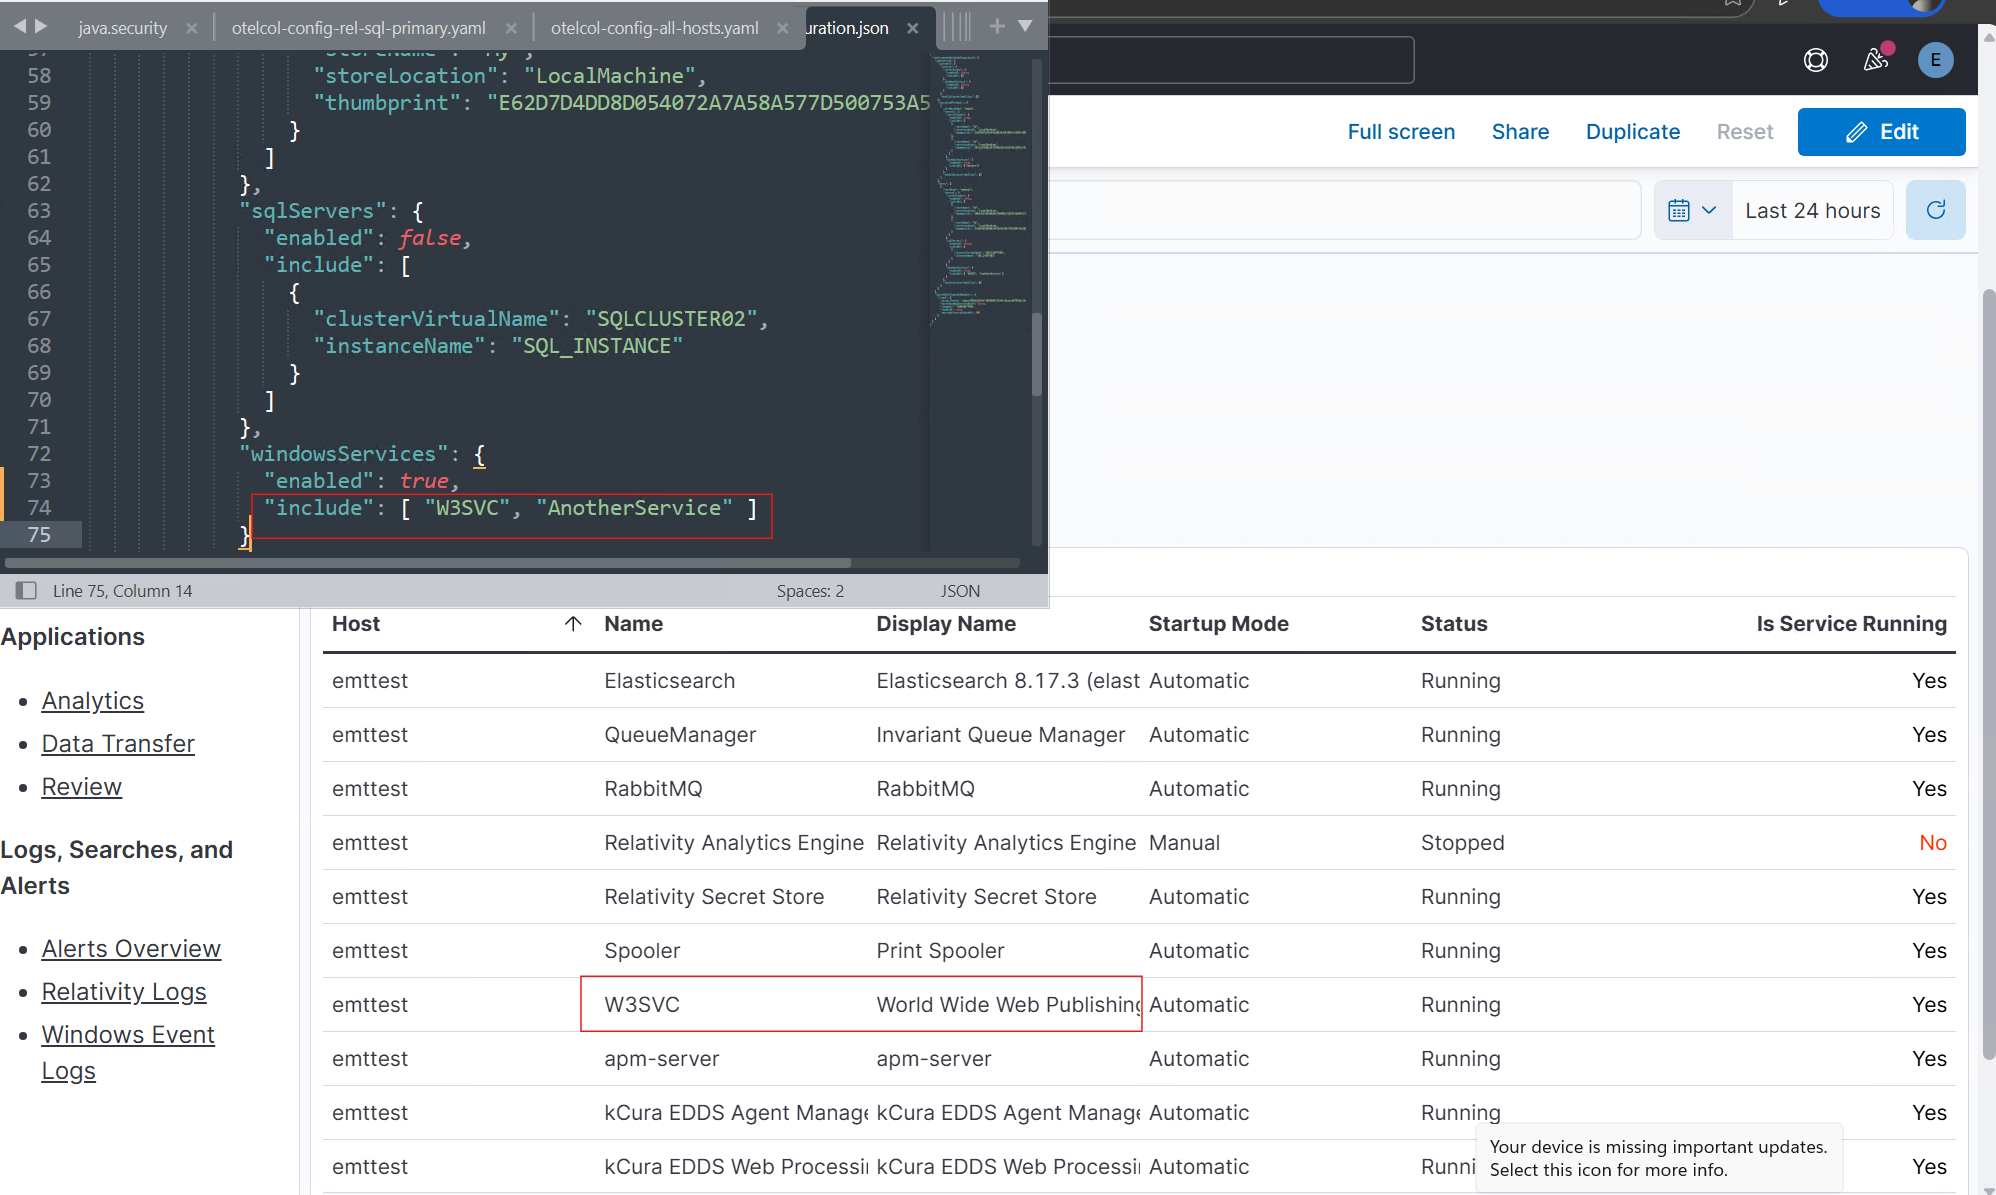
Verify the Windows services in the custom JSON configuration file.
- Ensure the custom JSON configuration file contains the correct configuration for the Windows services to monitor.
- Place the configuration under the
windowsServicessection for the relevanthosts,instance, orinstalledProductsentry.
Example:
Copy
{
  "environmentWatchConfiguration": {
    "monitoring": {
      "instance": {
        "sources": {
          "certificates": {
            "enabled": false,
            "include": []
          },
          "windowsServices": {
            "enabled": true,
            "include": [
              "WindowsAzureGuestAgent",
              "mpssvc"
            ]
          }
        }
      },
      "installedProducts": [
        {
          "productName": "Agent",
          "sources": {
            "certificates": {
              "enabled": false,
              "include": []
            },
            "windowsServices": {
              "enabled": true,
              "include": []
            }
          },
          "otelCollectorYamlFiles": []
        }
      ],
      "hosts": [
        {
          "hostName": "SQL01",
          "sources": {
            "certificates": {
              "enabled": false,
              "include": []
            },
            "sqlServers": {
              "enabled": false,
              "include": []
            },
            "windowsServices": {
              "enabled": true,
              "include": ["MSSQLSERVER", "AnotherService"]
            }
          },
          "otelCollectorYamlFiles": []
        }
      ]
    },
    "alertNotificationHandlers": {}
  }
}
Verify the Windows services are running and exist on the host.
- Verify the Windows services to be monitored are running and exist on the host machine.
- Use the Services management console (
services.msc) or the following PowerShell command:
Copy
Get-Service -Name MSSQLSERVER, AnotherService
Always include the Windows service name in the custom JSON configuration file.
- Ensure that the correct service names (not display names) are used in the
includesection of the custom JSON configuration file.
SQL Server Instances
When monitoring SQL server instances using the custom JSON configuration file, ensure the following:
- All nodes of the SQL environment are properly configured.
- Update the correct SQL server virtual name and instance name.
- The Environment Watch Windows service picks up the configuration changes.
- The following log message appears in Kibana to confirm that SQL server instance details are picked up from the custom JSON configuration file:
Ensure all instances/nodes of the SQL environment are monitored.
- Include each node of the SQL server in the
hostssection of the custom JSON configuration file with the correcthostName,clusterVirtualName, andinstanceName. - Set
sqlServers->enabledtotruefor each host entry.
Copy
{
  "environmentWatchConfiguration": {
    "monitoring": {
      "instance": {
        "sources": {
          "certificates": {},
          "windowsServices": {}
        },
        "otelCollectorYamlFiles": []
      },
      "installedProducts": [
        {
          "productName": "Agent",
          "sources": {
            "certificates": {},
            "windowsServices": {}
          },
          "otelCollectorYamlFiles": []
        }
      ],
      "hosts": [
        {
          "hostName": "SQLNode1",
          "sources": {
            "certificates": {},
            "sqlServers": {
              "enabled": true,
              "include": [
                {
                  "clusterVirtualName": "SQLCLUSTER",
                  "instanceName": "SQL_INSTANCE"
                }
              ]
            },
            "windowsServices": {}
          },
          "otelCollectorYamlFiles": []
        },
        {
          "hostName": "SQLNode2",
          "sources": {
            "certificates": {},
            "sqlServers": {
              "enabled": true,
              "include": [
                {
                  "clusterVirtualName": "SQLCLUSTER",
                  "instanceName": "SQL_INSTANCE"
                }
              ]
            },
            "windowsServices": {}
          },
          "otelCollectorYamlFiles": []
        }
      ]
    },
    "alertNotificationHandlers": {}
  }
}
Always specify SQL server configuration within the "hosts" section of the custom JSON configuration file.
Slack Notifications
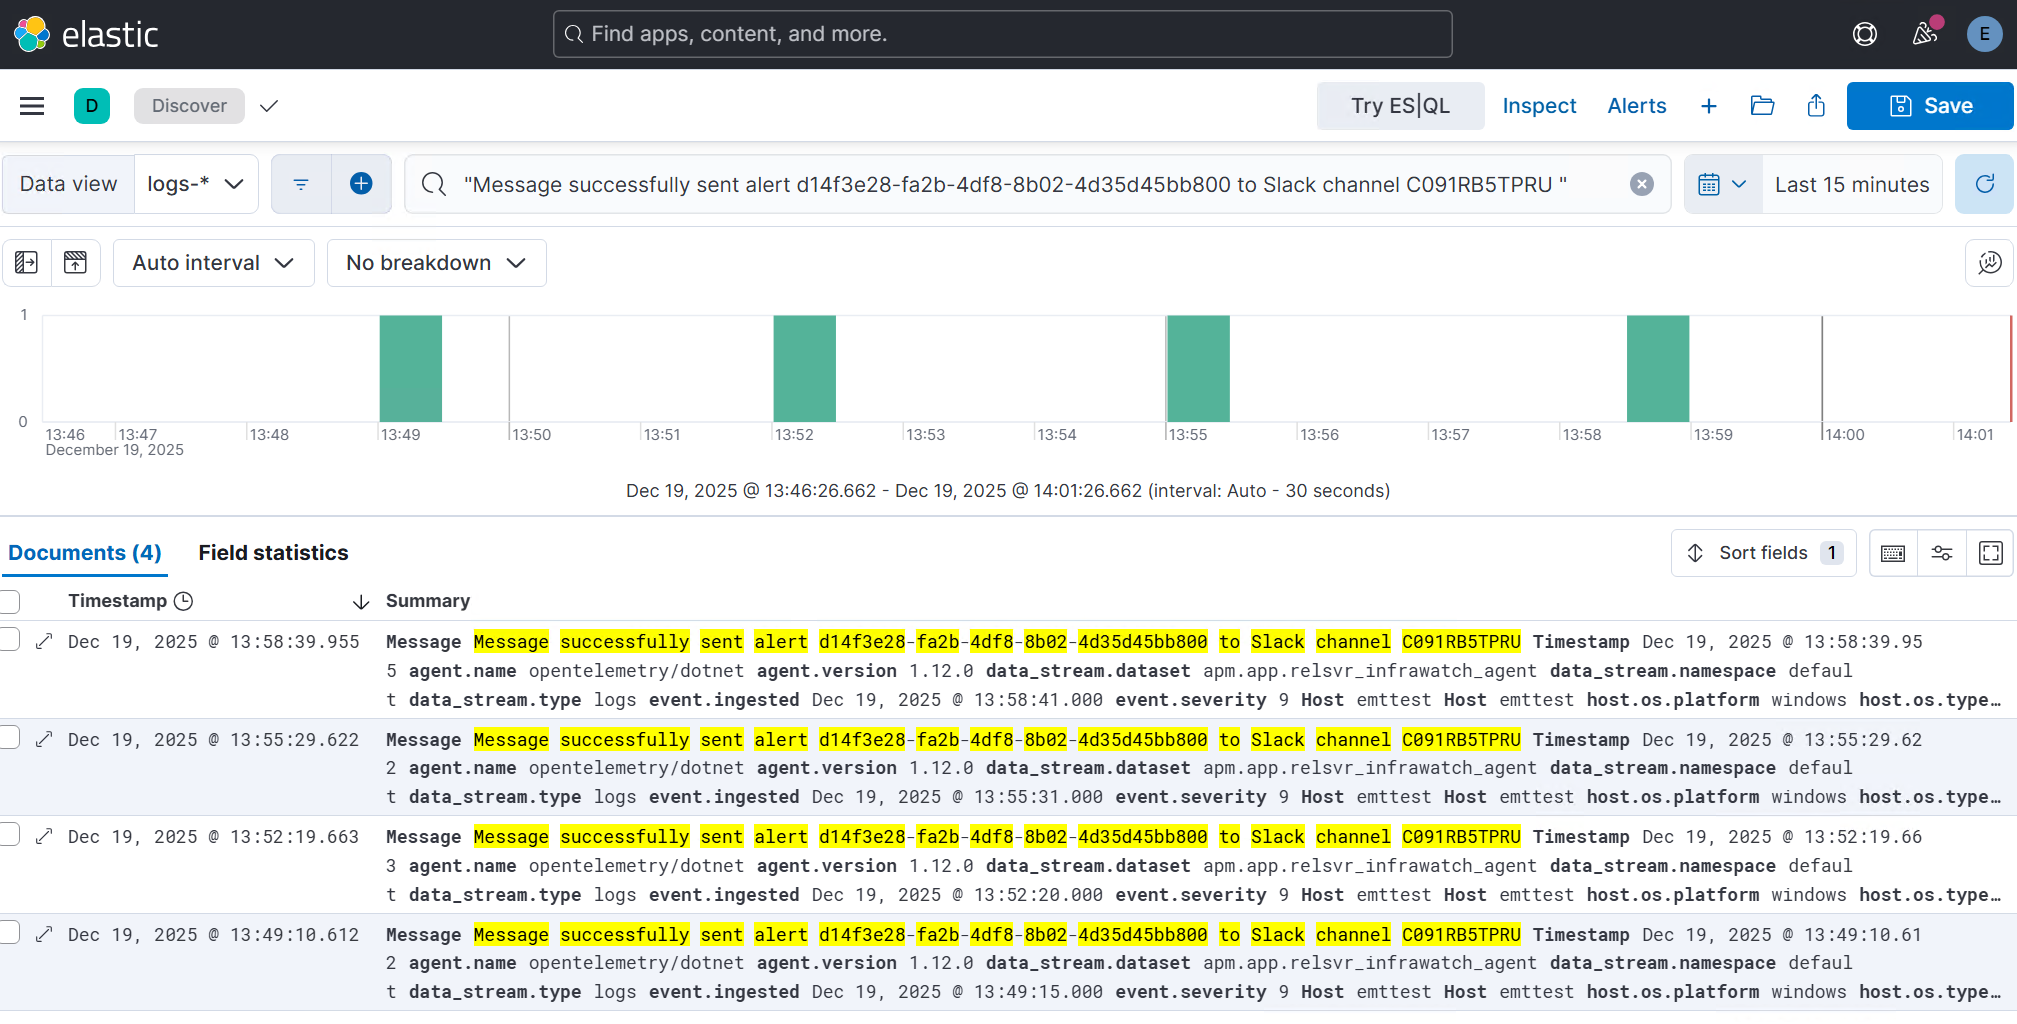
When troubleshooting Slack notification issues, the first step is to verify whether the following log message appears in Kibana Discover for the triggered alert.
- Log message:
Message successfully sent alert {AlertId} to Slack channel {SlackChannel}
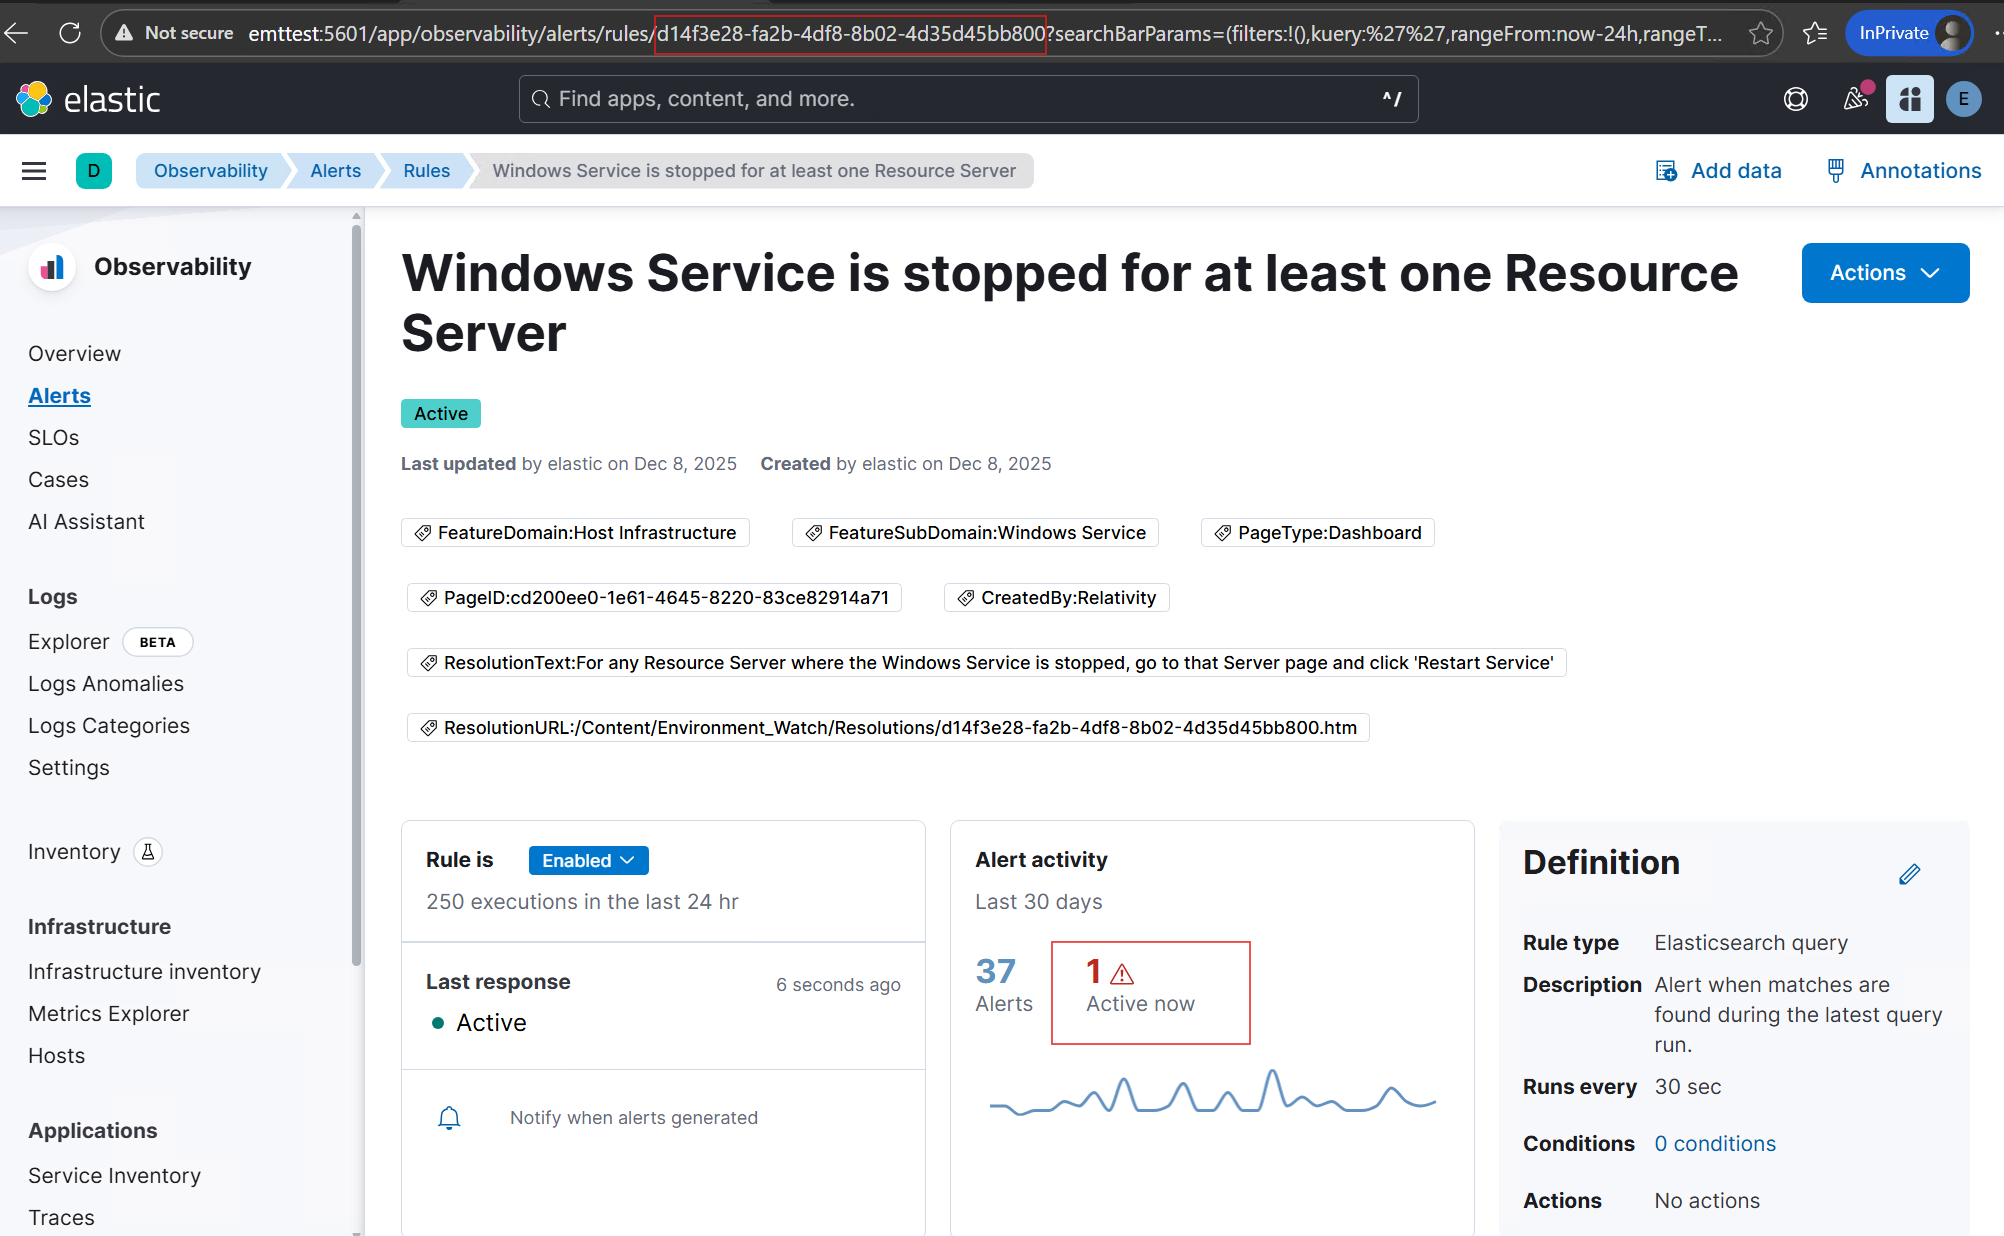
When a Kibana alert is triggered, and unable to see: "Message successfully sent alert to Slack channel " log in Kibana Discover
- Pass the Kibana Alert ID (
{AlertId}) and Slack Channel ID ({SlackChannel}) in Kibana Discover. - If the message is not found, it may indicate that the custom JSON configuration file is not set up correctly.
- Refer to Common Issues section 1.1 to 1.4 to troubleshoot why the Environment Watch Windows service is not picking up the custom JSON configuration file changes.
The log message appears in Kibana Discover after fixing common issues, but Slack notifications are still not being sent
- Verify that the Slack handler is correctly configured in the
alertNotificationHandlerssection of the custom JSON configuration file. - Ensure that the
accessToken,channel,enabled, andmessageIntervalSecondsproperties are set correctly. - This can also occur if the Slack API token is invalid or does not have the necessary permissions to post messages to the specified channel.
- Verify the token and permissions.
- Once the issues above are resolved, Slack notifications should be sent successfully.
If users need to adjust the frequency of Slack messages, follow these steps:
- Set the
messageIntervalSecondsproperty in the Slack handler configuration to a value greater than or equal to 180 seconds to avoid rate limiting by Slack. - Restart the Environment Watch Windows service to apply the changes.
File Log Receiver
If RabbitMQ logs do not appear in Kibana after configuring the file log receiver, fix the common issues outlined in Common Issues before reviewing the following potential causes:
After fixing the common issues, if RabbitMQ logs still do not appear in Kibana, review the following potential causes:
Verify the file log receiver configuration in the custom JSON configuration file.
- Ensure the custom JSON configuration file contains the
openTelemetryOverridessection with a validlogSourcesarray. - Set
enabledtotruefor the desired log source. - Place the configuration under the
openTelemetryOverridessection.
Example:
Copy
{
  "environmentWatchConfiguration": {
    "monitoring": {
      "instance": {
        "sources": {
          "certificates": {},
          "windowsServices": {}
        },
        "otelCollectorYamlFiles": []
      },
      "installedProducts": [],
      "hosts": [],
      "openTelemetryOverrides": {
            "logSources": [
              {
                "type": "rabbitmq",
                "enabled": true,
                "logFilePath": "C:\\rabbitmq\\data\\log\\rabbit@localhost.log",
                "multilineStartPattern": "^\\d{4}-\\d{2}-\\d{2} \\d{2}:\\d{2}:\\d{2}\\.\\d{6}[+-]\\d{2}:\\d{2}",
                "regexPattern": "^(?P<rabbitmq_log_date_time>\\d{4}-\\d{2}-\\d{2} \\d{2}:\\d{2}:\\d{2}\\.\\d{6}[+-]\\d{2}:\\d{2}) \\[(?P<severity>[a-z]*)\\] <(?P<rabbitmq_pid_node>\\d+)\\.(?P<rabbitmq_pid_process>\\d+)\\.(?P<rabbitmq_pid_serial>\\d+)>[ \\t]*(?P<message>[\\s\\S]*)$",
                "timestampLayout": "%Y-%m-%d %H:%M:%S.%f%j"
              }
            ]
        }
    },
    "alertNotificationHandlers": {}
  }
}
Verify the log file path is accessible.
- The log file path specified in the configuration must be accessible from the host where the Environment Watch Windows service is running.
- Verify the RabbitMQ installation path is correct.
- The file name matches and the path matches the location of the log file on the host machine.
- The Environment Watch service account has read permissions to the file.
Verify the OpenTelemetry Collector detected the RabbitMQ configuration.
- Navigate to Kibana > Discover.
- Select the logs-* data view.
- Search for:
Copy
"RabbitMQ configuration found in the shared Json configuration."
- If no results appear:
- Review the custom JSON configuration file for syntax errors.
- Ensure the
enabledflag is set totruein thelogSourcesarray. - Restart the Environment Watch Windows service.
- Check Windows Event Viewer for OpenTelemetry Collector errors.
Verify the regexPattern field names match the required field names.
- The named capture groups in
regexPatternmust exactly match the default field names defined in the source code. Incorrect field names will cause the OpenTelemetry Collector to throw a fatal error and stop working. - Verify the following required field names are used:
rabbitmq_log_date_timeseverityrabbitmq_pid_noderabbitmq_pid_processrabbitmq_pid_serialmessage
- Compare the configuration against the example in the File Log Receiver Configuration document.
- Restart the Environment Watch Windows service after correcting the field names.
Timestamps are incorrect or missing in Kibana.
- Verify the
timestampLayoutformat matches the log file timestamp format. - For RabbitMQ logs, use:
"%Y-%m-%d %H:%M:%S.%f%j". - The
%jsuffix handles the timezone offset component.
Multiline log entries are not grouping correctly.
- Verify the
multilineStartPatternregex matches the start of each new log entry. - Ensure backslashes are properly escaped in JSON (use
\\instead of\).
No log data in Kibana after configuration detection message appears.
- Verify the
enabledflag is set totruein thelogSourcesarray. - Confirm the log file contains recent entries.
- Check that the log file is actively being written to by RabbitMQ.
- Review the OpenTelemetry Collector logs in Kibana for parsing errors.
- Restart the Environment Watch Windows service to apply the changes.