


Feedback
Kibana Search Quick Reference for SQL-experienced Admins
This guide helps Relativity admins quickly transition from SQL to Kibana search by providing side-by-side examples of common queries. Use this as a quick reference when you need to find logs in Kibana.
This guide assumes you're already familiar with the Kibana Discover UI basics. If not, review the Introduction to Kibana Discover UI first.
KQL vs ES|QL: Choosing the Right Tool
Kibana supports two query languages. Here's when to use each:
Use KQL (Kibana Query Language) for:
- Simple searches: Finding logs containing specific text, errors, or field values
- Quick filters: Searching by application name, log level, or host
- Interactive exploration: Building queries with point-and-click filters
- Pattern matching: Using wildcards to find partial matches
Think of KQL as: Your WHERE clause in SQL's simple filtering and pattern matching.
Use ES|QL (Elasticsearch Query Language) for:
- Aggregations: Counting, grouping, and statistical analysis
- Complex transformations: Calculations, derived fields, and data reshaping
- Multi-step queries: Piping data through multiple operations
- Advanced analytics: Top N queries, percentiles, and trending
Think of ES|QL as: Full SQL including GROUP BY, ORDER BY, LIMIT, and aggregate functions like COUNT(), AVG(), and SUM().
Quick Tips
- Choose the right Data View: Select
logs-*for application logs - Set an appropriate time range: Narrowing the range improves performance
- Start simple: Begin with KQL for filtering, move to ES|QL when you need aggregations
- Case sensitivity: KQL operators are case-insensitive, but quoted values must match exactly
- Wildcards: Use
*for pattern matching, but be specific to maintain performance
Section 1: Basic Searches with KQL
Use KQL for simple filtering and searching the equivalent of your SQL WHERE clause.
Find any log containing a word
How you'd think about it in SQL:
Copy
SELECT * FROM [EDDSLogging].[eddsdbo].[RelativityLogs] WHERE Message LIKE '%error%'
How to do it in Kibana (KQL):
Copy
error
Searches across all fields for the word "error". Case-insensitive by default.
Search for multiple terms (OR condition)
SQL approach:
Copy
SELECT * FROM [EDDSLogging].[eddsdbo].[RelativityLogs]
WHERE Message LIKE '%error%' OR Message LIKE '%warning%'
Kibana (KQL):
Copy
error OR warning
Finds logs containing either "error" OR "warning".
Search for multiple conditions (AND)
SQL approach:
Copy
SELECT * FROM [EDDSLogging].[eddsdbo].[RelativityLogs]
WHERE (Message LIKE '%error%' OR Message LIKE '%warning%')
  AND (Message LIKE '%document%' OR Message LIKE '%import%')
Kibana (KQL):
Copy
(error OR warning) AND (document OR import)
Use parentheses to group conditions, just like SQL.
Search for an exact phrase
SQL approach:
Copy
SELECT * FROM [EDDSLogging].[eddsdbo].[RelativityLogs]
WHERE Message = 'Failed to retrieve favorites'
Kibana (KQL):
Copy
"Failed to retrieve favorites"
Quotes ensure the exact phrase is matched.
Search a specific field
SQL approach:
Copy
SELECT * FROM [EDDSLogging].[eddsdbo].[RelativityLogs]
WHERE Level = 'Error' OR Level = 'Fatal'
Kibana (KQL):
Copy
log.level:"Error" OR log.level:"Fatal"
Field names follow dot notation (e.g., log.level, labels.Application).
Use wildcards for pattern matching
SQL approach:
Copy
SELECT * FROM [EDDSLogging].[eddsdbo].[RelativityLogs]
WHERE Exception LIKE '%The application failed%'
Kibana (KQL):
Copy
error.stack_trace:*The application failed*
The * wildcard matches any characters, similar to % in SQL.
Exclude results (NOT operator)
SQL approach:
Copy
SELECT * FROM [EDDSLogging].[eddsdbo].[RelativityLogs]
WHERE Exception LIKE '%The application failed%'
  AND Level != 'Information'
Kibana (KQL):
Copy
error.stack_trace:*The application failed* AND NOT log.level:"Information"
Use NOT to exclude specific values.
Find errors for a specific application
SQL approach:
Copy
SELECT * FROM [EDDSLogging].[eddsdbo].[RelativityLogs]
WHERE (Level = 'Error' OR Level = 'Fatal')
  AND Properties.value('(//Application)[1]', 'nvarchar(max)') = 'Imaging'
  AND Properties.value('(//SubSystem)[1]', 'nvarchar(max)') = 'Import'
Kibana (KQL):
Copy
(log.level:"Error" OR log.level:"Fatal") AND labels.Application:"Imaging" AND labels.SubSystem:"Import"
Combine multiple field filters to narrow down results.
Find all logs for a specific host
SQL approach:
Copy
SELECT * FROM [EDDSLogging].[eddsdbo].[RelativityLogs]
WHERE Properties.value('(//HostName)[1]', 'nvarchar(max)') = 'RELVM-WEB01'
Kibana (KQL):
Copy
host.name:"RELVM-WEB01"
Find disabled agents
SQL approach:
Copy
SELECT * FROM [EDDS].[eddsdbo].[Agent]
WHERE Enabled = 0
**Kibana (KQL):
Copy
relsvr.agent.disabled:1
KQL Reference Summary
KQL works like your SQL WHERE clause:
Copy
-- SQL pattern
SELECT * FROM [EDDSLogging].[eddsdbo].[RelativityLogs] WHERE [conditions]

-- Maps to KQL pattern
[field]:[value] AND/OR [field]:[value]
Common KQL patterns:
field:value| exact match on a fieldfield:*partial*| wildcard search"exact phrase"| match complete phraseAND,OR,NOT| logical operators(...)| group conditions
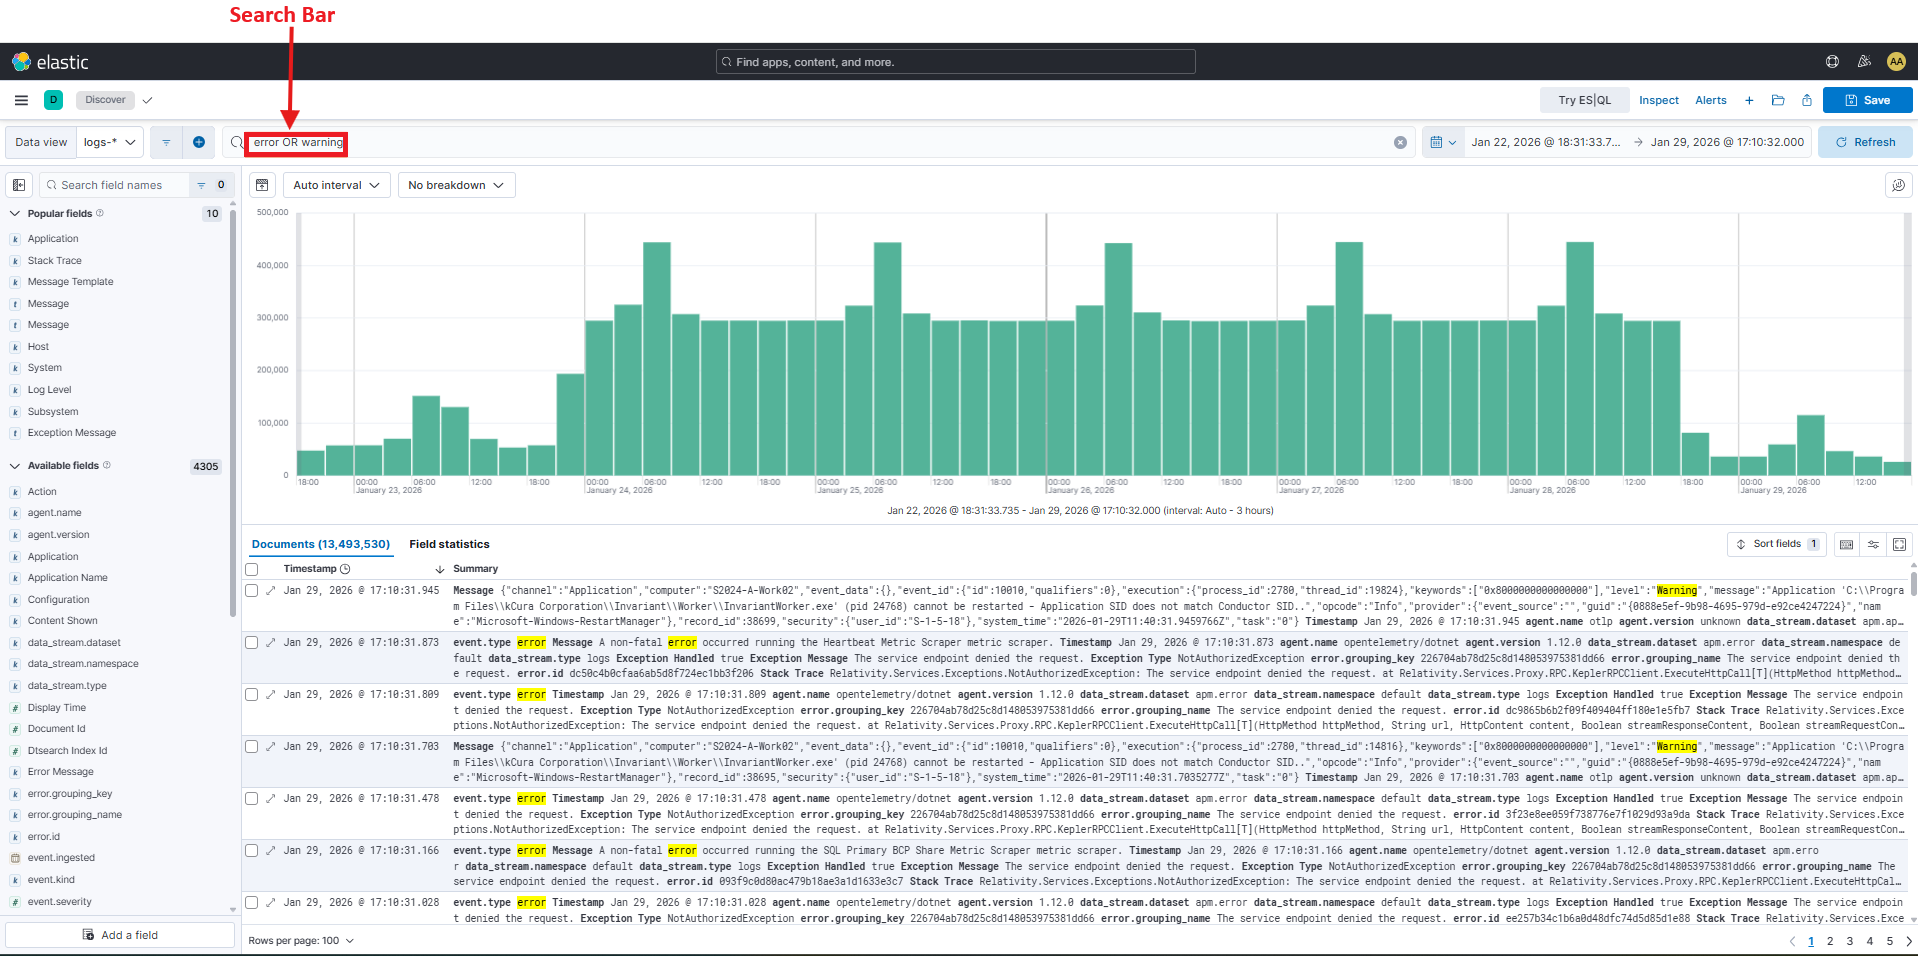
The screenshot above highlights a side-by-side comparison showing how SQL WHERE clauses translate to KQL field:value syntax. Notice how SQL's LIKE operator with % wildcards becomes * in KQL.
Section 2: Advanced Queries with ES|QL
Use ES|QL when you need aggregations, grouping, or calculations or the full power of SQL including GROUP BY, COUNT(), AVG(), and ORDER BY.
ES|QL uses a pipe-based syntax where data flows through transformations:
Copy
FROM [data-view]
| WHERE [filter-conditions]
| STATS [aggregations] BY [group-by-fields]
| SORT [field] DESC
| LIMIT [number]
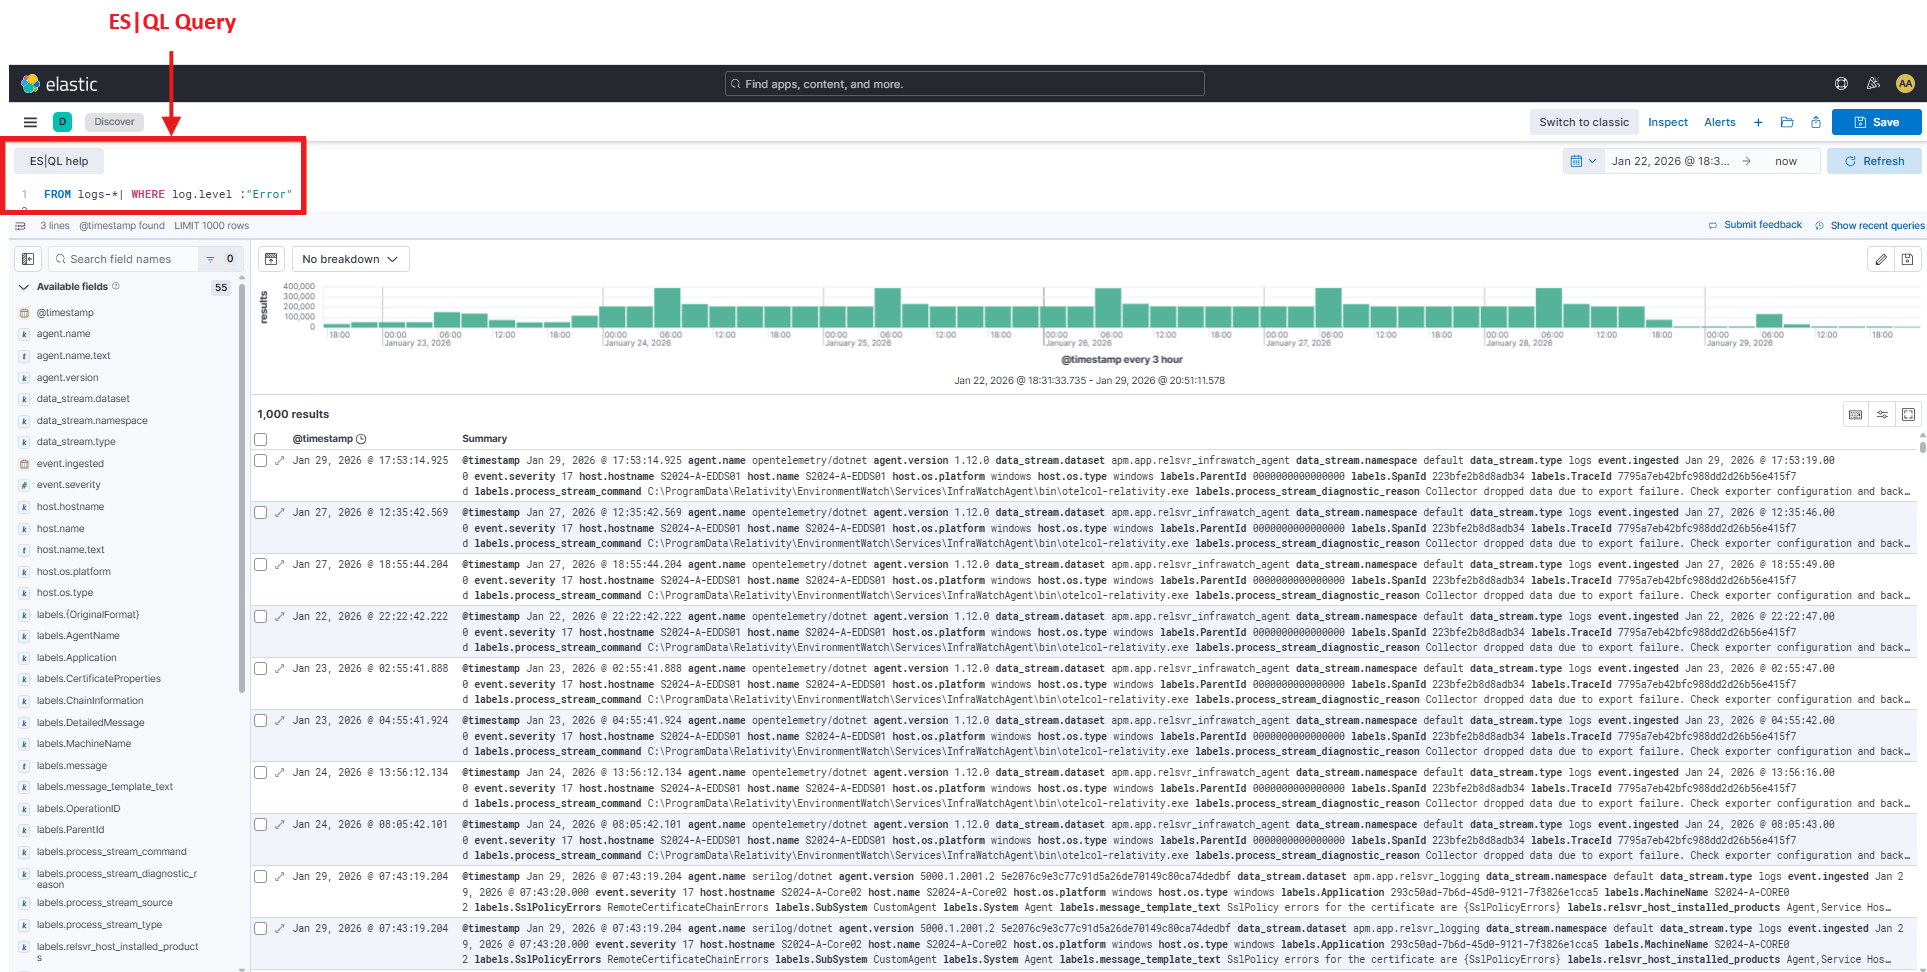
The screenshot above highlights an example of an ES|QL query showing the pipe-based syntax. Notice how each line starts with a pipe (|) and operations flow top to bottom: FROM | WHERE | STATS | SORT. The results table appears below the query.
Count total logs
SQL approach:
Copy
SELECT COUNT(*) AS total_logs
FROM [EDDSLogging].[eddsdbo].[RelativityLogs]
Kibana (ES|QL):
Copy
FROM logs-*
| STATS total_logs = count()
Count logs by log level
SQL approach:
Copy
SELECT Level, COUNT(*) AS log_count
FROM [EDDSLogging].[eddsdbo].[RelativityLogs]
GROUP BY Level
ORDER BY log_count DESC
Kibana (ES|QL):
Copy
FROM logs-*
| STATS log_count = count() BY log.level
| SORT log_count DESC
Count errors by application
SQL approach:
Copy
SELECT
    Properties.value('(//Application)[1]', 'nvarchar(max)') AS Application,
    COUNT(*) AS error_count
FROM [EDDSLogging].[eddsdbo].[RelativityLogs]
WHERE Level = 'Error'
GROUP BY Properties.value('(//Application)[1]', 'nvarchar(max)')
ORDER BY error_count DESC
Kibana (ES|QL):
Copy
FROM logs-*
| WHERE log.level == "Error"
| STATS error_count = count() BY labels.Application
| SORT error_count DESC
Note: ES|QL uses == for equality in WHERE clauses (not single =).
Top 5 applications with most errors
SQL approach:
Copy
SELECT TOP 5
    Properties.value('(//Application)[1]', 'nvarchar(max)') AS Application,
    COUNT(*) AS error_count
FROM [EDDSLogging].[eddsdbo].[RelativityLogs]
WHERE Level = 'Error'
GROUP BY Properties.value('(//Application)[1]', 'nvarchar(max)')
ORDER BY error_count DESC
Kibana (ES|QL):
Copy
FROM logs-*
| WHERE log.level == "Error"
| STATS error_count = count() BY labels.Application
| SORT error_count DESC
| LIMIT 5
Count logs by host
SQL approach:
Copy
SELECT
    Properties.value('(//HostName)[1]', 'nvarchar(max)') AS HostName,
    COUNT(*) AS log_count
FROM [EDDSLogging].[eddsdbo].[RelativityLogs]
GROUP BY Properties.value('(//HostName)[1]', 'nvarchar(max)')
ORDER BY log_count DESC
Kibana (ES|QL):
Copy
FROM logs-*
| STATS log_count = count() BY host.name
| SORT log_count DESC
Count errors per hour for a specific application
SQL approach:
Copy
SELECT
    DATEPART(HOUR, TimeStamp) AS hour,
    COUNT(*) AS error_count
FROM [EDDSLogging].[eddsdbo].[RelativityLogs]
WHERE Level = 'Error'
  AND Properties.value('(//Application)[1]', 'nvarchar(max)') = 'Imaging'
  AND TimeStamp >= DATEADD(DAY, -1, GETDATE())
GROUP BY DATEPART(HOUR, TimeStamp)
ORDER BY hour
Kibana (ES|QL):
Copy
FROM logs-*
| WHERE log.level == "Error" AND labels.Application == "Imaging"
| STATS error_count = count() BY hour = DATE_TRUNC(1 hour, @timestamp)
| SORT hour
Find applications with more than 100 errors
SQL approach:
Copy
SELECT
    Properties.value('(//Application)[1]', 'nvarchar(max)') AS Application,
    COUNT(*) AS error_count
FROM [EDDSLogging].[eddsdbo].[RelativityLogs]
WHERE Level = 'Error'
GROUP BY Properties.value('(//Application)[1]', 'nvarchar(max)')
HAVING COUNT(*) > 100
ORDER BY error_count DESC
Kibana (ES|QL):
Copy
FROM logs-*
| WHERE log.level == "Error"
| STATS error_count = count() BY labels.Application
| WHERE error_count > 100
| SORT error_count DESC
Note: In ES|QL, the second WHERE acts like SQL's HAVING clause.
Multiple aggregations in one query
SQL approach:
Copy
SELECT
    Properties.value('(//Application)[1]', 'nvarchar(max)') AS Application,
    COUNT(*) AS total_logs,
    SUM(CASE WHEN Level = 'Error' THEN 1 ELSE 0 END) AS error_count,
    SUM(CASE WHEN Level = 'Warning' THEN 1 ELSE 0 END) AS warning_count
FROM [EDDSLogging].[eddsdbo].[RelativityLogs]
GROUP BY Properties.value('(//Application)[1]', 'nvarchar(max)')
Kibana (ES|QL):
Copy
FROM logs-*
| STATS
    total_logs = count(),
    error_count = count_if(log.level == "Error"),
    warning_count = count_if(log.level == "Warning")
  BY labels.Application
Group by multiple fields
SQL approach:
Copy
SELECT
    Properties.value('(//Application)[1]', 'nvarchar(max)') AS Application,
    Properties.value('(//SubSystem)[1]', 'nvarchar(max)') AS SubSystem,
    COUNT(*) AS error_count
FROM [EDDSLogging].[eddsdbo].[RelativityLogs]
WHERE Level = 'Error'
GROUP BY Properties.value('(//Application)[1]', 'nvarchar(max)'), Properties.value('(//SubSystem)[1]', 'nvarchar(max)')
ORDER BY error_count DESC
Kibana (ES|QL):
Copy
FROM logs-*
| WHERE log.level == "Error"
| STATS error_count = count() BY labels.Application, labels.SubSystem
| SORT error_count DESC
ES|QL Reference Summary
ES|QL provides full SQL-like querying:
Copy
-- SQL pattern
SELECT [fields], COUNT(*), AVG(field)
FROM [table]
WHERE [conditions]
GROUP BY [fields]
HAVING [aggregate-conditions]
ORDER BY [field] DESC
LIMIT [number]

-- Maps to ES|QL pattern
FROM [data-view]
| WHERE [conditions]
| STATS [aggregations] BY [group-fields]
| WHERE [aggregate-conditions]
| SORT [field] DESC
| LIMIT [number]
Key ES|QL Commands:
FROM| Select data source (like SQLFROM)WHERE| Filter rows (like SQLWHEREandHAVING)STATS| Aggregate data (like SQLSELECTwith aggregates)BY| Group results (like SQLGROUP BY)SORT| Order results (like SQLORDER BY)LIMIT| Restrict results (like SQLTOPorLIMIT)EVAL| Create calculated fields (like SQL calculated columns)
Important differences from SQL:
- Use
==for equality (not=) in WHERE clauses - Use
|pipes to chain operations instead of commas - Aggregation aliases come before the function:
error_count = count()
Quick Reference: Common Admin Queries
Copy and paste these frequently-used queries:
All disabled agents
Copy
relsvr.agent.disabled:1
Specific disabled agent (e.g., Billing Agent)
Copy
relsvr.agent.disabled:1 AND labels.relsvr_agent_type:"Billing Agent"
Service discovery failures
Copy
labels.message_template_text:"GetServiceLocationAsync lookup for {ServiceIdentifier} {ServiceVersion} failed!"
Database connection errors
Copy
error.stack_trace:*SqlException* OR error.stack_trace:*connection*
Timeout errors across all applications
Copy
error.stack_trace:*timeout* OR error.message:*timeout*
All RabbitMQ-related logs
Copy
labels.rabbitmq_node_name:*
Import job failures
Copy
(log.level:"Error" OR log.level:"Fatal") AND labels.SubSystem:"Import"
Agent errors in the last 15 minutes
Copy
(log.level:"Error" OR log.level:"Fatal") AND labels.relsvr_agent_type:*
Set time range to "Last 15 minutes" in the Kibana UI.
Additional Resources
Official Documentation
- Kibana Query Language (KQL) - Complete KQL reference
- Elastic ES|QL Documentation - Full ES|QL syntax guide
Community Cheat Sheets
- Kibana Search Cheatsheet by Tim Roes
- Elasticsearch and Kibana v8 Search Cheat Sheet by Mike Polinowski
- SQL to Kusto Query Translation (Microsoft Learn) - Similar query concepts
Related Documentation
- Introduction to Kibana Discover UI - Learn the Kibana interface
- How To - Search Logs Using Kibana - Step-by-step search guide