


Feedback
Introduction to Kibana Discover
Kibana Discover is a powerful interface for exploring and searching your data stored in Elasticsearch. This guide provides first-time users with an overview of the Discover UI and basic navigation for working with Environment Watch and Data Grid Audit data.
Accessing Kibana Discover
Log in to Kibana with an admin user.
Navigating to Discover
- Open the Menu: Click the hamburger menu.
- Select Discover: Found under Analytics.
- Select a Data View: Choose an existing Data View (examples:
logs-*,metrics-*,apm-*) to define which Elasticsearch indices you want to search. The Data View determines what data appears in your search results.
If no Data Views exist, you'll need to create one first. For more details, see:
Key UI Elements
The Discover interface contains:
Reference:Kibana Discover Interface Documentation
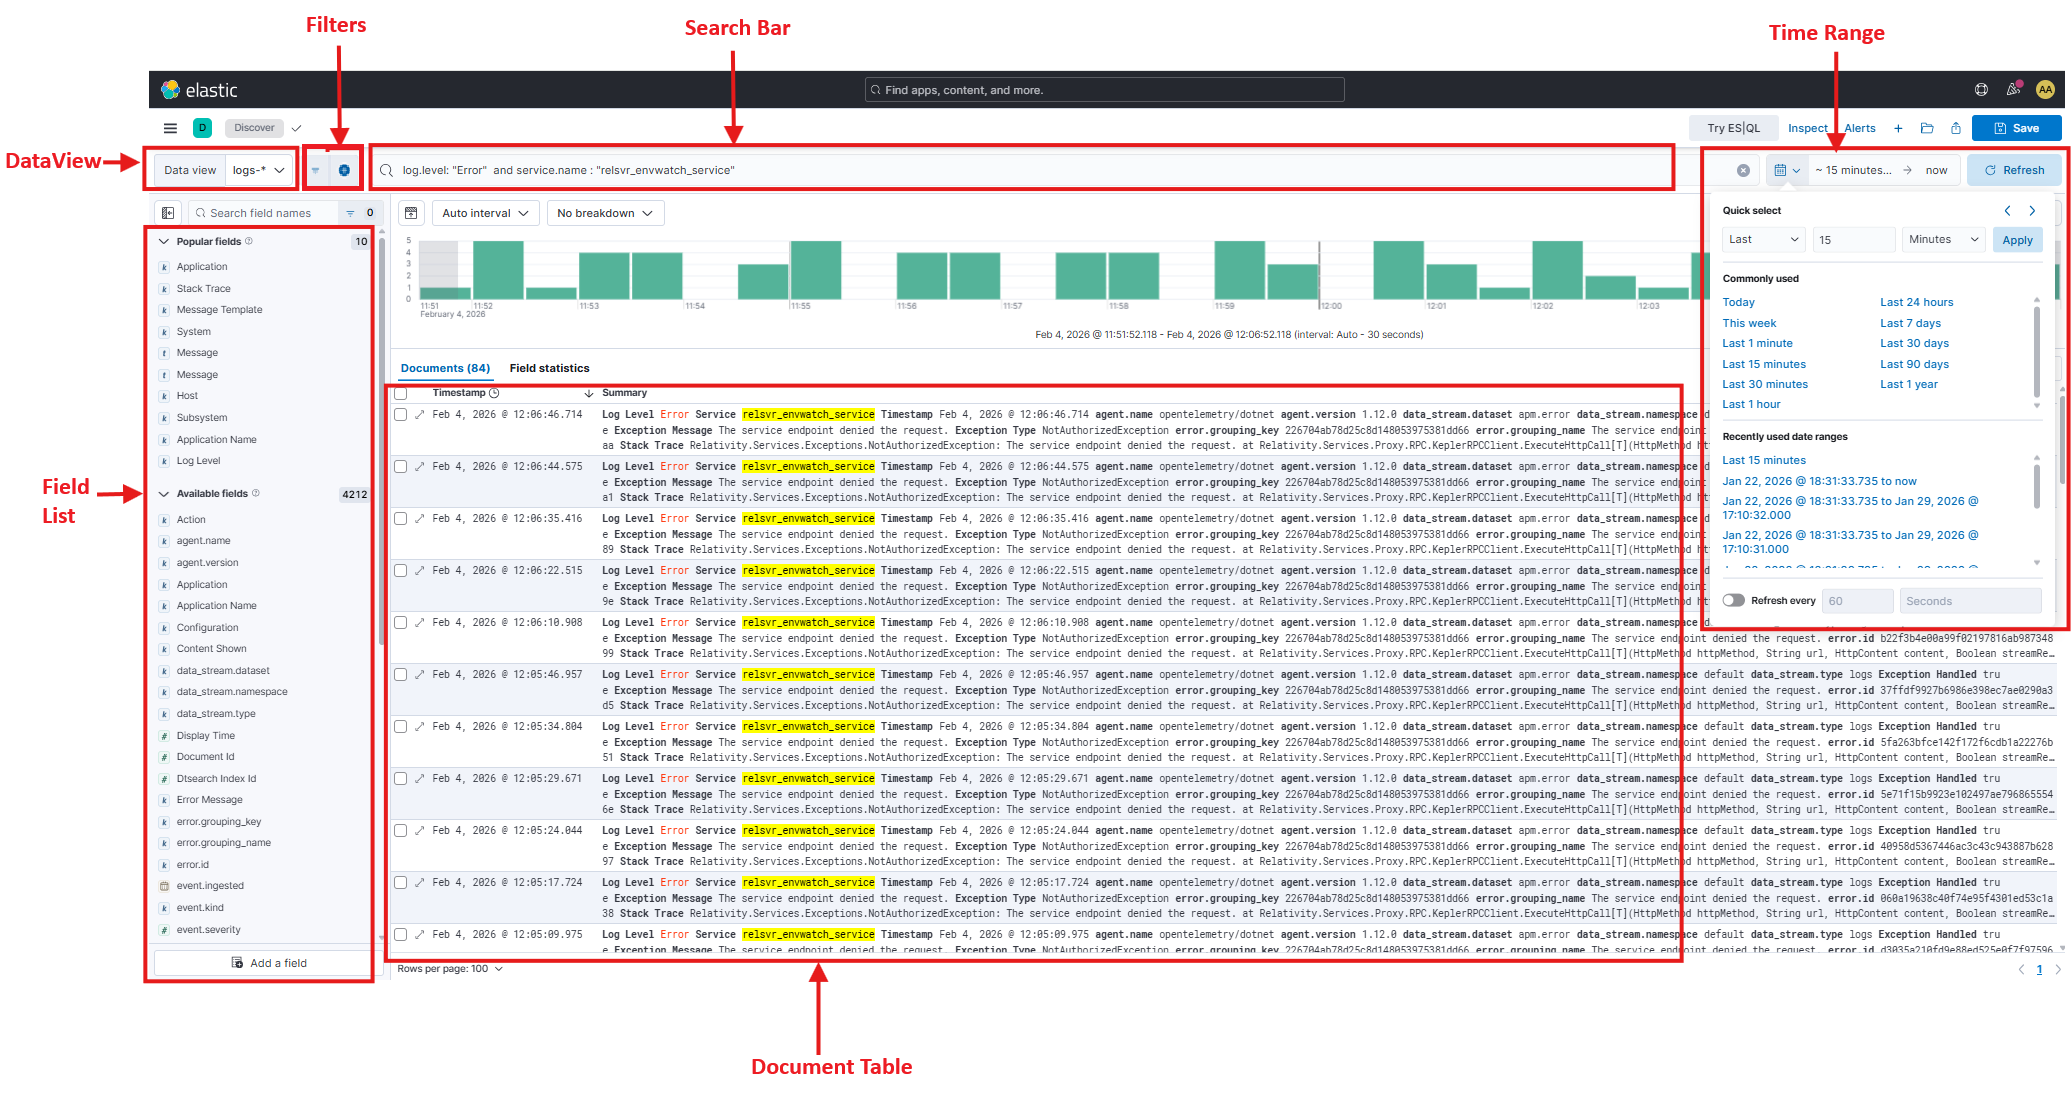
The screenshot above highlights the following key areas:
- Data View (top left): Selects which indices (data view) you are searching
- Filters (top 2nd left): Filter pills and Add filter control for refining results
- Search Bar (top center): Where you enter KQL queries
- Field List (left panel): Available fields you can add as columns
- Document Table (center): Timeline histogram and log results
- Time Picker (top right): Control the time range
Components
-
Search Bar: Enter KQL queries like:
log.level: ERROR and service.name: "relsvr_envwatch_service"
-
Time Picker: Choose ranges (Last 15m, 1h, 24h, custom).
-
Field List: Add/remove fields as columns, view distributions.
-
Document Table: Timeline histogram + log/event results.
-
Filters Bar: Manage active filters.
Basic Navigation
Time Ranges
Adjusting the time range is critical when working with Environment Watch data. Narrowing the time window helps you focus on specific incidents or time periods, improves query performance, and ensures you're looking at relevant data.
- Quick ranges: 15m, 1h, 24h, 7d
- Custom: absolute or relative ranges
- Auto-refresh: refreshes results every X seconds
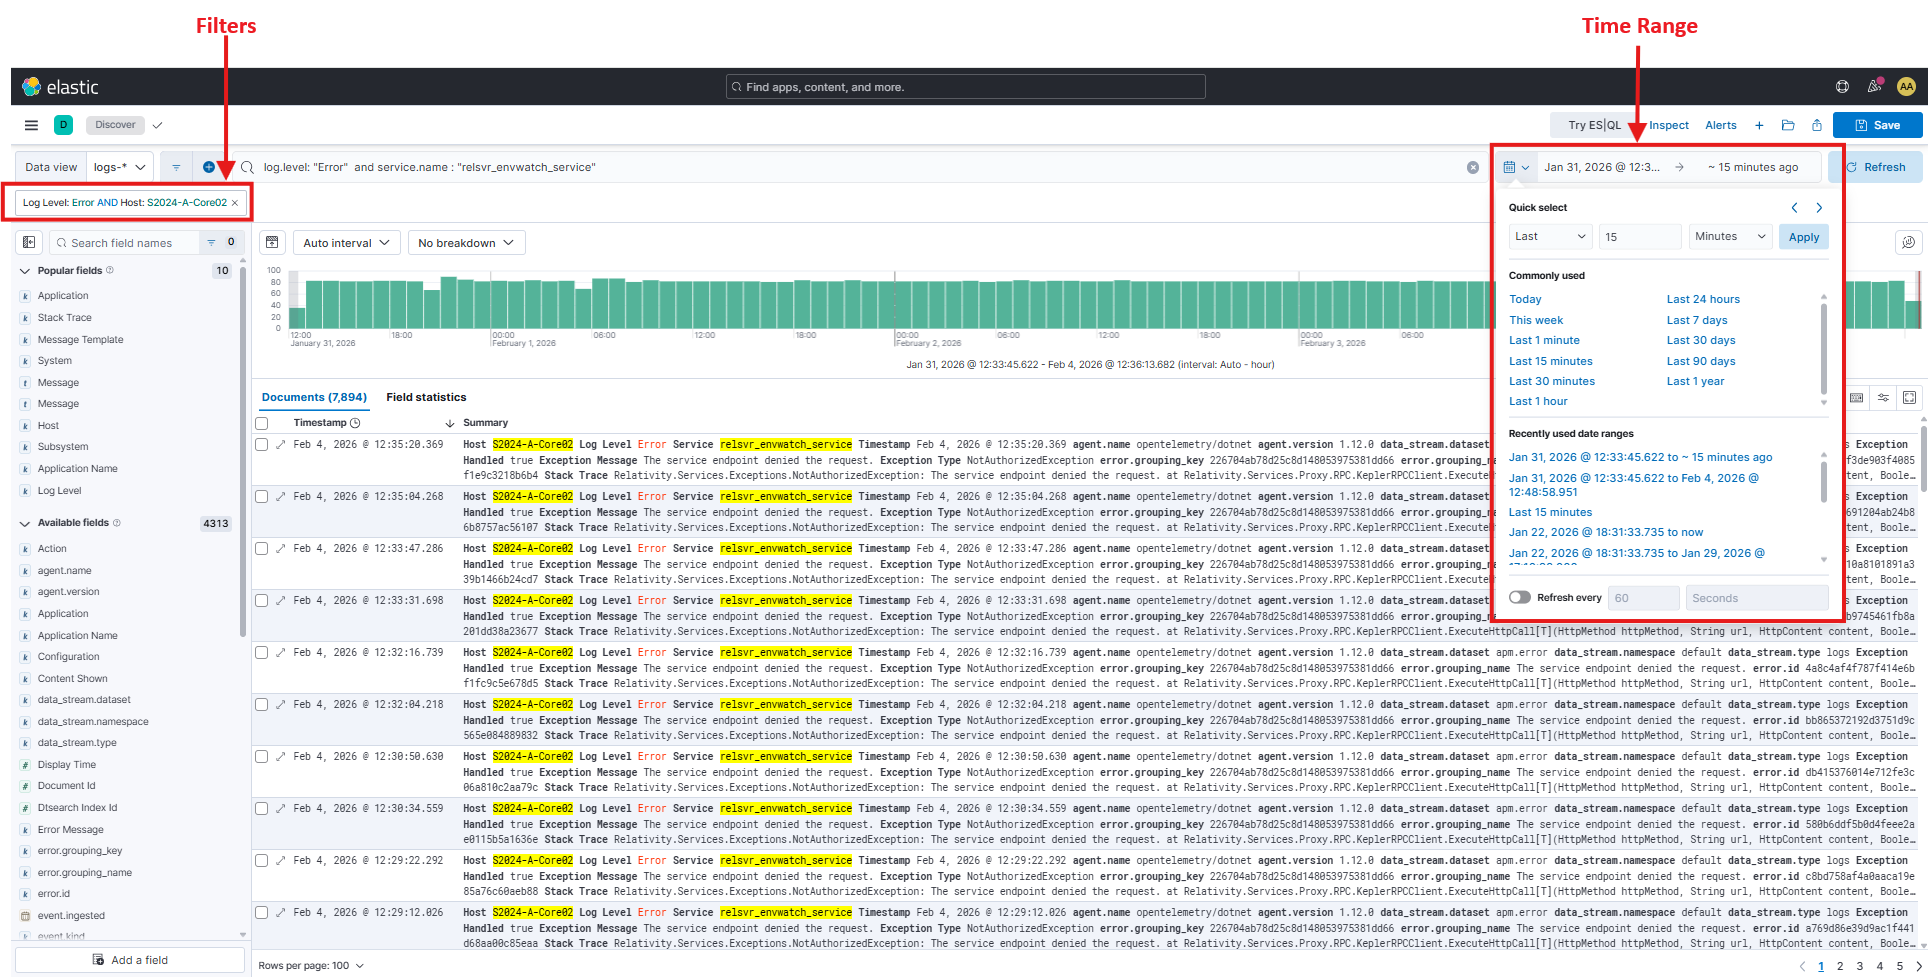
The screenshot above highlights the Time Picker dropdown showing quick range options (15m, 1h, 24h) and custom date/time selection. Click the time display in the top-right corner to open this menu.
Columns
Customizing columns allows you to see the most relevant fields for your investigation without expanding each document. This is especially useful when scanning through many log entries.
- Add: Hover over field |
+ - Remove: Column menu | Remove
- Reorder: Drag column headers
Save and Load Searches
- Save: Name and description
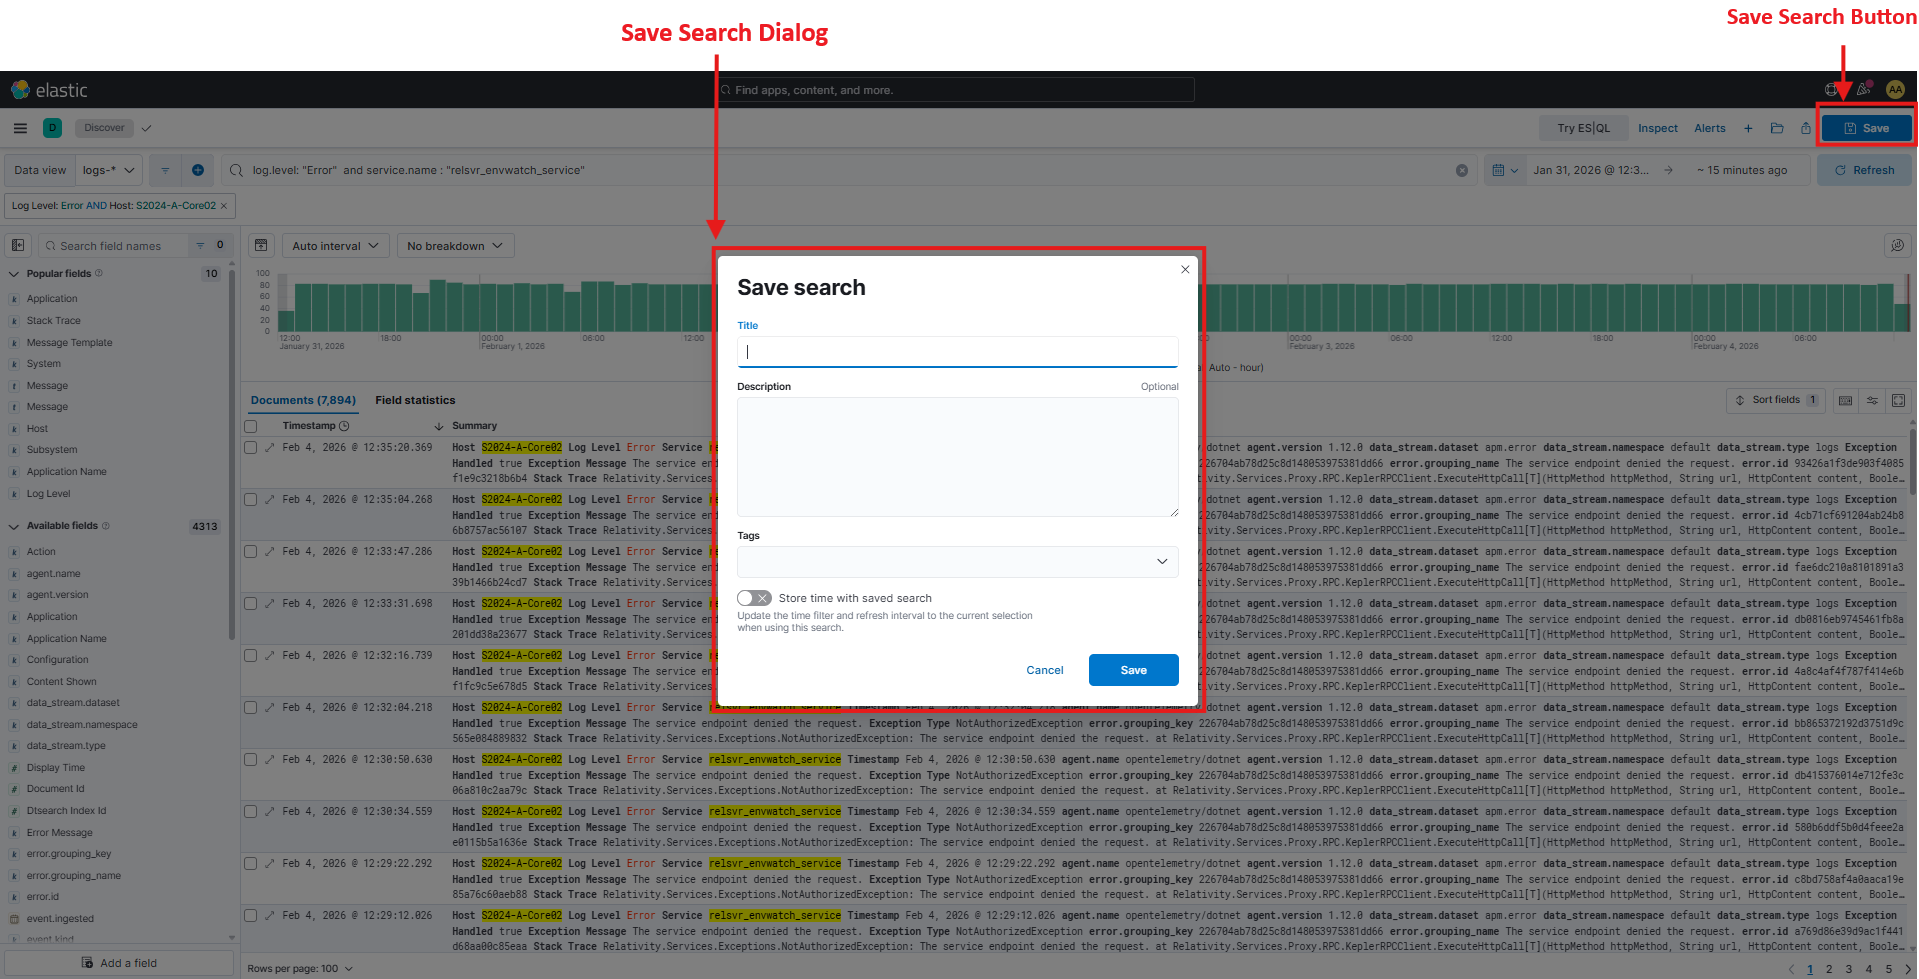
The screenshot above highlights the "Save" button (top-right) which opens a dialog where you can name your search and add a description for future reference.
- Open: Load saved searches
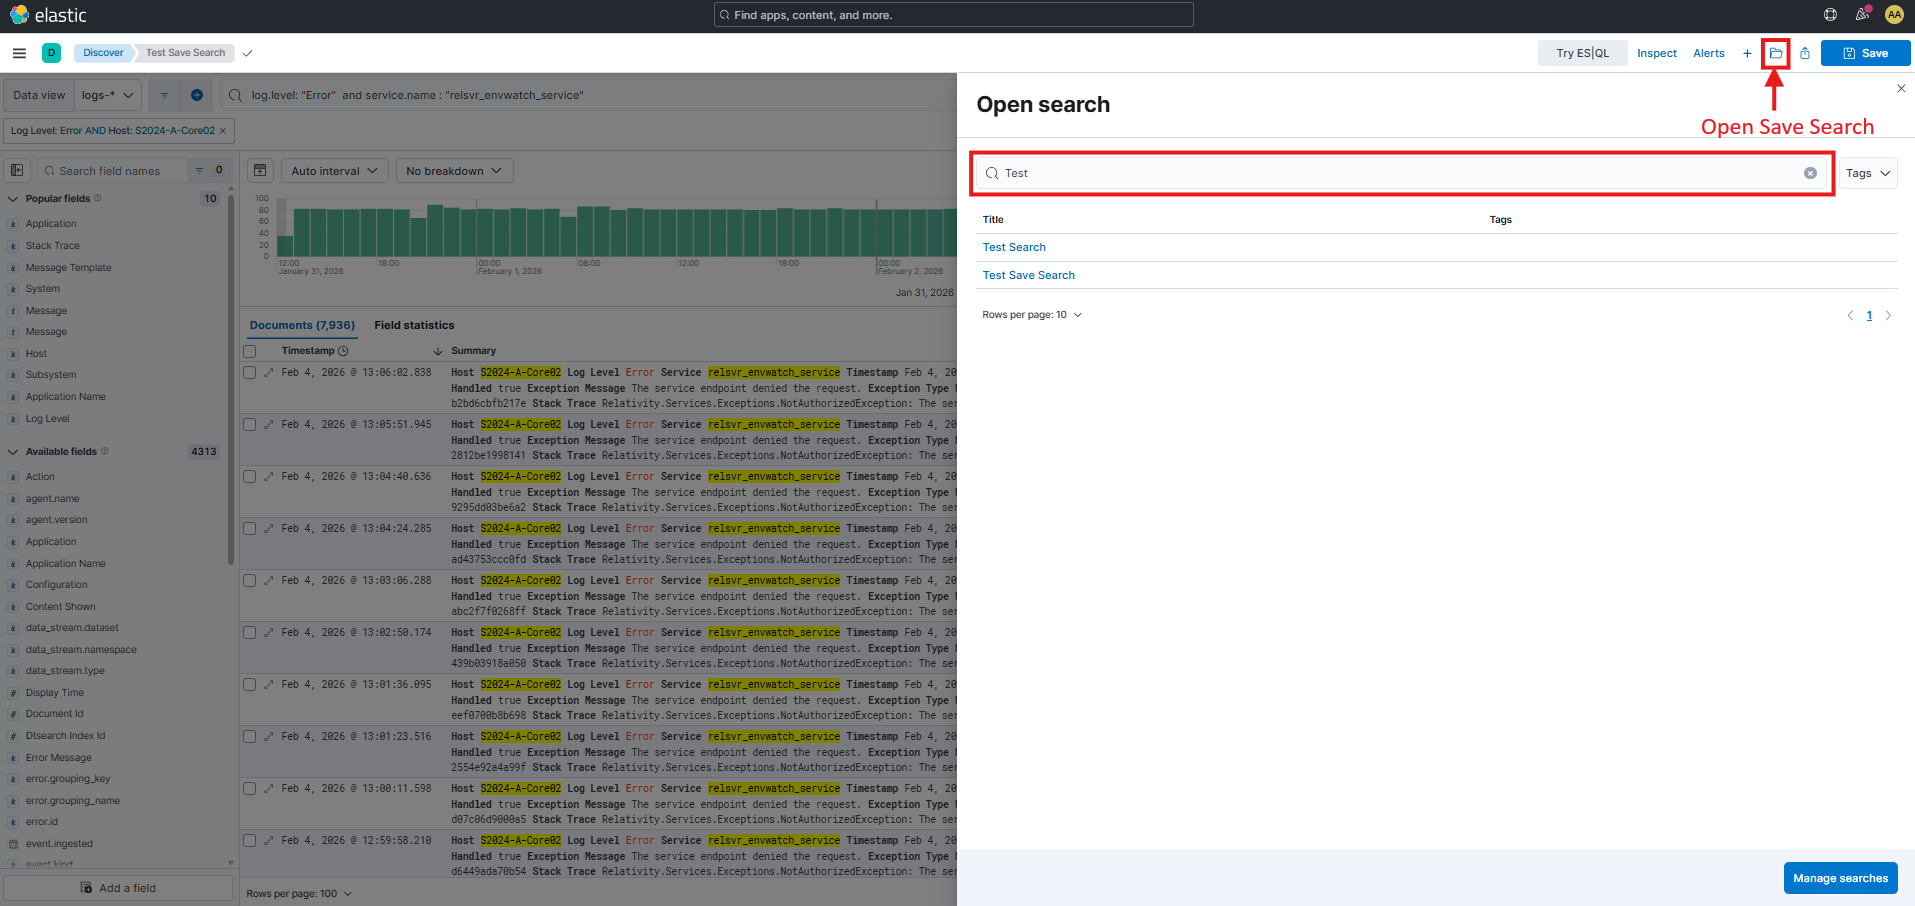
The screenshot above highlights the "Open" menu showing all previously saved searches. Click any saved search name to load it instantly.
- Share/export: saved objects
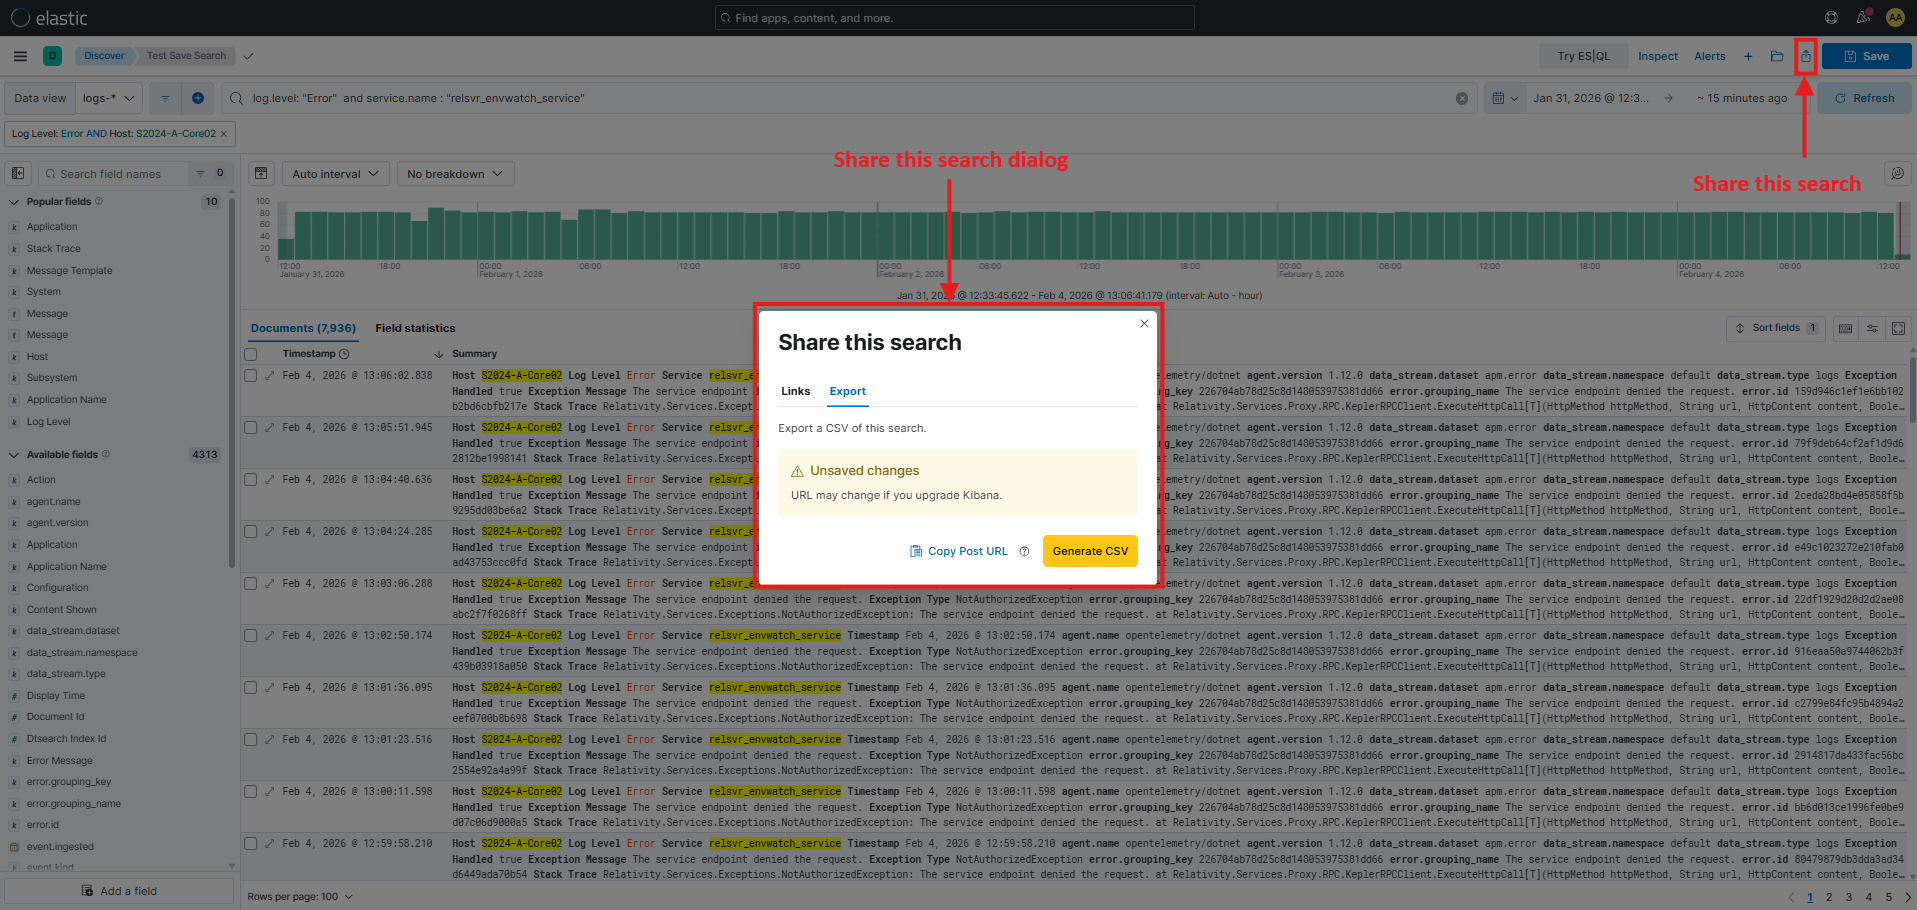
The screenshot above highlights the "Share" menu providing options to export search results, generate CSV reports, or share permalinks with colleagues.
Filters
Filters let you refine your search results without writing KQL queries. They're particularly useful for quickly narrowing down Environment Watch data by specific hosts, services, or log levels while preserving the ability to easily adjust or remove criteria.
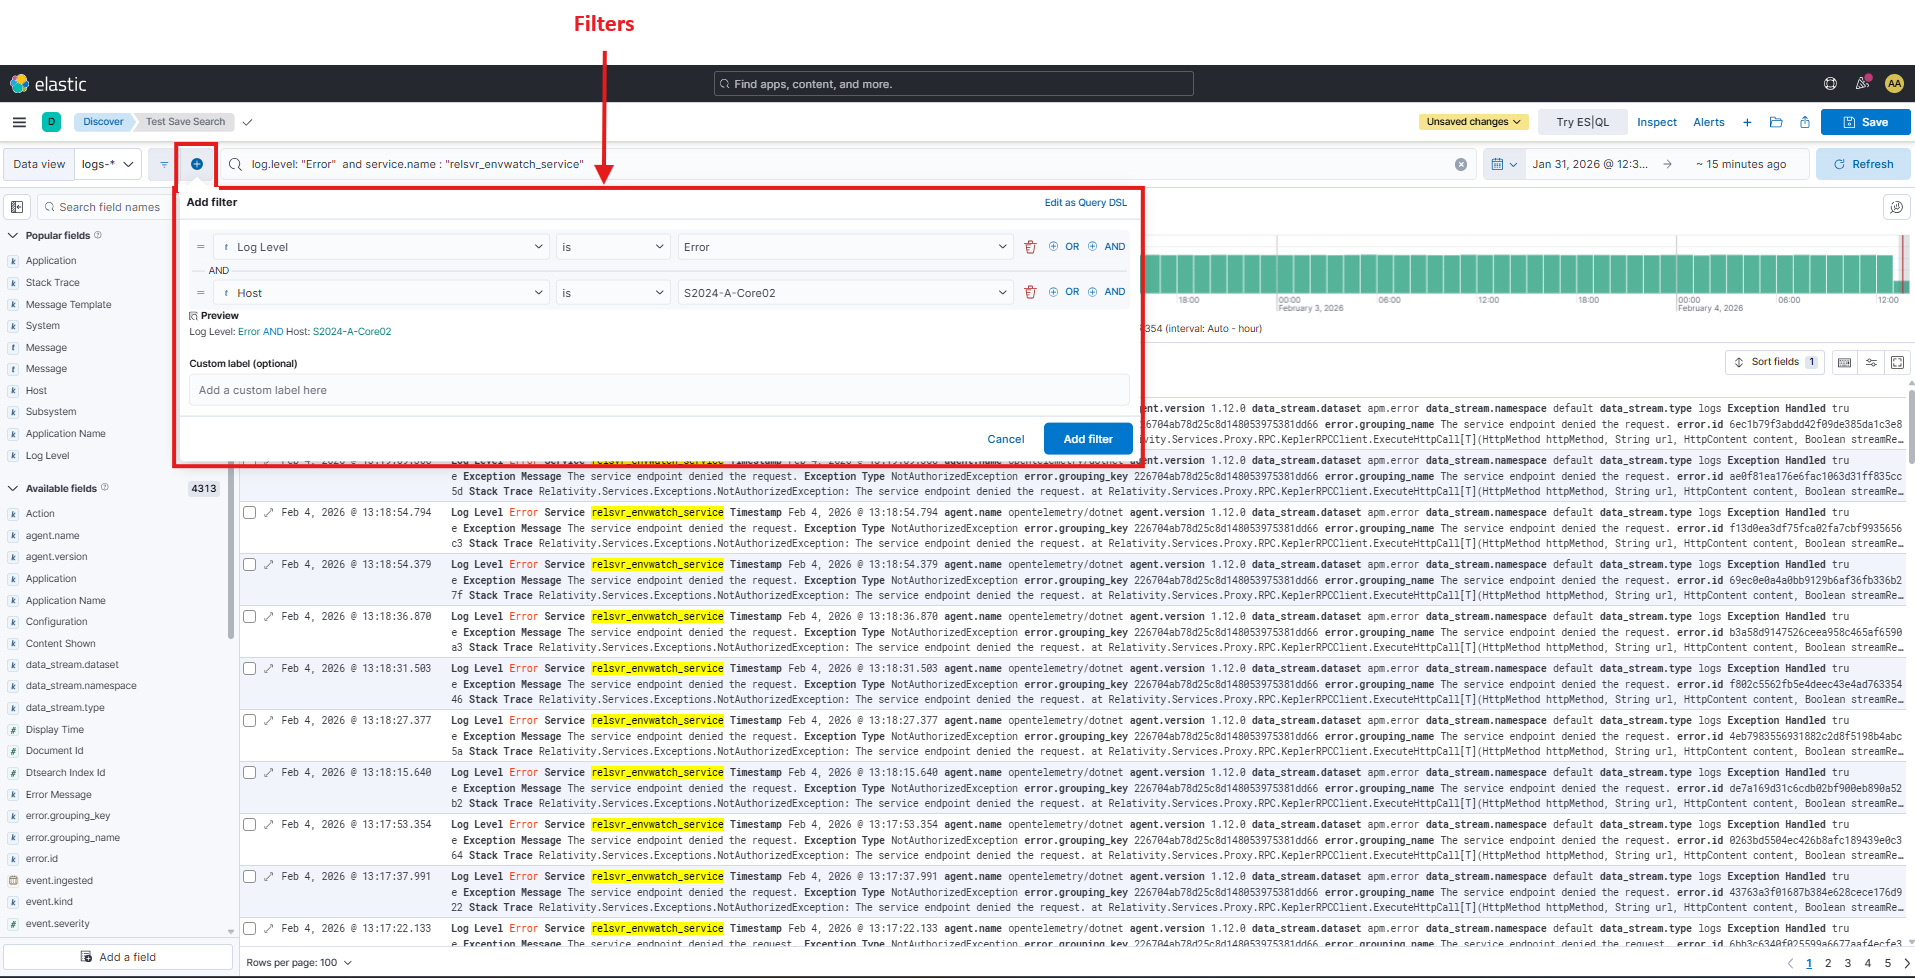
- Add manually via
+ Add filter - Add from field values (
+or-) - Add from document fields
- Manage: disable, edit, delete, pin