


Feedback

Kibana is required for Environment Watch only.
Official Documentation: For detailed Kibana installation guidance, see Elastic's official Kibana installation documentation and Windows installation guide.
C:\elastic (e.g., C:\elastic\kibana-x.x.x).Navigate to Kibana's bin folder (e.g., C:\elastic\kibana-x.x.x\bin).
Open an elevated PowerShell window and run the following command:
.\kibana.bat
If successful, you should see output indicating that the Kibana server has started and is listening on port 5601. Look for lines similar to:
C:\elastic\elasticsearch-x.x.x\bin).Single Cluster with Multiple Nodes: Run this command on a master-eligible node server.
.\elasticsearch-create-enrollment-token.bat --scope kibana
eyJ2ZXIiOiI4LjE0LjAiLCJhZHIiOlsiMTAuMC4yLjI6OTIwMCJdLCJmZ3IiOiI4ZGE1MWZkYTExZmM1ZDAwNDBhZWZlNTJlNmRiYzQ5ZTM2NmYxYTkyOGIwY2NiMzExOGY0MWFjZTczODNkZDliIiwia2V5IjoiOGFfc1BKZ0Jra09qNlh6dngycS06bG5sWkNEMnpSbFNiZjZZclpRSHF6dyJ9
elastic user with the password that was generated when you started Elasticsearch.Recommended Configuration Order: This section describes how to enable HTTPS for Kibana's server interface. You can configure TLS either before or after enrollment, but note that:
Official Documentation: For comprehensive TLS configuration details, see Elastic's Kibana security documentation and Encrypt communications in Kibana.
Note: For single cluster with multiple nodes, run the following commands on a master-eligible node server.
Open an elevated PowerShell window in C:\elastic\elasticsearch-x.x.x\bin.
Create CA by running the following command:
.\elasticsearch-certutil.bat ca --silent --pem --out "C:\elastic\secrets\kibana_ca.zip"
Extract zip contents into C:\elastic\secrets\ca\ (you should have ca.crt and ca.key).
Create server cert for Kibana. Build SAN args with your DNS and IPs, e.g., --dns <fqdn> --dns <shortname> --ip <server-ip>, then run:
.\elasticsearch-certutil.bat cert --silent --pem --ca-cert "C:\elastic\secrets\ca\ca.crt" --ca-key "C:\elastic\secrets\ca\ca.key" --name kibana [SAN args] --out "C:\elastic\secrets\kibana_server.zip"
Example with actual values:
.\elasticsearch-certutil.bat cert --silent --pem --ca-cert "C:\elastic\secrets\ca\ca.crt" --ca-key "C:\elastic\secrets\ca\ca.key" --name kibana --dns <fqdn> --dns <shortname> --ip <server-ip> --out "C:\elastic\secrets\kibana_server.zip"
Extract zip contents into C:\elastic\secrets\kibana\ to get kibana.crt and kibana.key.
Create C:\elastic\kibana-x.x.x\config\certs directory.
Copy the certificate files:
C:\elastic\secrets\kibana\kibana.crt -> C:\elastic\kibana-x.x.x\config\certs\kibana.crt
C:\elastic\secrets\kibana\kibana.key -> C:\elastic\kibana-x.x.x\config\certs\kibana.key
C:\elastic\secrets\ca\ca.crt -> C:\elastic\kibana-x.x.x\config\certs\ca.crt
Install CA to Windows trust (Local Machine Root) so browsers trust Kibana. Run mmc, add Certificates snap-in for Computer account, import ca.crt under Trusted Root Certification Authorities, or run:
certutil.exe -addstore -f Root "C:\elastic\kibana-x.x.x\config\certs\ca.crt"
Configure kibana.yml
Open C:\elastic\kibana-x.x.x\config\kibana.yml and set:
server.host: "<bind address>"  # Use the specific interface or hostname; avoid 0.0.0.0 unless required
server.port: 5601
server.publicBaseUrl: "https://your.kibana.host:5601"
server.ssl.enabled: true
server.ssl.certificate: "C:/elastic/kibana/config/certs/kibana.crt"
server.ssl.key: "C:/elastic/kibana/config/certs/kibana.key"
Use forward slashes in paths (C:/...) to avoid YAML escape issues.
Official Documentation: For encryption key details, see Elastic's Kibana encryption keys documentation.
Important: Skipping the steps below will cause the Relativity Server CLI to fail.
Open an elevated PowerShell window, navigate to the Kibana bin folder (e.g., C:\elastic\kibana-x.x.x\bin), and run the following command:
.\kibana-encryption-keys generate
If successful, you will see output showing the generated encryption keys. For example:
xpack.encryptedSavedObjects.encryptionKey: "<randomly-generated-key-1>"
xpack.reporting.encryptionKey: "<randomly-generated-key-2>"
xpack.security.encryptionKey: "<randomly-generated-key-3>"
Store encryption keys securely (production)
Do NOT paste encryption keys or other secrets into kibana.yml in production or commit them to source control. Use the kibana-keystore (recommended) or an external secrets manager.
Example (elevated PowerShell) to add the generated keys to the Kibana keystore:
cd C:\elastic\kibana-x.x.x\bin

# Create the keystore if it doesn't exist
.\kibana-keystore.bat create

# Add encryption keys (interactive)
.\kibana-keystore.bat add xpack.encryptedSavedObjects.encryptionKey
.\kibana-keystore.bat add xpack.reporting.encryptionKey
.\kibana-keystore.bat add xpack.security.encryptionKey

# Or add non-interactively (stdin)
Write-Output '<randomly-generated-key-1>' | .\kibana-keystore.bat add xpack.encryptedSavedObjects.encryptionKey --stdin
Write-Output '<randomly-generated-key-2>' | .\kibana-keystore.bat add xpack.reporting.encryptionKey --stdin
Write-Output '<randomly-generated-key-3>' | .\kibana-keystore.bat add xpack.security.encryptionKey --stdin
After adding secrets, restart Kibana so it reads the keystore.
Verify that the keystore file has restrictive ACLs so only the Kibana service account can read it.
Restart Kibana by opening an elevated PowerShell, navigating to the Kibana bin folder (e.g., C:\elastic\kibana-x.x.x\bin), and running the following command:
.\kibana.bat
To verify success, check the terminal output for lines indicating that Kibana has started successfully.
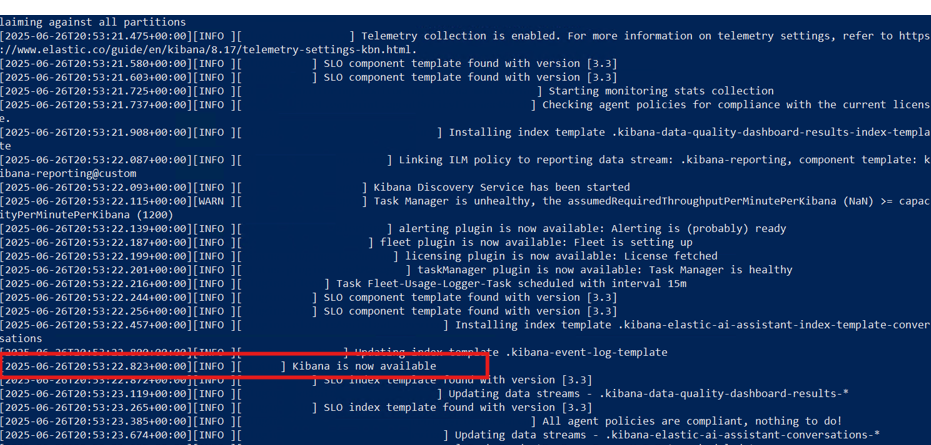
After Kibana has restarted, open a browser and go to https://<hostname_or_ip>:5601.
Log in using the elastic username and the password you generated earlier. This verifies that Kibana is running and your credentials are working.
For more details, refer to the official documentation.
Warning: This method is only suitable for development environments. For production, always use the keystore method above.
Open C:\elastic\kibana-x.x.x\config\kibana.yml and add the following lines with your generated keys:
xpack.encryptedSavedObjects.encryptionKey: "<randomly-generated-key-1>"
xpack.reporting.encryptionKey: "<randomly-generated-key-2>"
xpack.security.encryptionKey: "<randomly-generated-key-3>"
Note: These settings are optional and disabled by default. Configure only if needed for your environment.
Navigate to the Kibana configuration folder (e.g., C:\elastic\kibana-x.x.x\config) and open the kibana.yml file.
Add the following settings as needed:
# Disable Cross-Cluster Search in Stack Monitoring UI
# Set to false if you don't need to monitor remote clusters from this Kibana instance
monitoring.ui.ccs.enabled: false

# Disable deprecated role-based access control for reporting
# Recommended: Use Kibana privileges instead of roles for reporting access
xpack.reporting.roles.enabled: false
Save the changes and restart the Kibana service.
Setting Details:
monitoring.ui.ccs.enabled: false: Disables Cross-Cluster Search for the Stack Monitoring UI. Set this to false if you are not using a multi-cluster setup or do not need to monitor remote clusters from this Kibana instance.
xpack.reporting.roles.enabled: false: Disables the deprecated role-based access control for Kibana reporting. When set to false, reporting access is controlled through Kibana privileges instead of the legacy reporting_user role. This is the recommended setting for Elastic Stack 8.x and later.
Environment Watch does NOT require Kibana to run as a Windows service, nor does it require the use of Relativity Windows Service Manager (RWSM). RWSM helps run applications as Windows services, but it is not mandatory. You can run Kibana manually from the command line if you prefer, and this will work perfectly for development and most production scenarios.
Only use RWSM if you want Kibana to start automatically as a service on Windows. If you do not wish to use RWSM, simply run kibana.bat manually:
C:\elastic\kibana-x.x.x\bin\kibana.bat
Download and extract the Relativity Windows Service Manager (RWSM) NuGet package:
Open a browser and navigate to the following URL to download the package:
https://relativitypackageseastus.jfrog.io/artifactory/api/nuget/server-nuget-virtual/Download/Relativity.Windows.ServiceManager/2.24.0
After downloading, unblock the file before use. See How to Unblock Downloaded Files.
Once downloaded, the package file is named Relativity.Windows.ServiceManager.2.24.0.nupkg. Rename it to .zip using File Explorer:
Relativity.Windows.ServiceManager.2.24.0.nupkg and select Rename..nupkg to .zip so the file is named Relativity.Windows.ServiceManager.2.24.0.zip.Extract the Relativity.Windows.ServiceManager.2.24.0.zip file to the C:\elastic folder using File Explorer:
rwsm in C:\elastic.Relativity.Windows.ServiceManager.2.24.0.zip and select Extract All.C:\elastic\rwsm and click Extract.Navigate to C:\elastic\rwsm\tools\ and extract the inner package:
tools folder and select Extract All.C:\elastic\rwsm\tools\ and click Extract.C:\elastic\rwsm\tools\rwsm-2.24.0\.C:\elastic\rwsm\tools\rwsm-2.24.0\win64\rwsm.exe.Kibana does not install as a Windows service by default. We recommend using Relativity Windows Service Manager (RWSM) to run Kibana as a Windows service.
Open an elevated PowerShell window, navigate to C:\elastic\rwsm\tools\rwsm-2.24.0\win64, and run the following command:
.\rwsm.exe install kibana
This will open a popup to create a Windows service for Kibana.
In the Application tab:
C:\elastic\kibana-x.x.x\bin\kibana.bat
C:\elastic\kibana-x.x.x\bin
Editing Kibana Service Properties:
If you accidentally install the Kibana service before completing your configuration (for example, by pressing Return too early in the RWSM dialog), you can easily edit the service properties afterward. This allows you to update the application path, log file settings, or other options without reinstalling the service.
Open an elevated PowerShell window, navigate to C:\elastic\rwsm\tools\rwsm-2.24.0\win64, and run the following command:
.\rwsm.exe edit kibana
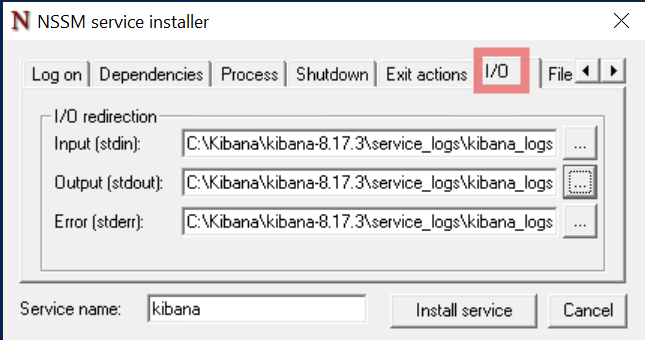
In the I/O tab, configure log file storage:
C:\elastic\kibana-x.x.x\service_logsC:\elastic\kibana-x.x.x\service_logs\kibana_service.logCopy the full log file path into the stdout, stderr, and stdin sections.
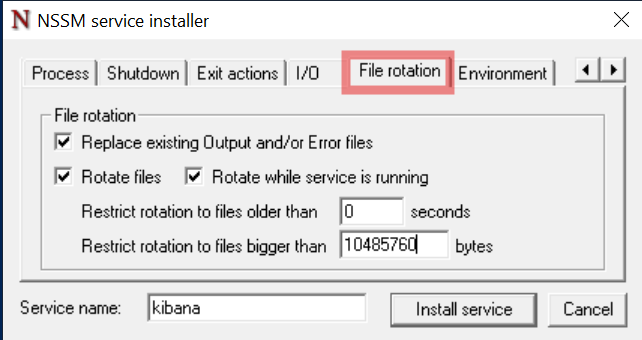
In the File rotation tab, check all boxes. In the Restrict rotation to files bigger than field, enter 10485760 bytes so a new log file is generated for every 10 MB of logs.
Click the Install service button to create the Windows service for Kibana.
Service account (recommended)
Create a dedicated, least-privilege Windows service account (for example: svc_kibana). Do not run Kibana under LocalSystem in production.
In RWSM, you can set the account under the Log On tab in the GUI after installing the service, or via command.
Open an elevated PowerShell window, navigate to C:\elastic\rwsm\tools\rwsm-2.24.0\win64, and run the following command:
.\rwsm.exe set kibana ObjectName "DOMAIN\svc_kibana" "<service-account-password>"
Verify that the service account has read access to Kibana installation, config, certs and the kibana keystore, and only those privileges required.
Go to the Services app in Windows, search for the kibana service, right click, and start the service.
The service startup type is set to Automatic by default. If Kibana does not start automatically on system startup, right-click the service, open Properties, and confirm the startup type is set to Automatic.
It is normal for Kibana to take 1-5 minutes to become accessible after starting the service, depending on your system. Please be patient while it starts up.
https://<hostname_or_ip>:5601.elastic username and the password you generated earlier.Note: This section is only required if you configured a multi-cluster architecture as described in the Multi-Cluster Configuration section. Skip this section if you are running a single cluster.
After both clusters are running and Kibana is configured, you can register the remote cluster connection to enable Cross-Cluster Search (CCS) or Cross-Cluster Replication (CCR).
Elasticsearch supports two modes for remote cluster connections:
Sniff mode (default, shown below): Discovers all eligible nodes in the remote cluster
Proxy mode: Connects through specific gateway nodes
"mode": "proxy" to the remote cluster settingsremote_cluster_client roleNetwork Requirements:
Register remote cluster connection from the primary cluster:
Open Kibana and navigate to Dev Tools (Management > Dev Tools), then run the following command to register the audit cluster:
Sniff mode (default):
PUT _cluster/settings
{
  "persistent": {
    "cluster": {
      "remote": {
        "audit-cluster": {
          "seeds": ["<secondary-node-01-ip>:9300", "<secondary-node-02-ip>:9300", "<secondary-node-03-ip>:9300"]
        }
      }
    }
  }
}
Proxy mode (for segmented networks):
PUT _cluster/settings
{
  "persistent": {
    "cluster": {
      "remote": {
        "audit-cluster": {
          "mode": "proxy",
          "proxy_address": "<gateway-node-ip>:9300"
        }
      }
    }
  }
}
Note: Replace audit-cluster with your desired cluster alias and update the seed host addresses to match your audit cluster node IPs.
Verify remote cluster connectivity:
You should see the audit cluster listed with connection status. Example response:
{
  "audit-cluster": {
    "connected": true,
    "mode": "sniff",
    "seeds": ["<secondary-node-01-ip>:9300", "<secondary-node-02-ip>:9300", "<secondary-node-03-ip>:9300"],
    "num_nodes_connected": 3,
    "max_connections_per_cluster": 3,
    "initial_connect_timeout": "30s"
  }
}
Test Cross-Cluster Search (Optional):
Once registered, you can query indices in the remote cluster using the cluster alias prefix:
GET audit-cluster:*/_search
{
  "query": {
    "match_all": {}
  }
}
