


Feedback
Kibana Troubleshooting
This document provides troubleshooting guidance for common Kibana issues encountered during installation, configuration, and operation in Relativity environments.
This guide assumes a default Kibana installation path of C:\elastic\kibana. Adjust paths according to your actual installation directory.
Windows service issues
The following troubleshooting steps apply only if Kibana was set up as a Windows service (e.g., using NSSM or a similar tool). If you did not install Kibana as a Windows service, you must ensure that kibana.bat is running in a command prompt or as a scheduled task.
Kibana service not starting
Symptoms:
- Kibana service fails to start
- Service stops immediately after starting
Troubleshooting Steps:
-
Check Service Status and Configuration:
CopyGet-Service -Name kibanaExpected output:
CopyStatus Name DisplayName
------ ---- -----------
Running kibana KibanaCopyGet-CimInstance -ClassName Win32_Service -Filter "Name='kibana'" | Select-Object Name, State, StartMode, StartName -
Verify the service is running under Local System account (default configuration).
-
Check Kibana Logs:
- Navigate to
C:\elastic\kibana\logs\ - Review the latest log files (
kibana.log) for error messages. - Look for configuration errors or Elasticsearch connection issues (for example:
Unable to connect to Elasticsearch at https://<host or ip address>:9200).
- Navigate to
-
Start Service Manually:
CopyStart-Service kibanaExpected output
Copy(No output if successful. Service status will be "Running" after execution.)
Service crashes or stops unexpectedly
Symptoms:
- Kibana service starts but stops after a short period
- Service status shows "Stopped" unexpectedly
- Users lose access to Kibana interface
Troubleshooting Steps:
-
Check Kibana Logs:
- Navigate to
C:\elastic\kibana\logs\ - Review the latest log files (
kibana.log) for crash details - Look for memory issues or connection failures
- Navigate to
-
Review Kibana Configuration:
- Check
C:\elastic\kibana\config\kibana.ymlfile - Verify Elasticsearch connection settings
- Ensure all required configuration parameters are present
- Check
-
Verify Elasticsearch Connectivity:
Copycurl.exe -k -u <username>:<password> -X GET "https://<hostname_or_ip>:9200/"Expected output:
Copy{
"name" : "EMTTEST",
"cluster_name" : "elasticsearch",
"cluster_uuid" : "PwBZoINKQjGZ53WH4gFfBg",
"version" : {
"number" : "8.17.3",
"build_flavor" : "default",
"build_type" : "zip",
"build_hash" : "a091390de485bd4b127884f7e565c0cad59b10d2",
"build_date" : "2025-02-28T10:07:26.089129809Z",
"build_snapshot" : false,
"lucene_version" : "9.12.0",
"minimum_wire_compatibility_version" : "7.17.0",
"minimum_index_compatibility_version" : "7.0.0"
},
"tagline" : "You Know, for Search"
} -
Check Memory Usage:
- Monitor Kibana process memory consumption using Task Manager or Resource Monitor.
- Verify sufficient system memory is available.
Authentication issues
Username/Password authentication issues
Symptoms:
- Login failures at Kibana interface
- "Invalid username or password" errors
- Users cannot access Kibana dashboards
Troubleshooting Steps:
-
Verify User Configuration:
- Ask the user to log in using the
elasticusername credentials. - Check
C:\elastic\kibana\config\kibana.yml:Copyelasticsearch.username: "<username>"
elasticsearch.password: "<password>"
- Ask the user to log in using the
-
Test Elasticsearch Credentials Independently:
For port-related issues, see the Port Configuration Troubleshooting guide.
Memory issues
Insufficient memory allocation
Symptoms:
- Kibana becomes unresponsive
- Slow loading of dashboards and visualizations
- Out of memory errors in logs
Troubleshooting Steps:
-
Check Current Memory Usage:
CopyGet-Process -Name node | Where-Object {$_.ProcessName -eq "node"} | Select-Object WorkingSet, VirtualMemorySizeExpected output:
CopyWorkingSet VirtualMemorySize
---------- ----------------
12345678 23456789 -
Review Out of Memory Errors in Logs:
- Review Out of Memory Errors in Logs:
- Check for "out of memory" or "heap" errors in
C:\elastic\kibana\logs\kibana.log.
- Check for "out of memory" or "heap" errors in
Out of memory errors typically indicate insufficient system memory or improper Node.js heap settings. Review the error details in the log for specific causes and recommended actions.
- Verify Disk Space:
- Insufficient disk space can also cause memory-related failures.
- For disk space troubleshooting steps, see Verify Disk Space.
Kibana encryption keys configuration
Missing or invalid encryption keys
Symptoms:
- Kibana fails to start with encryption-related errors
- "Saved objects encryption key is missing" warnings
- Unable to save or retrieve saved objects
Troubleshooting Steps:
-
Generate Encryption Keys:
Copycd C:\elastic\kibana\bin
.\kibana-encryption-keys.bat generateExpected output:
Copyxpack.encryptedSavedObjects.encryptionKey: "<randomly-generated-key-1>"
xpack.reporting.encryptionKey: "<randomly-generated-key-2>"
xpack.security.encryptionKey: "<randomly-generated-key-3>" -
Configure Required Encryption Keys in kibana.yml:
- Copy the generated lines above and paste them into your
C:\elastic\kibana\config\kibana.ymlfile.
- Copy the generated lines above and paste them into your
Service verification
Verifying Kibana health and status
Symptoms:
- Need to confirm Kibana is operating correctly
- Performance monitoring requirements
- Health check automation
Troubleshooting Steps:
-
Check Kibana Status:
Copycurl.exe -k -u <username>:<password> -X GET "http://<hostname_or_ip>:5601/api/status"Expected output:
Copy{
"name": "kibana",
"version": {
"number": "8.x.x"
},
"status": {
"overall": {
"level": "available"
}
}
}
Additional diagnostic commands
Configuration validation
-
Validate YAML syntax
CopyC:\elastic\kibana\bin\kibana.batExpected output:
Copy# There is no built-in --validate-config option in Kibana 8.x.
# Configuration is validated when Kibana starts.
# If there are errors in kibana.yml, they will be shown in the console output and Kibana will fail to start.
Installation issues
Long path issues during extraction
Symptoms:
- Errors when extracting the
kibana-8.xx.x-windows-x86_64.zipfile. - The extraction process fails due to file paths exceeding the Windows default limit.
Troubleshooting Steps:
-
Enable Long Paths in Windows: Windows must be configured to support long file paths. This can be enabled via the Local Group Policy Editor.
-
Run
gpedit.mscto open the Local Group Policy Editor.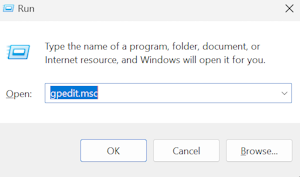
-
Navigate to
Computer Configuration|Administrative Templates|System|Filesystem.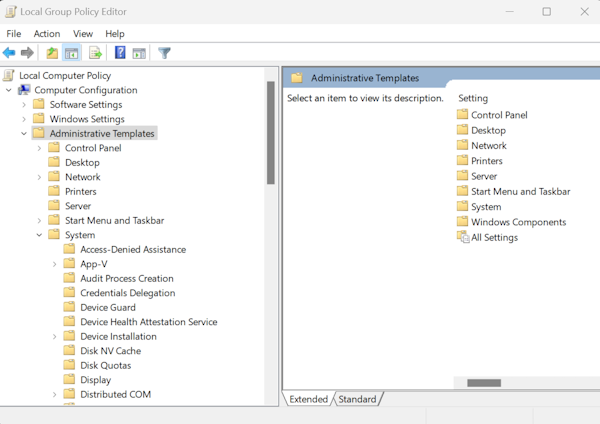
-
Double-click on
Enable Win32 long pathsand set it to Enabled.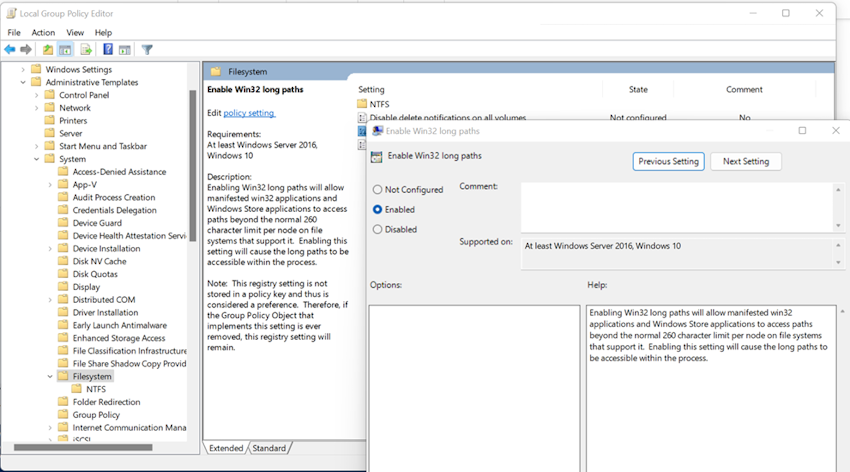
-
-
Re-extract the Kibana zip file:
- After enabling long path support, attempt to extract the
kibana-8.xx.x-windows-x86_64.zipfile again.
- After enabling long path support, attempt to extract the