


Feedback
Pre-requisite Troubleshooting
This document provides troubleshooting steps for common pre-requisites like port configuration and Secret Store access.
Port Configuration Troubleshooting
Default Port Reference
The following table summarizes the default ports used by the Elastic Stack and Environment Watch components.
| Component | Port | Protocol | Inbound | Outbound | Purpose |
|---|---|---|---|---|---|
| Elasticsearch | 9200 | HTTP/HTTPS | ✅ | Client communication and REST API | |
| 9300 | TCP | ✅ | ✅ | Inter-node communication | |
| Kibana | 5601 | HTTP/HTTPS | ✅ | Kibana web interface | |
| APM Server | 8200 | HTTP/HTTPS | ✅ | APM agent data ingestion | |
| OTEL Collector | 4318 | HTTP | OTLP data reception (HTTP) for local traffic (localhost). This deployment uses the agent model, with a collector on each server. See the OpenTelemetry agent documentation for more details. |
Elasticsearch Port Issues
Symptoms:
- Elasticsearch fails to bind to default ports.
- "Address already in use" errors in logs.
- Cannot access Elasticsearch via HTTP/HTTPS.
Troubleshooting Steps:
-
Check if Ports are in use: Verify that ports 9200 and 9300 are listening.
Copynetstat -an | findstr ":9200"
netstat -an | findstr ":9300"Expected output:
CopyTCP 0.0.0.0:9200 0.0.0.0:0 LISTENING
TCP 0.0.0.0:9300 0.0.0.0:0 LISTENING -
Identify Conflicting Processes. If a port is in use by another application, identify the process.
CopyGet-NetTCPConnection -LocalPort 9200 -State Listen
Get-NetTCPConnection -LocalPort 9300 -State Listen -
Test Elasticsearch Connectivity:
Copycurl.exe -k -u <username>:<password> -X GET "https://<hostname_or_ip>:9200/" -
Verify Network Binding: Check
C:\elastic\elasticsearch\config\elasticsearch.ymlconfiguration:Copynetwork.host: 0.0.0.0 # For all interfaces
Kibana Port Issues
Symptoms:
- Kibana fails to bind to the default port.
- "EADDRINUSE" errors in logs.
- Cannot access Kibana web interface.
Troubleshooting Steps:
-
Check if Port is in Use:
Copynetstat -an | findstr ":5601"Expected output:
CopyTCP 0.0.0.0:5601 0.0.0.0:0 LISTENING -
Test Kibana Connectivity:
Copy(curl.exe -s -k -u <username>:<password> -X GET "http://<hostname_or_ip>:5601/api/status" | ConvertFrom-Json).status.overall | ConvertTo-Json -Depth 10 -
Verify Network Binding. Check
C:\elastic\kibana\config\kibana.ymlconfiguration:Copyserver.host: "0.0.0.0" # For all interfaces
APM Server Port Issues
Symptoms:
- APM Server fails to bind to the default port.
- "Address already in use" errors in logs.
- APM agents cannot connect to the server.
Troubleshooting Steps:
-
Check if Port is in Use:
Copynetstat -an | findstr ":8200"Expected output:
CopyTCP 0.0.0.0:8200 0.0.0.0:0 LISTENING -
Test APM Server Connectivity:
Copycurl.exe -k "http://<hostname_or_ip>:8200/"Expected output:
Copy{
"build_date": "...",
"build_sha": "...",
"publish_ready": true,
"version": "8.17.3"
} -
Verify Network Binding. Check
C:\elastic\apm-server\apm-server.ymlconfiguration:Copyhost: "0.0.0.0:8200"
OpenTelemetry Collector Port Issues
Symptoms:
- The
otelcol-relativity.exeprocess is running, but no data is being sent. - Port 4318 is not in a listening state.
Troubleshooting Steps:
-
Check if Port is in Use. This port is used by the OpenTelemetry Collector to receive data. The
Relativity Environment Watchservice must be running.Copynetstat -an | findstr ":4318"Expected output:
CopyTCP 0.0.0.0:4318 0.0.0.0:0 LISTENINGYou can also use
Get-NetTCPConnection:CopyGet-NetTCPConnection -LocalPort 4318 -State Listen
General Port Troubleshooting
Firewall Rules
Ensure that Windows Firewall or any other network security software is not blocking the required ports. You may need to create inbound rules to allow traffic on these ports.
Example for Kibana (port 5601):
Copy
New-NetFirewallRule -DisplayName "Kibana Web Interface" -Direction Inbound -Protocol TCP -LocalPort 5601 -Action Allow
Network Connectivity
Use Test-NetConnection to verify that a remote server can reach the port.
Copy
Test-NetConnection -ComputerName <hostname_or_ip> -Port <port_number>
Expected output:
Copy
ComputerName     : <hostname_or_ip>
RemoteAddress    : <ip>
RemotePort       : <port_number>
TcpTestSucceeded : True
Secret Store Troubleshooting
Secret Store Access Verification
Network Connectivity Test
Verify that the Secret Store host is reachable on port 443.
Copy
Test-NetConnection -ComputerName <hostname_or_ip> -Port 443
Expected output:
Copy
ComputerName     : <hostname_or_ip>
RemoteAddress    : <ip>
RemotePort       : 443
TcpTestSucceeded : True
API Access Test
-
Open an elevated PowerShell and run the following command to list secrets and retrieve connection details:
CopyC:\Program Files\Relativity Secret Store\Client\secretstore.exe secret list /The output will look similar to:
CopySecret Store URL: https://<hostname_or_ip>:9090/
Client Certificate Thumbprint: 20F8F2516EC86EBF993075F64B0C6EA6777A4F83 -
Copy the Client Certificate Thumbprint and Secret Store URL from the output.
Seal Status Check
To check the seal status of the Secret Store, run the following script in an elevated PowerShell ISE.
- Replace
<insert-secret-store-client-certificate-thumbprint-here>with the thumbprint you copied. - Replace
<insert-secret-store-url-here>with the URL you copied.
Copy
$thumbprint = "<insert-secret-store-client-certificate-thumbprint-here>"
$url = "<insert-secret-store-url-here>"

# Find the client certificate
$store = New-Object System.Security.Cryptography.X509Certificates.X509Store("My", "LocalMachine")
$store.Open("ReadOnly")
$cert = $store.Certificates | Where-Object { $_.Thumbprint -eq $thumbprint }

if (-not $cert) {
    Write-Error "Certificate with thumbprint $thumbprint not found."
    return
}

# Check the seal status
$response = Invoke-RestMethod -Uri "$url/v1/sys/seal-status" -Certificate $cert
$response | ConvertTo-Json
Expected output (for a healthy, unsealed store):
Copy
{
    "type": "shamir",
    "initialized": true,
    "sealed": false,
    "t": 3,
    "n": 5,
    "progress": 0,
    "nonce": "",
    "version": "1.6.2",
    "migration": false,
    "cluster_name": "secret-store",
    "cluster_id": "...",
    "recovery_seal": false,
    "storage_type": "raft"
}
Certificate Troubleshooting
SSL/TLS Certificate Issues
Symptoms:
- SSL handshake failures
- "certificate verify failed" errors
- Unable to establish secure connections
- Browser shows "not secure" warning for Elasticsearch URL
Troubleshooting Steps:
-
Verify Secure URL
- The master node domain name URL should be secure for Elasticsearch node servers, agent servers, and web servers.
- The data node domain name URL should be secured for Elasticsearch node servers.
-
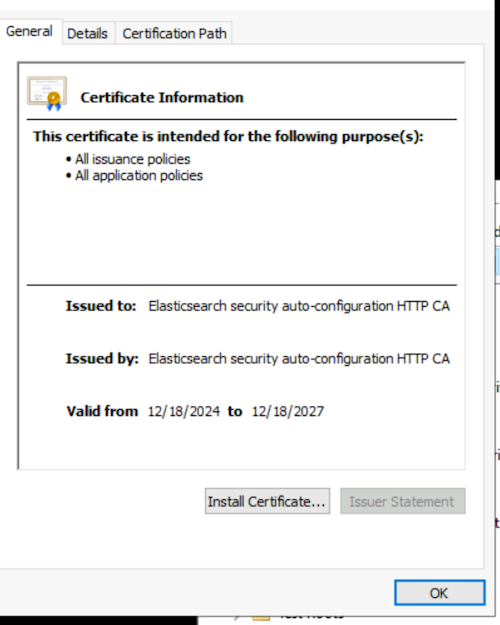
Install SSL Certificate in Trusted Store
If your browser shows a "not secure" warning when accessing the Elasticsearch URL, you may need to install the certificate into your trusted store.
-
In your browser, view the certificate details and export the root certificate authority (CA) certificate. Save it to a local directory.
-
Double-click the downloaded certificate file and click Install Certificate.
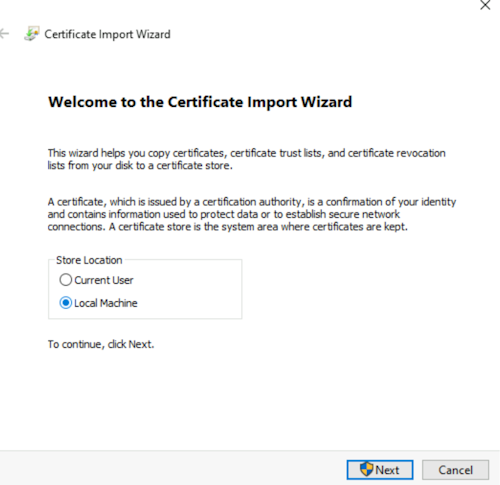
-
Select Local Machine and click Next.
-
Select Place all certificates in the following store, click Browse, and select Trusted Root Certification Authorities. Click OK, then Next, and Finish.
-
To confirm, open the Microsoft Management Console (MMC):
- Run
mmc.exe. - Go to File > Add/Remove Snap-in....
- Select Certificates and click Add.
Copy
 - Run
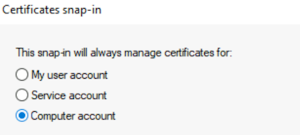
-
Choose Computer account and click Next, then Finish, and OK.
-
Expand Certificates (Local Computer) > Trusted Root Certification Authorities > Certificates and verify your certificate is listed.
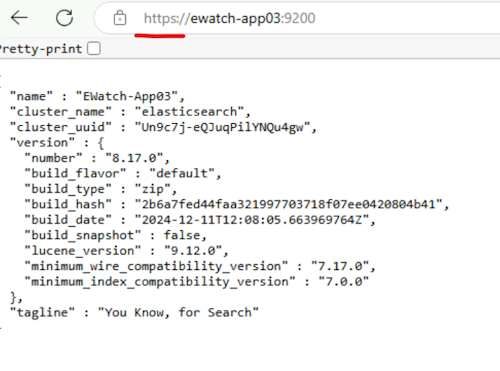
-
Close your browser and reopen the Elasticsearch URL. It should now show as secure.
-
-
Verify Certificate Path in
elasticsearch.yml.-
Ensure the
elasticsearch.ymlfile points to the correct certificate files. -
Check
C:\elastic\elasticsearch\config\elasticsearch.yml:Copyxpack.security.transport.ssl:
keystore.path: certs/transport.p12
truststore.path: certs/transport.p12
-
-
Check Elasticsearch Logs for SSL Errors
- Navigate to
C:\elastic\elasticsearch\logs\. - Review the
elasticsearch.logfile for any SSL-related errors. - For every error in the Elasticsearch log, provide troubleshooting for that specific error.
- Navigate to
TLS Version Mismatch
Symptoms:
- Connection Failure: During installation of Environment Watch Installer, an error pop-up may appear with a message like:
The HTTP request submitted to the server
https://<hostname>:9200/failed because of an unexpected error. Verify the server is accessible and URL is correct. Check the logs for more details or refer to the following troubleshooting guide. - Log Errors: Logs on the application's server indicate a failure to establish a secure connection or mention outdated TLS versions (like TLSv1.0 or TLSv1.1).
- "SSLHandshakeException: client requested protocol TLSv1 is not enabled or supported in server context"
Cause: The machine's .NET Framework is not configured to use strong cryptography, preventing it from negotiating a secure connection with modern servers that require TLS 1.2 or higher. By default, some .NET applications may attempt to use older, insecure TLS versions. Default TLS version supported by Elasticsearch is TLSv1.2 and TLSv1.3, hence causing issue
Troubleshooting Steps:
To resolve this, the .NET Framework on the machine must be configured to use the system's default security protocols, which allows it to use newer versions like TLS 1.2/1.3.
-
Verify TLS Settings:
- Navigate to Control Panel > Network and Internet > Internet Options > Advanced, ensure that Use TLS 1.2 and Use TLS 1.3 are checked.
-
Open Registry Editor:
- Press
Win + R, typeregedit, and press Enter.
- Press
-
Navigate to .NET Framework Registry Keys: A new value will need to be added in two locations.
-
Create the
SchUseStrongCryptoValue:- In each of the keys mentioned above, right-click in the right-hand pane and select New > DWORD (32-bit) Value.
- Name the new value
SchUseStrongCrypto. - Double-click the new value and set its Value data to
1. Click OK.
This registry key forces .NET 4.x applications to use strong cryptography, enabling support for newer TLS versions.
-
Reboot the System. A system reboot is required for the changes to take effect.
-
Verify the Fix:
- After rebooting, re-run the Environment Watch installer or restart the application. The connection to Elasticsearch should now succeed.