


Feedback
Install Environment Watch Monitoring Agents
This step is required for Environment Watch. The Environment Watch monitoring agent installation should start on the SQL Primary server, verify the installation, and then be applied to other servers in the environment. This ensures proper setup and validation before deploying across all servers.
This document outlines the steps to install the Environment Watch monitoring agent.
Prerequisites
- Elastic Stack Certificates are installed on all Servers
- Access to Elastic Stack, Primary SQL Server, and Secret Store (Whitelisted for Secret Store access. Please see here for information on whitelisting.)
- The Server-bundle zip file has been downloaded and extracted to `C:\Server.Bundle.x.y.z'
- Environment Watch has been set up using the Relativity Server CLI
- The Environment Watch monitoring agent must be installed on a supported Windows Server OS including Windows Server 2022, Windows Server 2019, Windows Server 2016. Please see here for information on Windows Server compatibility for Relativity Server.
Steps
-
Install the Monitoring Agent
-
From the extracted Server Bundle, run
Relativity.EnvironmentWatch.Installer.xx.x.xxxx.exe. -
If prompted, enter the Relativity Service Account credentials as:
- Username:
domain\Username - Password:
This step may be skipped if other Relativity products are already installed.
- Username:
-
(Optional) To specify a custom installation path, click Options, browse to your desired directory, and click OK.
-
Accept the license terms and click Install.
-
Once the installation is complete, click Close.
-
-
Verify the Installation
- Open Services and confirm the Relativity Environment Watch service is running.
- Open Task Manager and verify the following processes are running:
rel-envwatch-service.exerel-infrawatch-agent.exeotelcol-relativity.exe
- Check for new log files in
C:\ProgramData\Relativity\EnvironmentWatch\Services\InfraWatchAgent\Logs. - Verify that the
otelcol-config-auto-generated.yamlconfiguration file is generated in:C:\ProgramData\Relativity\EnvironmentWatch\Services\InfraWatchAgent\
-
Verify Metrics in Kibana
-
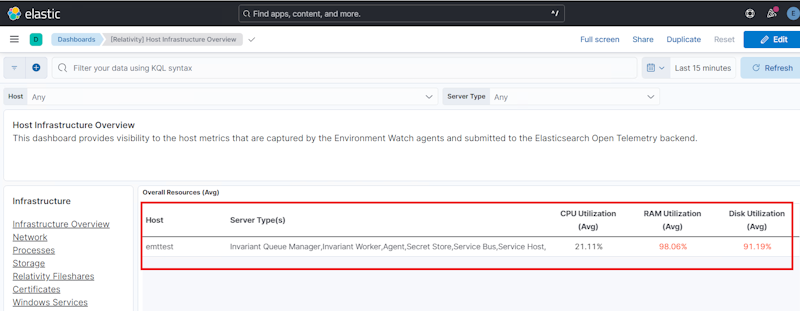
In Kibana, navigate to Dashboards and open the [Relativity] Host Infrastructure Overview dashboard.
-
Confirm that CPU, RAM, and Disk metrics are visible for the newly added host.
-
Navigate to the [Relativity] Monitoring Agent dashboard to verify that:
- The installed monitoring agent version is displayed correctly
- Host information and other important fields are properly reflected
- Agent status and health metrics are showing current data
-
-
Repeat Installation After verifying the first installation, repeat these steps for the remaining servers in the following order:
- SQL Distributed Servers
- Web Servers
- Agent Servers
- Other Servers (e.g., File Share, Analytics, Worker)
For troubleshooting, refer to the installer logs in the %TEMP% directory or see the Monitoring Agent Troubleshooting Guide.