Feedback
IIS Log Field Configuration for Environment Watch
Overview
This document provides step-by-step instructions for configuring IIS log fields required for proper log ingestion by Environment Watch. Incorrect or incomplete IIS log field configuration can result in parsing errors, incomplete data, or ingestion failures.
The Environment Watch monitoring agent uses OpenTelemetry (OTEL) collectors to parse and ingest IIS logs. The configuration requires specific fields to be enabled in IIS logging to ensure successful data collection and analysis.
Prerequisites
- IIS installed on the Server
- Administrative access to the IIS Manager
- Environment Watch monitoring agent installed (see Install Environment Watch Monitoring Agents)
Terminology and Abbreviations
The following abbreviations are used throughout this document:
| Abbreviation | Description |
|---|---|
| IIS | Internet Information Services |
| OTEL | OpenTelemetry |
| HTTP | Hypertext Transfer Protocol |
| URI | Uniform Resource Identifier |
| IP | Internet Protocol |
| W3C | World Wide Web Consortium |
| Win32 | Windows API status code |
Required IIS Log Fields
The following fields must be enabled in your IIS log configuration for successful ingestion. These fields are configured in IIS Manager under W3C Logging Fields.
| Field Name | IIS Log Field | Description | Required |
|---|---|---|---|
date
|
date | Date when the log entry was created | Yes |
time
|
time | Time when the log entry was created | Yes |
s-ip
|
s-ip | Server IP address | Yes |
cs-method
|
cs-method | HTTP request method (GET, POST, etc.) | Yes |
cs-uri-stem
|
cs-uri-stem | URI stem (path) of the request | Yes |
cs-uri-query
|
cs-uri-query | Query string parameters | Yes |
s-port
|
s-port | Server port number | Yes |
cs-username
|
cs-username | Authenticated username | Yes |
c-ip
|
c-ip | Client IP address | Yes |
cs(User-Agent)
|
cs(User-Agent) | User agent string from the client | Yes |
cs(Referer)
|
cs(Referer) | Referer URL | Yes |
sc-status
|
sc-status | HTTP status code | Yes |
sc-substatus
|
sc-substatus | HTTP substatus code | Yes |
sc-win32-status
|
sc-win32-status | Windows status code | Yes |
time-taken
|
time-taken | Time taken to process the request (milliseconds) | Yes |
Configuration Steps
Step 1: Open IIS Manager
- Press Win + R to open the Run dialog
- Type
inetmgrand press Enter - The Internet Information Services (IIS) Manager will open
Step 2: Navigate to Logging Configuration
-
In the left-hand Connections pane, expand your server node
-
Select the Sites folder or a specific website you want to configure
-
In the center Features View pane, double-click Logging
You can configure logging at the server level (applies to all sites) or at the individual site level. For Environment Watch, configure at the server level to ensure consistent logging across all Relativity web applications.
Step 3: Configure Log File Format
- In the Logging configuration page, ensure the Format dropdown is set to W3C
- Click the Select Fields... button next to the Format dropdown
Step 4: Select Required Fields
-
In the W3C Logging Fields dialog, ensure the following fields are checked:
Standard Fields:
- ☑ date (Date)
- ☑ time (Time)
- ☑ s-ip (Server IP Address)
- ☑ cs-method (Method)
- ☑ cs-uri-stem (URI Stem)
- ☑ cs-uri-query (URI Query)
- ☑ s-port (Server Port)
- ☑ cs-username (User Name)
- ☑ c-ip (Client IP Address)
- ☑ sc-status (Protocol Status)
- ☑ sc-substatus (Protocol Substatus)
- ☑ sc-win32-status (Win32 Status)
- ☑ time-taken (Time Taken)
Custom Fields (expand the sections as needed):
- ☑ cs(User-Agent) - Located under "Request Headers"
- ☑ cs(Referer) - Located under "Request Headers"
-
Verify that all required fields are selected
-
Click OK to close the dialog
Step 5: Configure Log File Location (Optional)
-
Note the Directory path where IIS logs are stored (default:
%SystemDrive%\inetpub\logs\LogFiles) -
This path must match the
OTEL_IIS_FILE_LOG_PATHenvironment variable configured during monitoring agent installation -
If you need to change the log directory:
- Update the Directory field in IIS Manager
- Update the
OTEL_IIS_FILE_LOG_PATHenvironment variable to match - Restart the Relativity Environment Watch service
The default log path pattern should be:
C:\inetpub\logs\LogFiles\W3SVC*\*.log
Step 6: Apply Configuration
-
Click Apply in the Actions pane on the right
-
The changes will take effect immediately for new log entries
-
Existing log files will retain their previous format
You do not need to restart IIS for logging configuration changes to take effect. However, the new format will only apply to new log entries.
Step 7: Verify Log Format
-
Navigate to your IIS log directory (e.g.,
C:\inetpub\logs\LogFiles\W3SVC1\) -
Open the most recent log file with a text editor (e.g., Notepad)
-
Verify the
#Fields:header line matches the required format:Copy#Fields: date time s-ip cs-method cs-uri-stem cs-uri-query s-port cs-username c-ip cs(User-Agent) cs(Referer) sc-status sc-substatus sc-win32-status time-taken -
Verify that log entries contain all the required fields (example):
Copy2025-06-10 22:14:03 ::1 POST /Relativity/Identity/connect/token - 443 - ::1 - - 200 0 0 25951
OpenTelemetry Configuration Overview
The Environment Watch monitoring agent uses the following OTEL configuration to parse IIS logs. This configuration is automatically deployed during installation.
Configuration File Location:
Copy
C:\ProgramData\Relativity\EnvironmentWatch\Services\InfraWatchAgent\Templates\otelcol-config-rel-web.yaml
This is a template file used by the monitoring agent. Do not modify these files directly as they are managed by the Environment Watch service.
File Log Receiver Configuration
Copy
receivers:
  filelog/iis:
    include: "${env:OTEL_IIS_FILE_LOG_PATH}"
    include_file_name: true
    start_at: beginning
    operators:
      # Filter out comment lines starting with #
      - type: filter
        expr: 'body matches "^#"'
        drop: true
      # Parse log entries using regex
      - type: regex_parser
        regex: ^(?P<iis_log_date_time>\d{4}-\d{2}-\d{2} \d{2}:\d{2}:\d{2})\s+(?P<iis_log_hostname>\S+)\s+(?P<iis_log_http_request_method>\S+)\s+(?P<iis_log_http_target>\S+)\s+(?P<iis_log_http_query>\S*)\s+(?P<iis_log_http_server_port>\d+)\s+(?P<iis_log_end_username>\S*)\s+(?P<iis_log_http_client_address>\S+)\s+(?P<iis_log_cs_useragent>.*?)\s+(?P<iis_log_cs_referer>.*?)\s+(?P<iis_log_http_server_status>\d+)\s+(?P<iis_log_http_server_substatus>\d+)\s+(?P<iis_log_http_sc_win32_status>\d+)\s+(?P<iis_log_http_server_duration>\d+)
Understanding the Regex Pattern
The regex pattern above is designed to parse IIS log entries in W3C format. Here's a breakdown of each component:
Regex Components Explained
| Regex Component | Description | Matches | Example |
|---|---|---|---|
^
|
Start of line anchor | Beginning of the log entry | - |
(?P<name>pattern)
|
Named capture group | Creates a field with the specified name | - |
\d{4}-\d{2}-\d{2}
|
Date format | YYYY-MM-DD | 2025-06-10
|
\d{2}:\d{2}:\d{2}
|
Time format | HH:MM:SS | 22:14:03
|
\s+
|
One or more whitespace | Separates fields | Space or tab |
\S+
|
One or more non-whitespace | Required field value | POST, ::1 |
\S*
|
Zero or more non-whitespace | Optional field value (can be -) |
- or param=value |
.*?
|
Non-greedy match any character | User-Agent or Referer (may contain spaces) | Mozilla/5.0...
|
\d+
|
One or more digits | Numeric values | 443, 200, 25951 |
Field-by-Field Breakdown
Example log entry:
Copy
2025-06-10 22:14:03 ::1 POST /Relativity/Identity/connect/token - 443 - ::1 - - 200 0 0 25951
Regex pattern matched to fields:
-
Date and Time -
(?P<iis_log_date_time>\d{4}-\d{2}-\d{2} \d{2}:\d{2}:\d{2})- Pattern:
\d{4}-\d{2}-\d{2} \d{2}:\d{2}:\d{2} - Matches:
2025-06-10 22:14:03 - Explanation: Four digits (year), dash, two digits (month), dash, two digits (day), space, time in HH:MM:SS format
- Pattern:
-
Server IP -
(?P<iis_log_hostname>\S+)- Pattern:
\S+(one or more non-whitespace) - Matches:
::1(IPv6 localhost) - Explanation: Captures any non-whitespace characters (IP address or hostname)
- Pattern:
-
HTTP Method -
(?P<iis_log_http_request_method>\S+)- Pattern:
\S+ - Matches:
POST - Explanation: HTTP verb (GET, POST, PUT, DELETE, etc.)
- Pattern:
-
URI Stem -
(?P<iis_log_http_target>\S+)- Pattern:
\S+ - Matches:
/Relativity/Identity/connect/token - Explanation: The requested URL path without query parameters
- Pattern:
-
Query String -
(?P<iis_log_http_query>\S*)- Pattern:
\S*(zero or more non-whitespace) - Matches:
-(indicates no query string) - Explanation: Query parameters after
?in URL, or-if none
- Pattern:
-
Server Port -
(?P<iis_log_http_server_port>\d+)- Pattern:
\d+(one or more digits) - Matches:
443 - Explanation: Port number the server received the request on
- Pattern:
-
Username -
(?P<iis_log_end_username>\S*)- Pattern:
\S*(zero or more non-whitespace) - Matches:
-(indicates anonymous/no authentication) - Explanation: Authenticated username, or
-if not authenticated
- Pattern:
-
Client IP -
(?P<iis_log_http_client_address>\S+)- Pattern:
\S+ - Matches:
::1(IPv6 localhost) - Explanation: IP address of the client making the request
- Pattern:
-
User-Agent -
(?P<iis_log_cs_useragent>.*?)- Pattern:
.*?(non-greedy match any character) - Matches:
-(or full User-Agent string likeMozilla/5.0...) - Explanation: Browser/client identification string;
.*?allows spaces, stops at next whitespace boundary
- Pattern:
-
Referer -
(?P<iis_log_cs_referer>.*?)- Pattern:
.*?(non-greedy match any character) - Matches:
-(or full Referer URL) - Explanation: The page that linked to this request;
.*?allows spaces
- Pattern:
-
HTTP Status -
(?P<iis_log_http_server_status>\d+)- Pattern:
\d+ - Matches:
200 - Explanation: HTTP response status code (200, 404, 500, etc.)
- Pattern:
-
HTTP Substatus -
(?P<iis_log_http_server_substatus>\d+)- Pattern:
\d+ - Matches:
0 - Explanation: IIS-specific substatus code providing additional detail
- Pattern:
-
Win32 Status -
(?P<iis_log_http_sc_win32_status>\d+)- Pattern:
\d+ - Matches:
0 - Explanation: Windows system error code (0 = success)
- Pattern:
-
Time Taken -
(?P<iis_log_http_server_duration>\d+)- Pattern:
\d+ - Matches:
25951 - Explanation: Request processing time in milliseconds
- Pattern:
The regex pattern must match the exact field order in the IIS log #Fields: header. If fields are reordered or added/removed in IIS configuration, the regex will fail to parse correctly.
Field Mapping
The OTEL collector maps IIS log fields to the following internal field names:
| IIS Field | OTEL Field Name |
|---|---|
| date time | iis_log_date_time
|
| s-ip | iis_log_hostname
|
| cs-method | iis_log_http_request_method
|
| cs-uri-stem | iis_log_http_target
|
| cs-uri-query | iis_log_http_query
|
| s-port | iis_log_http_server_port
|
| cs-username | iis_log_end_username
|
| c-ip | iis_log_http_client_address
|
| cs(User-Agent) | iis_log_cs_useragent
|
| cs(Referer) | iis_log_cs_referer
|
| sc-status | iis_log_http_server_status
|
| sc-substatus | iis_log_http_server_substatus
|
| sc-win32-status | iis_log_http_sc_win32_status
|
| time-taken | iis_log_http_server_duration
|
Visual Parsing Example
Here's how the regex pattern maps to an actual IIS log entry:
Copy
Log Entry:
2025-06-10 22:14:03 ::1 POST /Relativity/Identity/connect/token - 443 - ::1 - - 200 0 0 25951

Field Mapping:
 2025-06-10 22:14:03          | iis_log_date_time
 ::1                           | iis_log_hostname
 POST                          | iis_log_http_request_method
 /Relativity/Identity/...      | iis_log_http_target
 -                             | iis_log_http_query (empty)
 443                           | iis_log_http_server_port
 -                             | iis_log_end_username (anonymous)
 ::1                           | iis_log_http_client_address
 -                             | iis_log_cs_useragent (empty)
 -                             | iis_log_cs_referer (empty)
 200                           | iis_log_http_server_status
 0                             | iis_log_http_server_substatus
 0                             | iis_log_http_sc_win32_status
└─ 25951                         | iis_log_http_server_duration (25.951 seconds)
Processors
The configuration includes a processor to convert the time-taken field to an integer type:
Copy
processors:
  attributes/iis_log_http_server_duration:
    actions:
      - key: iis_log_http_server_duration
        action: convert
        converted_type: int
Verification in Kibana
After configuring IIS logging and ensuring the Environment Watch monitoring agent is running, verify that logs are being ingested into Elasticsearch:
Step 1: Log into Kibana
- Open your web browser and navigate to Kibana (default:
https://<elasticsearch-host>:5601) - Log in with your Elasticsearch credentials
Step 2: Navigate to Discover
- Click on the Discover menu item in the left navigation panel
- Select data view logs-*
Step 3: Set the Time Range
- In the top right corner, click the time filter
- Select Last 15 minutes or Last 1 hour to view recent logs
- Click Apply
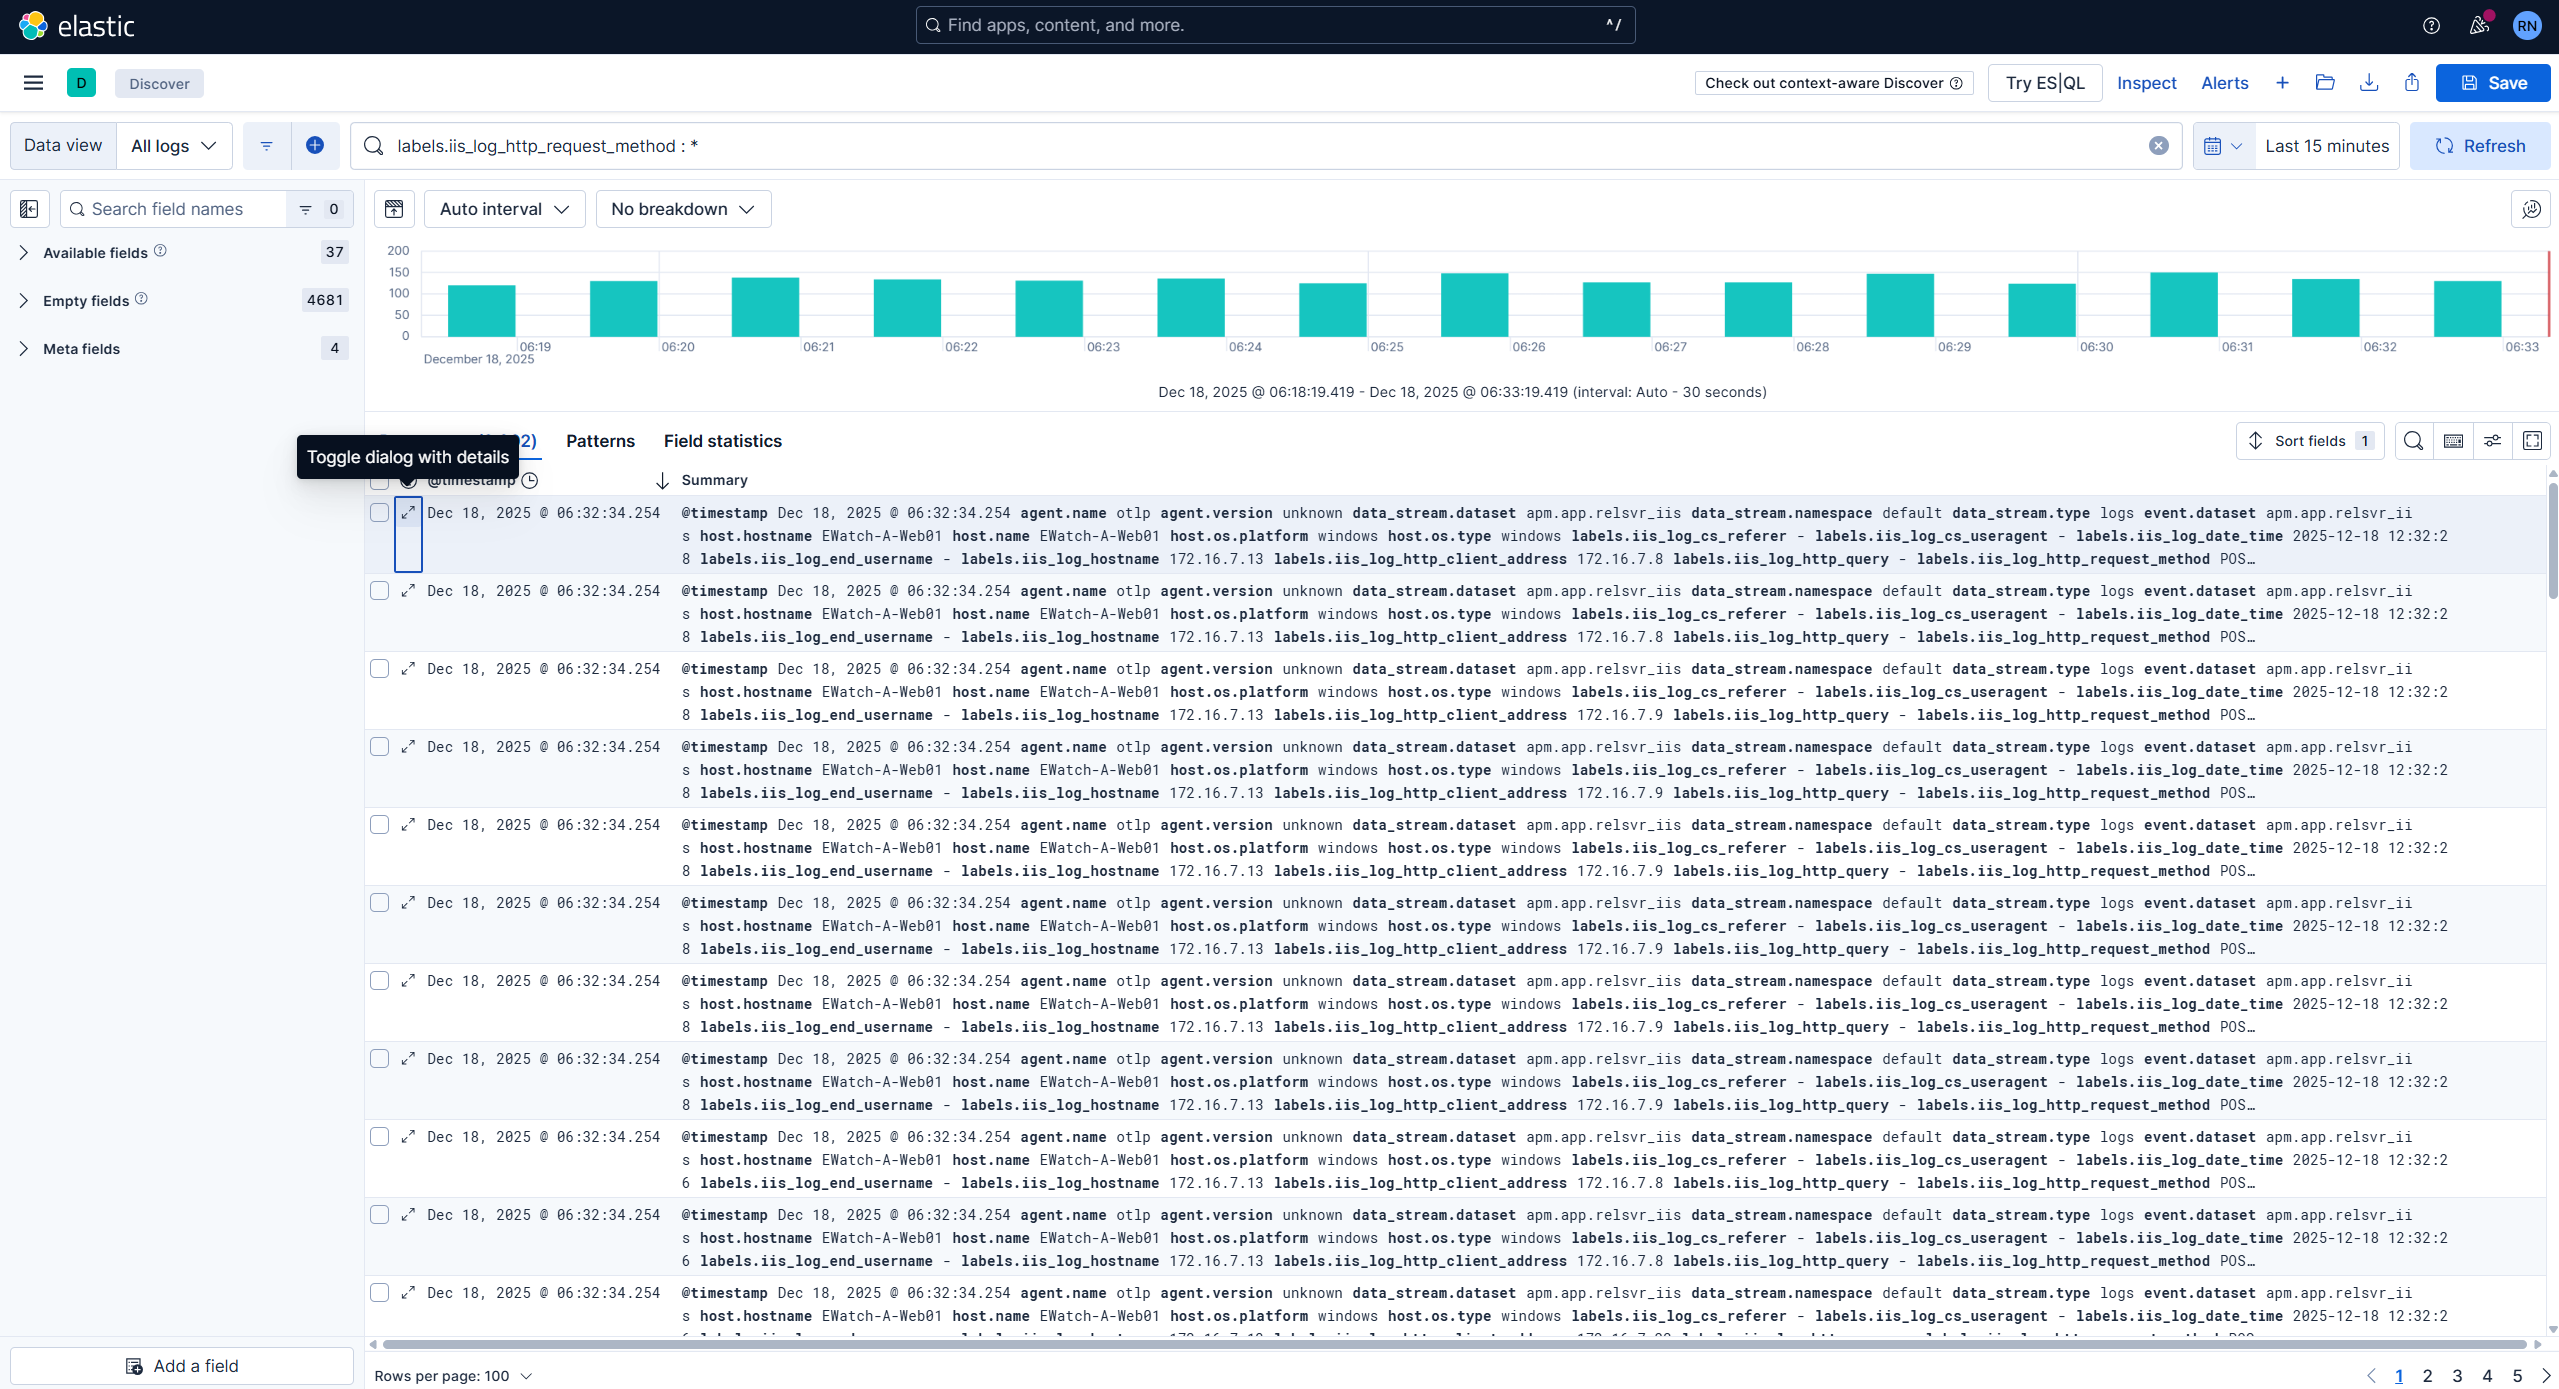
Step 4: Search for IIS Logs
In the search bar, enter the following query to filter for IIS logs:
Copy
labels.iis_log_http_request_method:*
Or search for a specific field:
Copy
labels.iis_log_http_target:"/Relativity*"
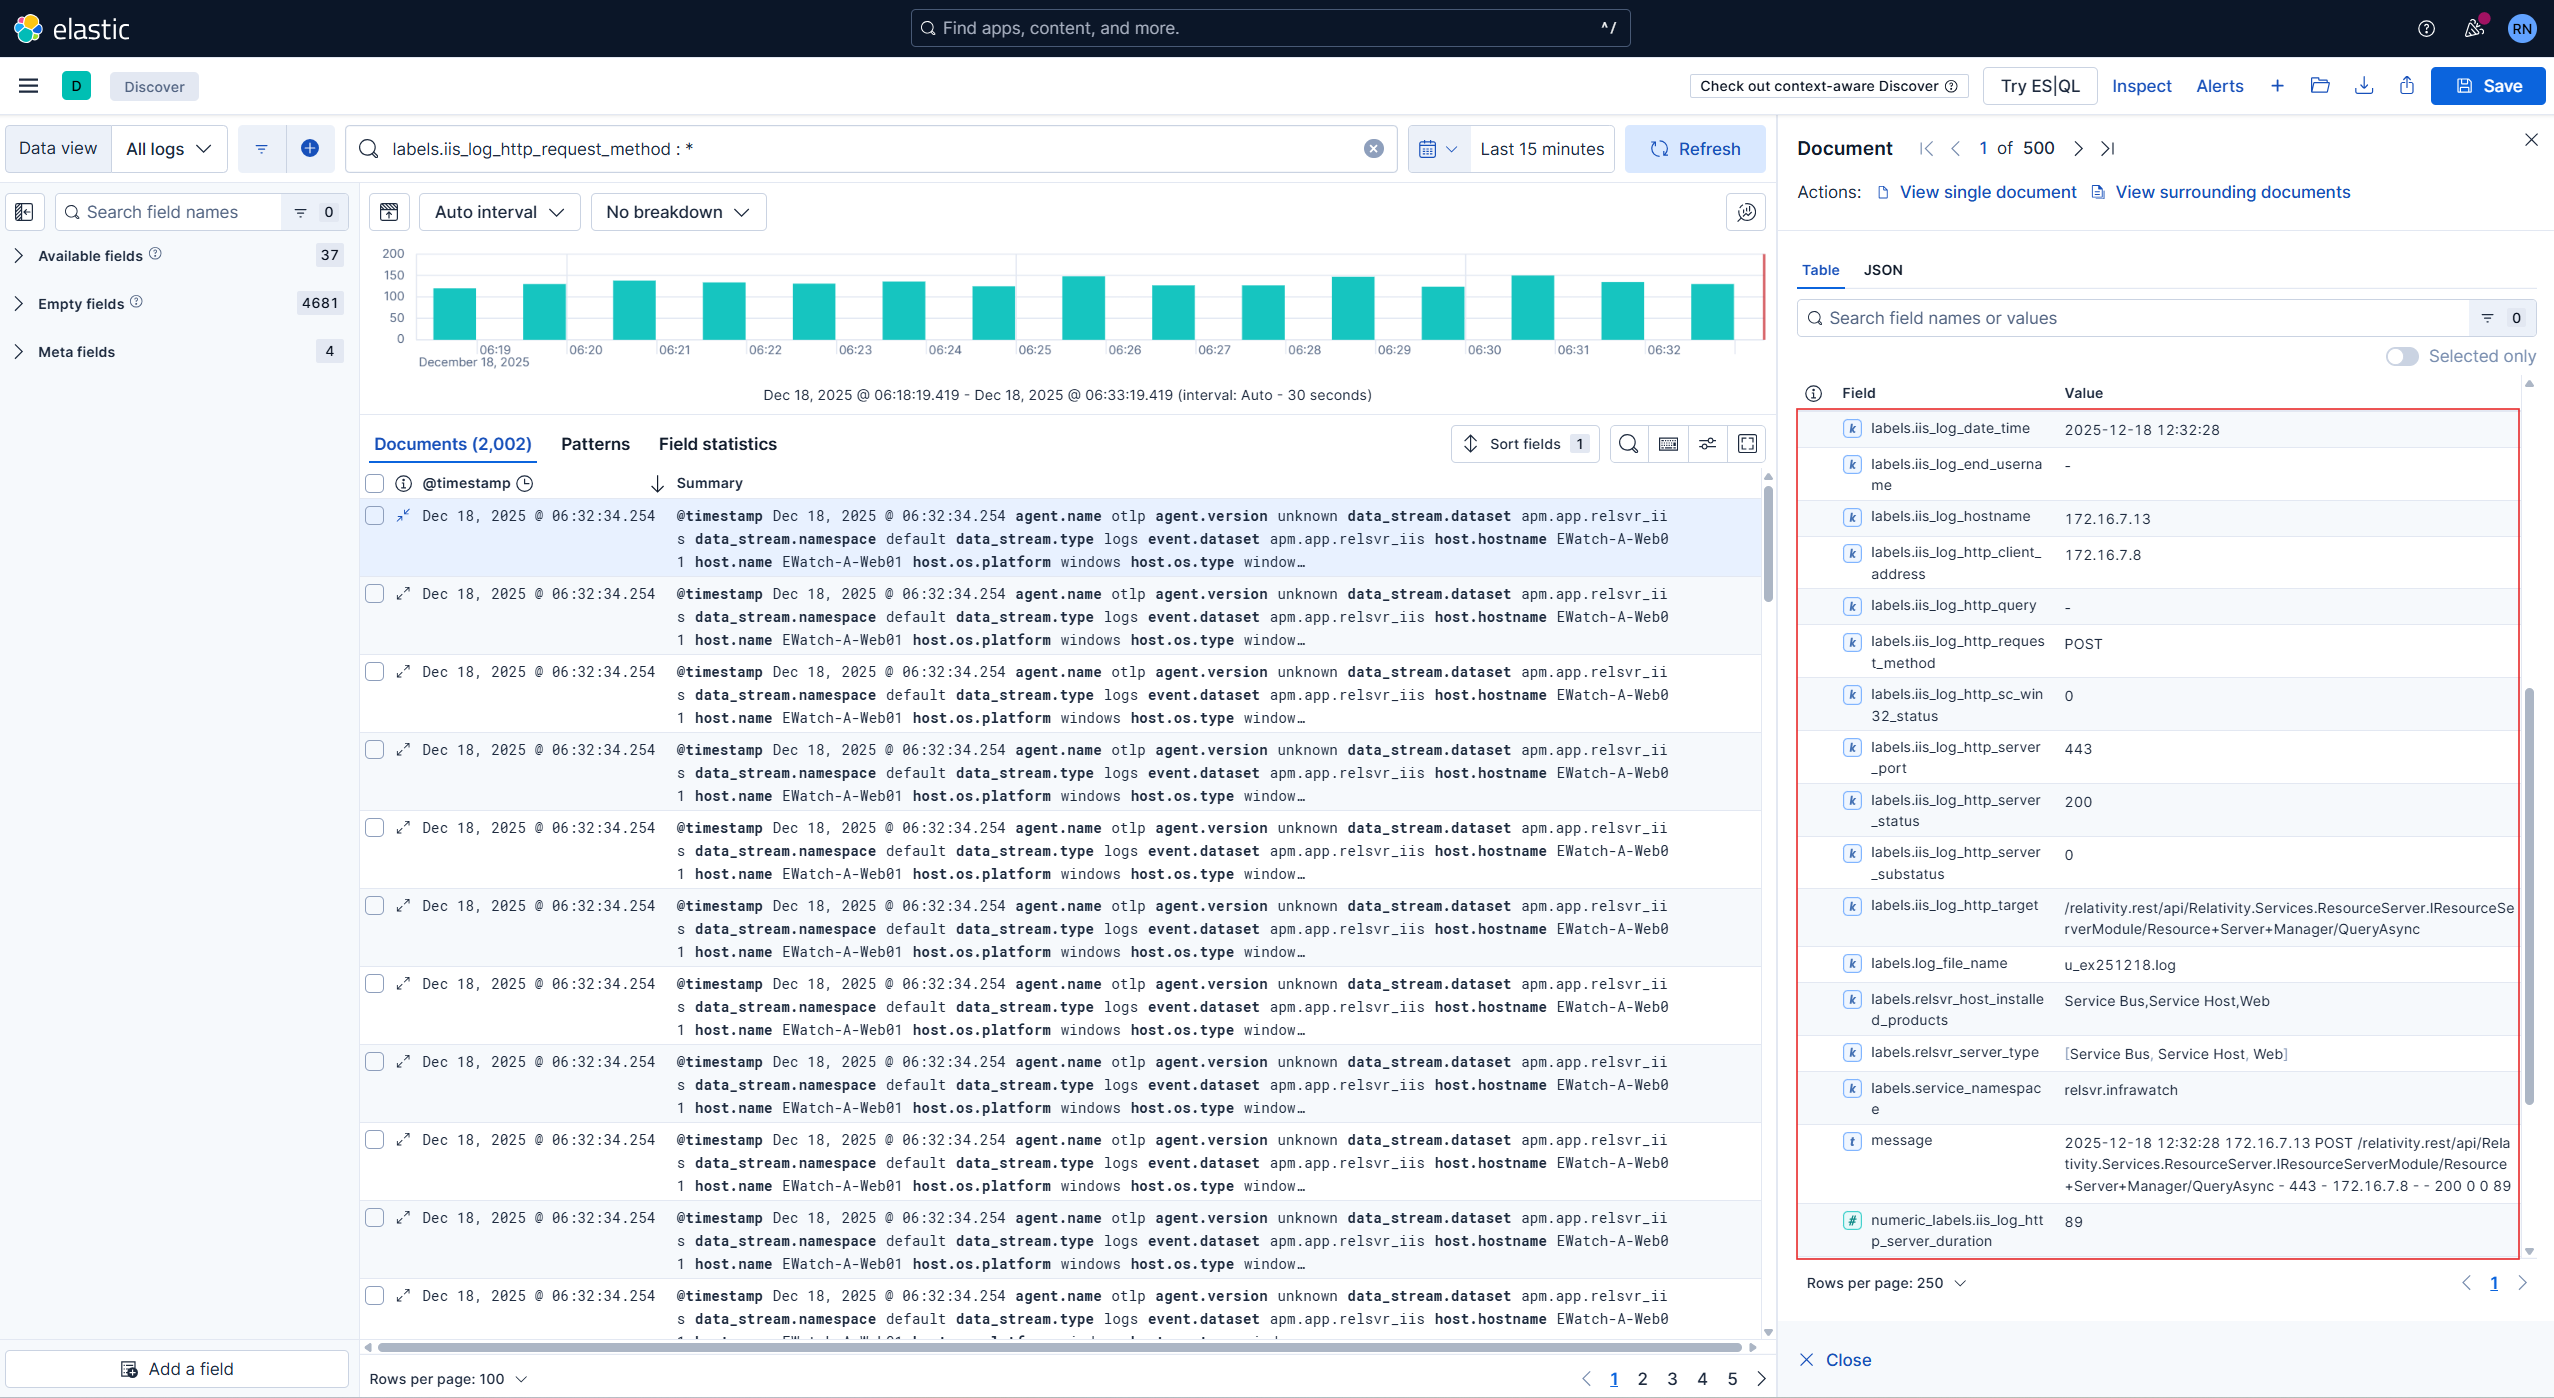
Step 5: Verify Fields are Populated
-
Expand one of the log entries by clicking the arrow icon
-
Verify that all IIS log fields are present and populated:
labels.iis_log_date_timelabels.iis_log_hostnamelabels.iis_log_http_request_methodlabels.iis_log_http_targetlabels.iis_log_http_server_statuslabels.iis_log_http_server_durationand all other mapped fields