


Feedback
Kibana Search Quick Reference for SQL-experienced Admins
This guide helps Relativity admins quickly transition from SQL to Kibana search by providing side-by-side examples of common queries. Use this as a quick reference when you need to find logs in Kibana.
Prerequisites: This guide assumes you're already familiar with the Kibana Discover UI basics. If not, review the Introduction to Kibana Discover UI first.
KQL vs ES|QL: Choosing the Right Tool
Kibana supports two query languages. Here's when to use each:
Use KQL (Kibana Query Language) for:
- Simple searches: Finding logs containing specific text, errors, or field values
- Quick filters: Searching by application name, log level, or host
- Interactive exploration: Building queries with point-and-click filters
- Pattern matching: Using wildcards to find partial matches
Think of KQL as: Your WHERE clause in SQL's simple filtering and pattern matching.
Use ES|QL (Elasticsearch Query Language) for:
- Aggregations: Counting, grouping, and statistical analysis
- Complex transformations: Calculations, derived fields, and data reshaping
- Multi-step queries: Piping data through multiple operations
- Advanced analytics: Top N queries, percentiles, and trending
Think of ES|QL as: Full SQL including GROUP BY, ORDER BY, LIMIT, and aggregate functions like COUNT(), AVG(), and SUM().
Quick Tips
- Choose the right Data View: Select
logs-*for application logs - Set an appropriate time range: Narrowing the range improves performance
- Start simple: Begin with KQL for filtering, move to ES|QL when you need aggregations
- Case sensitivity: KQL operators are case-insensitive, but quoted values must match exactly
- Wildcards: Use
*for pattern matching, but be specific to maintain performance
Section 1: Basic Searches with KQL
Use KQL for simple filtering and searching the equivalent of your SQL WHERE clause.
Find any log containing a word
How you'd think about it in SQL:
Copy
SELECT * FROM [EDDSLogging].[eddsdbo].[RelativityLogs] WHERE Message LIKE '%error%'
How to do it in Kibana (KQL):
Copy
error
Searches across all fields for the word "error". Case-insensitive by default.
Search for multiple terms (OR condition)
SQL approach:
Copy
SELECT * FROM [EDDSLogging].[eddsdbo].[RelativityLogs]
WHERE Message LIKE '%error%' OR Message LIKE '%warning%'
Kibana (KQL):
Copy
error OR warning
Finds logs containing either "error" OR "warning".
Search for multiple conditions (AND)
SQL approach:
Copy
SELECT * FROM [EDDSLogging].[eddsdbo].[RelativityLogs]
WHERE (Message LIKE '%error%' OR Message LIKE '%warning%')
  AND (Message LIKE '%document%' OR Message LIKE '%import%')
Kibana (KQL):
Copy
(error OR warning) AND (document OR import)
Use parentheses to group conditions, just like SQL.
Search for an exact phrase
SQL approach:
Copy
SELECT * FROM [EDDSLogging].[eddsdbo].[RelativityLogs]
WHERE Message = 'Failed to retrieve favorites'
Kibana (KQL):
Copy
"Failed to retrieve favorites"
Quotes ensure the exact phrase is matched.
Search a specific field
SQL approach:
Copy
SELECT * FROM [EDDSLogging].[eddsdbo].[RelativityLogs]
WHERE Level = 'Error' OR Level = 'Fatal'
Kibana (KQL):
Copy
log.level:"Error" OR log.level:"Fatal"
Field names follow dot notation (e.g., log.level, labels.Application).
Use wildcards for pattern matching
SQL approach:
Copy
SELECT * FROM [EDDSLogging].[eddsdbo].[RelativityLogs]
WHERE Exception LIKE '%The application failed%'
Kibana (KQL):
Copy
error.stack_trace:*The application failed*
The * wildcard matches any characters, similar to % in SQL.
Exclude results (NOT operator)
SQL approach:
Copy
SELECT * FROM [EDDSLogging].[eddsdbo].[RelativityLogs]
WHERE Exception LIKE '%The application failed%'
  AND Level != 'Information'
Kibana (KQL):
Copy
error.stack_trace:*The application failed* AND NOT log.level:"Information"
Use NOT to exclude specific values.
Find errors for a specific application
SQL approach:
Copy
SELECT * FROM [EDDSLogging].[eddsdbo].[RelativityLogs]
WHERE (Level = 'Error' OR Level = 'Fatal')
  AND Properties.value('(//Application)[1]', 'nvarchar(max)') = 'Imaging'
  AND Properties.value('(//SubSystem)[1]', 'nvarchar(max)') = 'Import'
Kibana (KQL):
Copy
(log.level:"Error" OR log.level:"Fatal") AND labels.Application:"Imaging" AND labels.SubSystem:"Import"
Combine multiple field filters to narrow down results.
Find all logs for a specific host
SQL approach:
Copy
SELECT * FROM [EDDSLogging].[eddsdbo].[RelativityLogs]
WHERE Properties.value('(//HostName)[1]', 'nvarchar(max)') = 'RELVM-WEB01'
Kibana (KQL):
Copy
host.name:"RELVM-WEB01"
Find disabled agents
SQL approach:
Copy
SELECT * FROM [EDDS].[eddsdbo].[Agent]
WHERE Enabled = 0
**Kibana (KQL):
Copy
relsvr.agent.disabled:1
KQL Reference Summary
KQL works like your SQL WHERE clause:
Copy
-- SQL pattern
SELECT * FROM [EDDSLogging].[eddsdbo].[RelativityLogs] WHERE [conditions]

-- Maps to KQL pattern
[field]:[value] AND/OR [field]:[value]
Common KQL patterns:
field:value| exact match on a fieldfield:*partial*| wildcard search"exact phrase"| match complete phraseAND,OR,NOT| logical operators(...)| group conditions
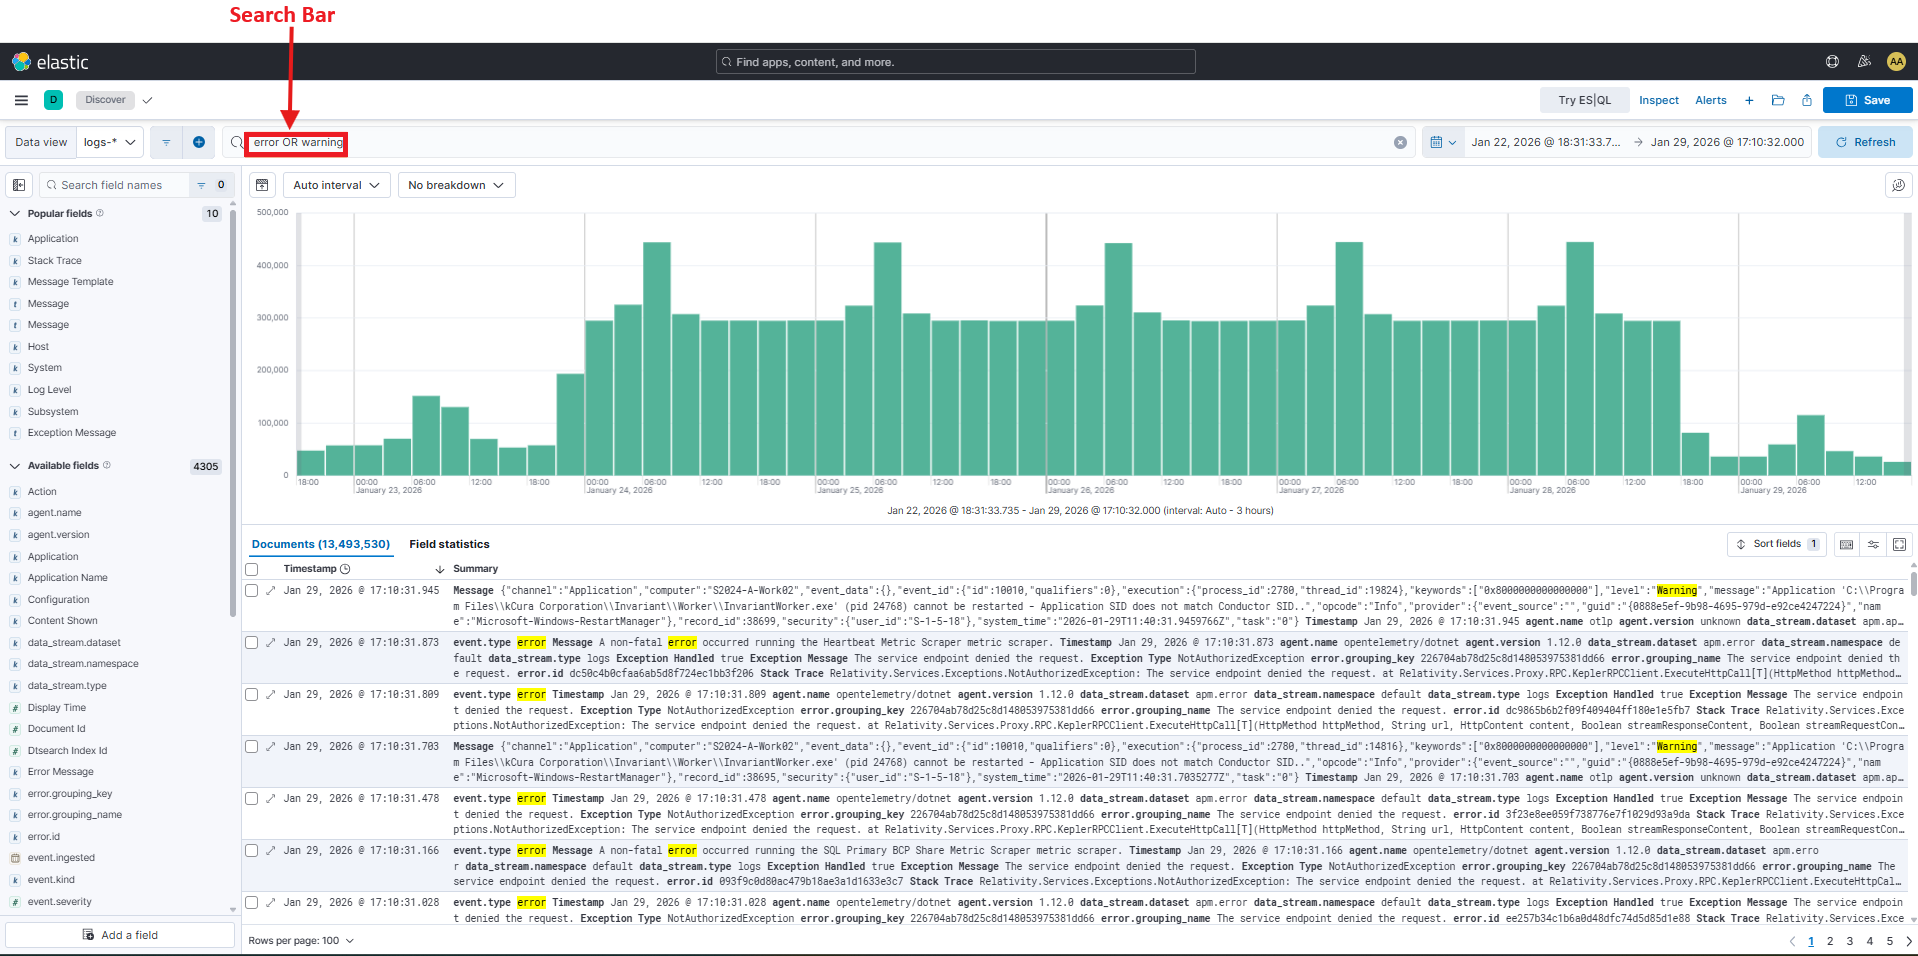
The screenshot above highlights a side-by-side comparison showing how SQL WHERE clauses translate to KQL field:value syntax. Notice how SQL's LIKE operator with % wildcards becomes * in KQL.
Section 2: Advanced Queries with ES|QL
Use ES|QL when you need aggregations, grouping, or calculations or the full power of SQL including GROUP BY, COUNT(), AVG(), and ORDER BY.
ES|QL uses a pipe-based syntax where data flows through transformations:
Copy
FROM [data-view]
| WHERE [filter-conditions]
| STATS [aggregations] BY [group-by-fields]
| SORT [field] DESC
| LIMIT [number]
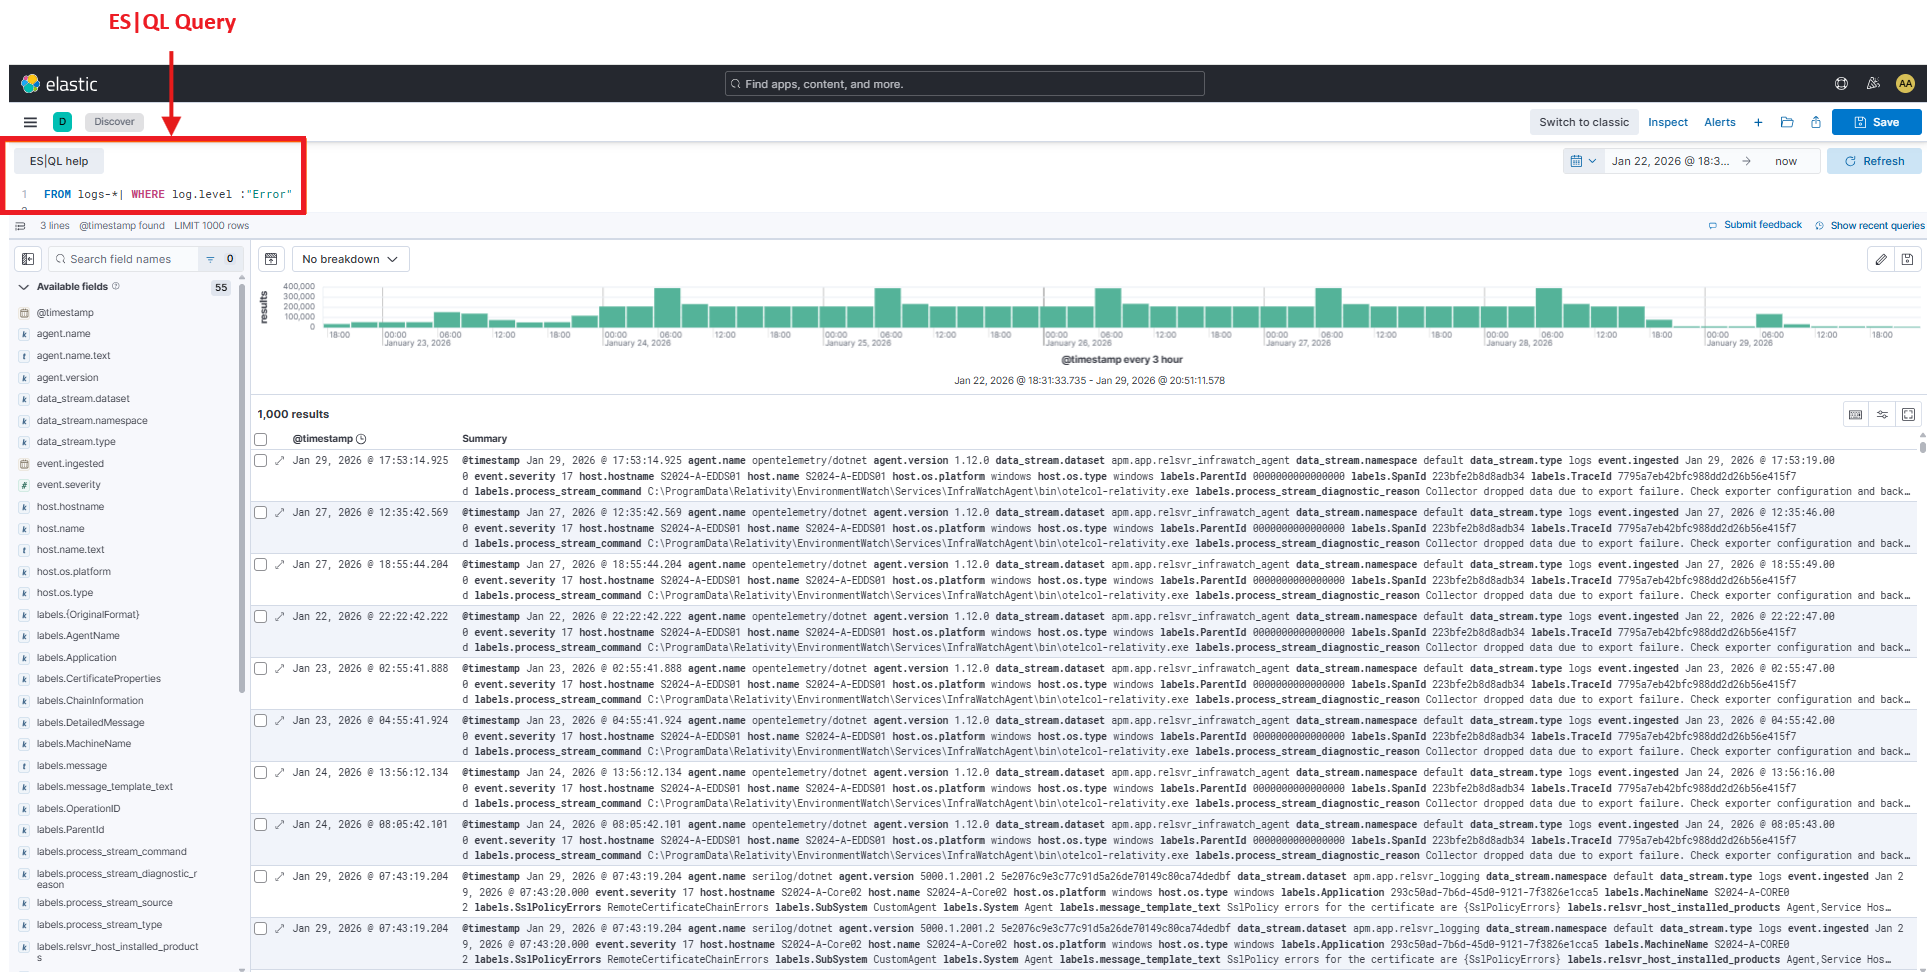
The screenshot above highlights an example of an ES|QL query showing the pipe-based syntax. Notice how each line starts with a pipe (|) and operations flow top to bottom: FROM | WHERE | STATS | SORT. The results table appears below the query.
Count total logs
SQL approach:
Copy
SELECT COUNT(*) AS total_logs
FROM [EDDSLogging].[eddsdbo].[RelativityLogs]
Kibana (ES|QL):
Copy
FROM logs-*
| STATS total_logs = count()
Count logs by log level
SQL approach:
Copy
SELECT Level, COUNT(*) AS log_count
FROM [EDDSLogging].[eddsdbo].[RelativityLogs]
GROUP BY Level
ORDER BY log_count DESC
Kibana (ES|QL):
Copy
FROM logs-*
| STATS log_count = count() BY log.level
| SORT log_count DESC
Count errors by application
SQL approach:
Copy
SELECT
    Properties.value('(//Application)[1]', 'nvarchar(max)') AS Application,
    COUNT(*) AS error_count
FROM [EDDSLogging].[eddsdbo].[RelativityLogs]
WHERE Level = 'Error'
GROUP BY Properties.value('(//Application)[1]', 'nvarchar(max)')
ORDER BY error_count DESC
Kibana (ES|QL):
Copy
FROM logs-*
| WHERE log.level == "Error"
| STATS error_count = count() BY labels.Application
| SORT error_count DESC
Note: ES|QL uses == for equality in WHERE clauses (not single =).
Top 5 applications with most errors
SQL approach:
Copy
SELECT TOP 5
    Properties.value('(//Application)[1]', 'nvarchar(max)') AS Application,
    COUNT(*) AS error_count
FROM [EDDSLogging].[eddsdbo].[RelativityLogs]
WHERE Level = 'Error'
GROUP BY Properties.value('(//Application)[1]', 'nvarchar(max)')
ORDER BY error_count DESC
Kibana (ES|QL):
Copy
FROM logs-*
| WHERE log.level == "Error"
| STATS error_count = count() BY labels.Application
| SORT error_count DESC
| LIMIT 5
Count logs by host
SQL approach:
Copy
SELECT
    Properties.value('(//HostName)[1]', 'nvarchar(max)') AS HostName,
    COUNT(*) AS log_count
FROM [EDDSLogging].[eddsdbo].[RelativityLogs]
GROUP BY Properties.value('(//HostName)[1]', 'nvarchar(max)')
ORDER BY log_count DESC
Kibana (ES|QL):
Copy
FROM logs-*
| STATS log_count = count() BY host.name
| SORT log_count DESC
Count errors per hour for a specific application
SQL approach:
Copy
SELECT
    DATEPART(HOUR, TimeStamp) AS hour,
    COUNT(*) AS error_count
FROM [EDDSLogging].[eddsdbo].[RelativityLogs]
WHERE Level = 'Error'
  AND Properties.value('(//Application)[1]', 'nvarchar(max)') = 'Imaging'
  AND TimeStamp >= DATEADD(DAY, -1, GETDATE())
GROUP BY DATEPART(HOUR, TimeStamp)
ORDER BY hour
Kibana (ES|QL):
Copy
FROM logs-*
| WHERE log.level == "Error" AND labels.Application == "Imaging"
| STATS error_count = count() BY hour = DATE_TRUNC(1 hour, @timestamp)
| SORT hour
Find applications with more than 100 errors
SQL approach:
Copy
SELECT
    Properties.value('(//Application)[1]', 'nvarchar(max)') AS Application,
    COUNT(*) AS error_count
FROM [EDDSLogging].[eddsdbo].[RelativityLogs]
WHERE Level = 'Error'
GROUP BY Properties.value('(//Application)[1]', 'nvarchar(max)')
HAVING COUNT(*) > 100
ORDER BY error_count DESC
Kibana (ES|QL):
Copy
FROM logs-*
| WHERE log.level == "Error"
| STATS error_count = count() BY labels.Application
| WHERE error_count > 100
| SORT error_count DESC
Note: In ES|QL, the second WHERE acts like SQL's HAVING clause.
Multiple aggregations in one query
SQL approach:
Copy
SELECT
    Properties.value('(//Application)[1]', 'nvarchar(max)') AS Application,
    COUNT(*) AS total_logs,
    SUM(CASE WHEN Level = 'Error' THEN 1 ELSE 0 END) AS error_count,
    SUM(CASE WHEN Level = 'Warning' THEN 1 ELSE 0 END) AS warning_count
FROM [EDDSLogging].[eddsdbo].[RelativityLogs]
GROUP BY Properties.value('(//Application)[1]', 'nvarchar(max)')
Kibana (ES|QL):
Copy
FROM logs-*
| STATS
    total_logs = count(),
    error_count = count_if(log.level == "Error"),
    warning_count = count_if(log.level == "Warning")
  BY labels.Application
Group by multiple fields
SQL approach:
Copy
SELECT
    Properties.value('(//Application)[1]', 'nvarchar(max)') AS Application,
    Properties.value('(//SubSystem)[1]', 'nvarchar(max)') AS SubSystem,
    COUNT(*) AS error_count
FROM [EDDSLogging].[eddsdbo].[RelativityLogs]
WHERE Level = 'Error'
GROUP BY Properties.value('(//Application)[1]', 'nvarchar(max)'), Properties.value('(//SubSystem)[1]', 'nvarchar(max)')
ORDER BY error_count DESC
Kibana (ES|QL):
Copy
FROM logs-*
| WHERE log.level == "Error"
| STATS error_count = count() BY labels.Application, labels.SubSystem
| SORT error_count DESC
ES|QL Reference Summary
ES|QL provides full SQL-like querying:
Copy
-- SQL pattern
SELECT [fields], COUNT(*), AVG(field)
FROM [table]
WHERE [conditions]
GROUP BY [fields]
HAVING [aggregate-conditions]
ORDER BY [field] DESC
LIMIT [number]

-- Maps to ES|QL pattern
FROM [data-view]
| WHERE [conditions]
| STATS [aggregations] BY [group-fields]
| WHERE [aggregate-conditions]
| SORT [field] DESC
| LIMIT [number]
Key ES|QL Commands:
FROM| Select data source (like SQLFROM)WHERE| Filter rows (like SQLWHEREandHAVING)STATS| Aggregate data (like SQLSELECTwith aggregates)BY| Group results (like SQLGROUP BY)SORT| Order results (like SQLORDER BY)LIMIT| Restrict results (like SQLTOPorLIMIT)EVAL| Create calculated fields (like SQL calculated columns)
Important differences from SQL:
- Use
==for equality (not=) in WHERE clauses - Use
|pipes to chain operations instead of commas - Aggregation aliases come before the function:
error_count = count()
Quick Reference: Common Admin Queries
Copy and paste these frequently-used queries:
All disabled agents
Copy
relsvr.agent.disabled:1
Specific disabled agent (e.g., Billing Agent)
Copy
relsvr.agent.disabled:1 AND labels.relsvr_agent_type:"Billing Agent"
Service discovery failures
Copy
labels.message_template_text:"GetServiceLocationAsync lookup for {ServiceIdentifier} {ServiceVersion} failed!"
Database connection errors
Copy
error.stack_trace:*SqlException* OR error.stack_trace:*connection*
Timeout errors across all applications
Copy
error.stack_trace:*timeout* OR error.message:*timeout*
All RabbitMQ-related logs
Copy
labels.rabbitmq_node_name:*
Import job failures
Copy
(log.level:"Error" OR log.level:"Fatal") AND labels.SubSystem:"Import"
Agent errors in the last 15 minutes
Copy
(log.level:"Error" OR log.level:"Fatal") AND labels.relsvr_agent_type:*
Set time range to "Last 15 minutes" in the Kibana UI.
Additional Resources
Official Documentation
- Kibana Query Language (KQL) - Complete KQL reference
- Elastic ES|QL Documentation - Full ES|QL syntax guide
Community Cheat Sheets
- Kibana Search Cheatsheet by Tim Roes
- Elasticsearch and Kibana v8 Search Cheat Sheet by Mike Polinowski
- SQL to Kusto Query Translation (Microsoft Learn) - Similar query concepts
Related Documentation
- Introduction to Kibana Discover UI - Learn the Kibana interface
- How To - Search Logs Using Kibana - Step-by-step search guide