


Feedback
Searching Logs/Metrics/Traces Using Kibana
This guide builds on the introduction to Kibana Discover UI and focuses on practical KQL examples for searching logs, metrics, and traces collected by Environment Watch. It is intended to be used as a reference when troubleshooting issues or validating system behavior.
Prerequisites
- Kibana access
- Basic KQL knowledge
- The environment is setup for Environment Watch
- Familiarity with Introduction to Kibana Discover UI
General Considerations
For additional context on Kibana UI basics, refer to the Key UI Elements section in the Introduction to Kibana Discover UI guide.
Tips for using the queries:
-
Choose the correct Data View: Always select the appropriate Data View (logs-, metrics-, or APM) before running a query. Each Data View indexes a different type of telemetry data. If the wrong Data View is selected, queries may return no results or misleading data because the fields simply do not exist in that index.
- logs-* : Contains application logs and system logs from Relativity components, including log levels, error messages, stack traces, and event data published via Relativity Logging API and Health Check API.
- metrics-* : Contains system metrics such as CPU utilization, memory usage, disk space, network statistics, and custom metrics collected by OTEL scrapers.
- APM : Contains logs, metrics, and traces including distributed traces and spans, service performance data, heartbeat signals, scraper traces, and HTTP health check endpoints.
Example: A query such as
system.cpu.utilization: *will return no results if the logs-* Data View is selected, even when CPU metrics are present, because CPU metrics are indexed only in metrics-. Likewise,log.level: "Error"will not return results in the APM Data View, as application logs are stored in logs-. -
Set an appropriate time range: Many queries depend on time filtering. Narrowing the range improves accuracy and performance.
-
Understand OTEL naming: Fields often use a namespace-like structure (e.g., system.cpu.utilization, labels.Application).
-
Use wildcards carefully: The * operator is powerful but can impact performance if overused. Apply it only where needed.
-
Case sensitivity: KQL is not case-sensitive for keywords (AND, OR, NOT), but values inside quotes (e.g., "Error") must match exactly.
-
Validate results: Always review document details in Kibana to confirm the query returns the expected data.
-
Performance tip: Keep queries as specific as possible (by field, application, or system) to avoid scanning large datasets unnecessarily.
Example - Broad (slower):
errorsearches all fields across all documents.
Example - Specific (faster):log.level : "Error" AND labels.Application : "5f5cb82f-8981-4269-92bd-060034df3648"targets exact fields and a specific application, significantly reducing the data scanned.
Procedures
All queries below require choosing the correct Data View and specifying the time range. For detailed steps on entering queries in Kibana, see the Introduction to Kibana Discover UI.
The screenshot above highlights the Data View selector (top-left) showing "APM" - this determines which index is searched. Always verify you've selected the correct Data View (logs-, metrics-, or APM) before running queries.
Search Any Field for Any Word or Term
Use case: Helpful when you do not know the exact field name or want to search across all fields for a specific term.
The following query searches all documents for any field that contains the word or term listed (e.g. "error").
Copy
error
Search Any Field for Multiple Words or Terms
Use case: Useful for casting a wider net when investigating issues that may be described with different terms.
The following query searches all documents for any field that contains multiple word(s) or term(s) (e.g. "error" or "warning").
Copy
error or warning
You can also use parentheses.
Copy
error or warning and (document or import)
Relativity-specific example: To find logs related to the Audit Application in the Agent System:
Copy
labels.ApplicationName : "Audit" and labels.System : "Agent"
To narrow down to only error logs:
Copy
labels.ApplicationName : "Audit" and labels.System : "Agent" and log.level : "Error"
Search Any Field for a Specific Phrase
Use case: Ideal when you know the exact error message or log entry you're looking for.
Putting quotes around the text ensures the exact phrase is found in that specific order.
Copy
"Failed to retrieve favorites"
Wildcards
Use case: Helpful for finding variations of a term or when you only know part of the message.
The wildcard character "*" can be used to match parts of a word or term.
Copy
error.stack_trace:*The application failed*
Not
Use case: Useful for excluding noise from search results, such as filtering out informational logs when looking for errors.
The "NOT" (case does not matter) keyword is used to negate the logic.
Copy
error.stack_trace:*The application failed* AND NOT log.level:"Information"
Search a Specific Field
Use case: More efficient when you know exactly which field contains the data you need, reducing search time and improving accuracy.
You can also constrain the search to a specific field. Keep in mind OTEL attributes have a "namespace like" structure. See Semantic Conventions or OpenTelemetry Semantic Conventions for more details.
Copy
error.stack_trace:error or warning
Search for any error log for Specific Application
Use case: Narrows down errors to a specific application when troubleshooting application-specific issues.
Copy
(log.level : "Error" or log.level : "Fatal") AND (labels.Application: *) AND (labels.System: *) AND (labels.SubSystem:"<SubSystemName>")
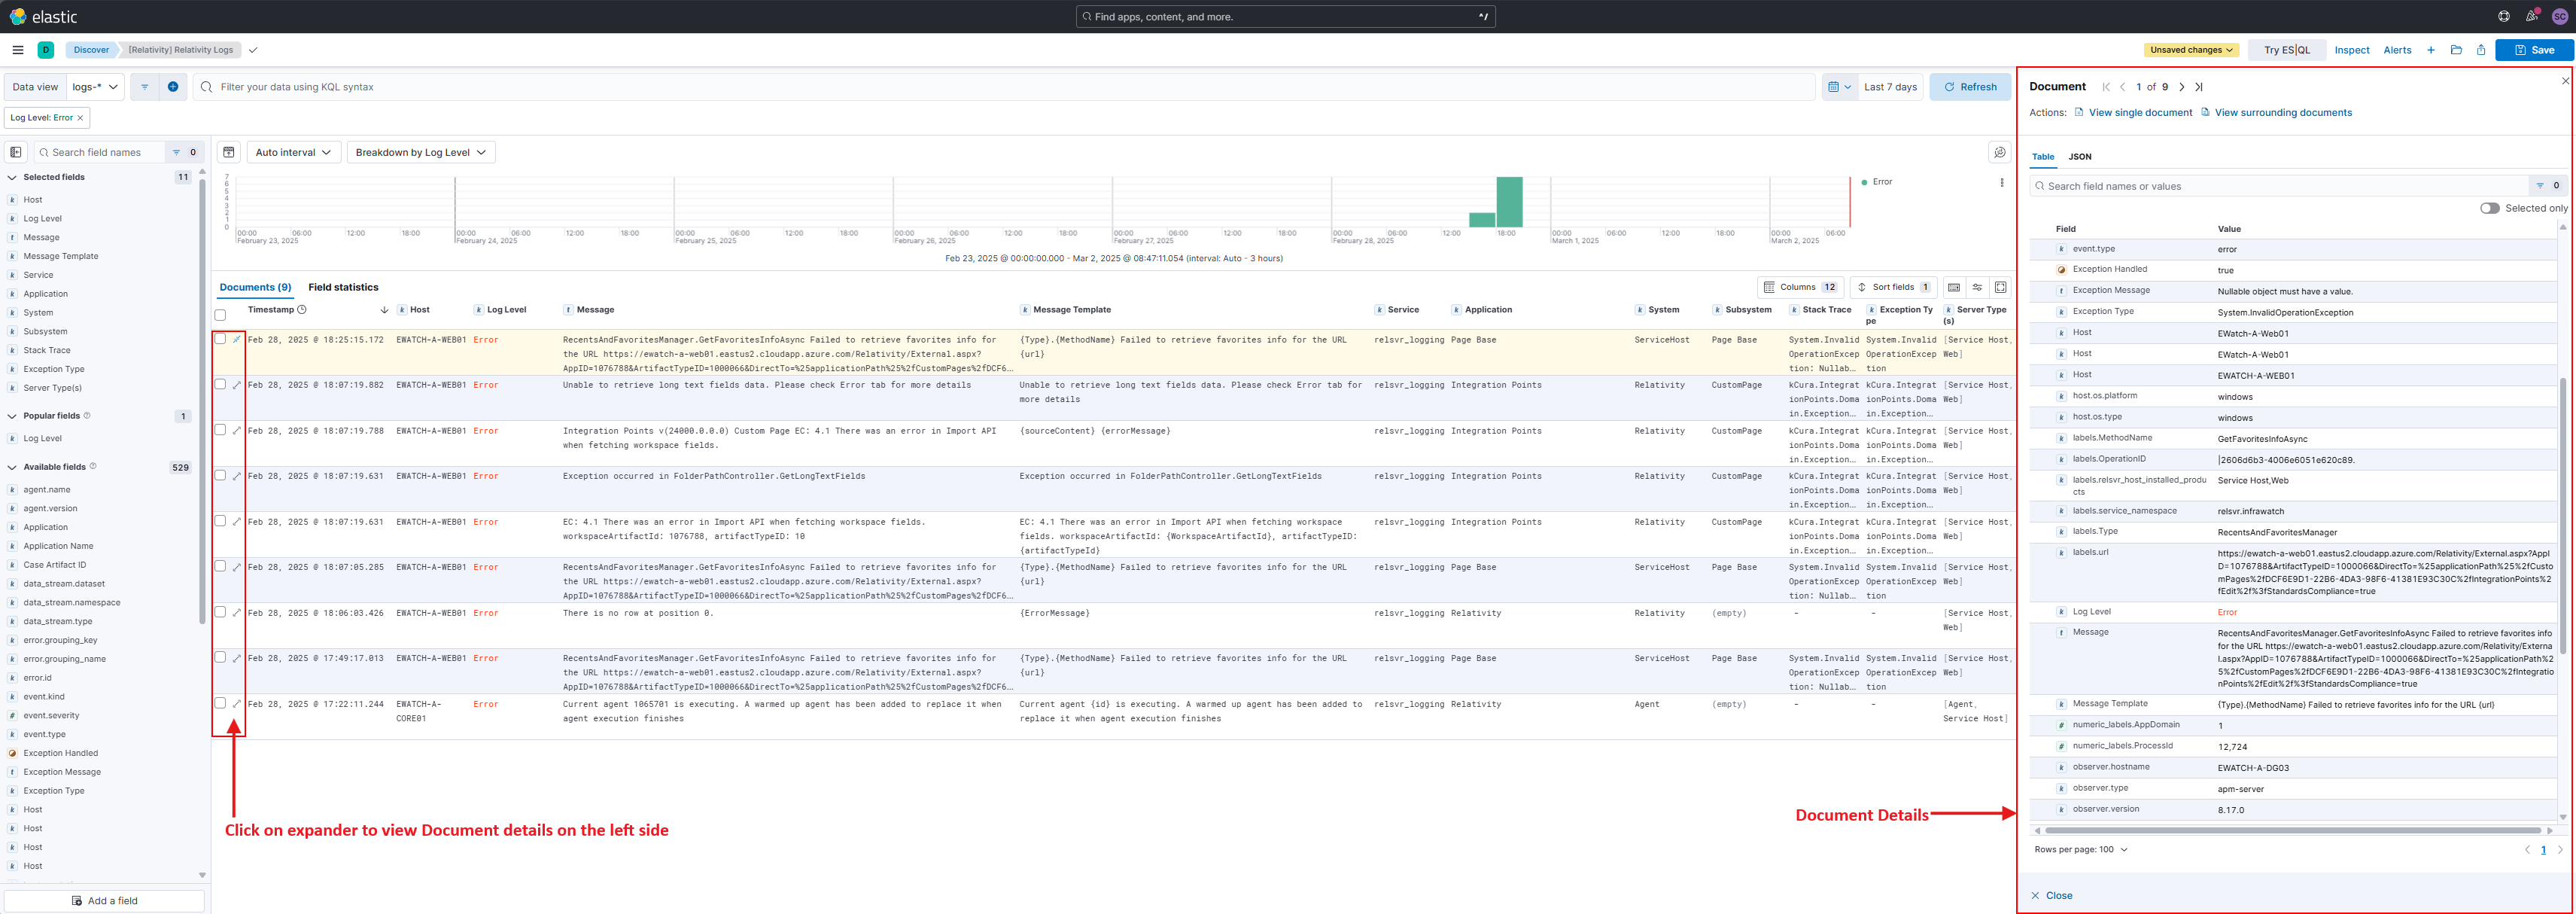
View Document Details
Use case: Essential for deep-diving into individual log entries to examine all fields and their values in detail.
Every single log, metric, and trace submitted to the OTEL backend is persisted as a new JSON document within an index. Kibana has several built-in features to help visualize the JSON document.
The screenshot above highlights log entries displayed in rows. Click the expand on the left side of any row to see full document details.
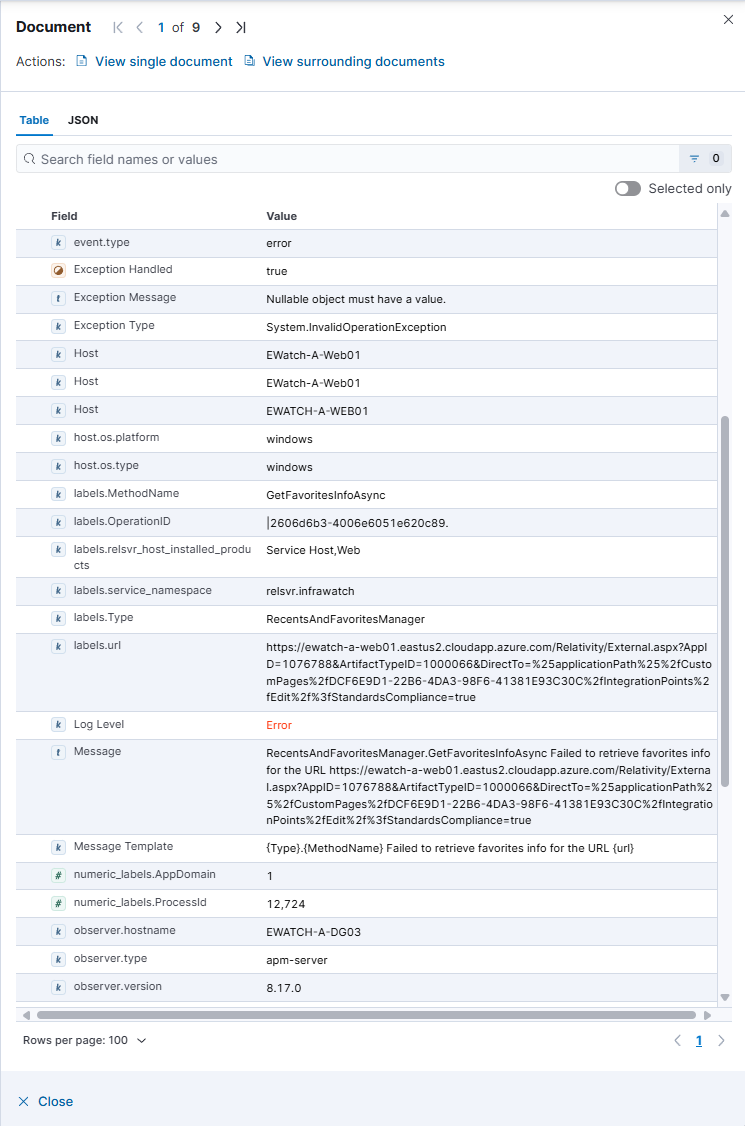
The screenshot above highlights the Table view showing document fields in a structured format. Key fields like Log Level, Service, Timestamp, Exception Message, and Stack Trace are clearly labeled. Use the tabs to switch between Table, JSON, and other views.
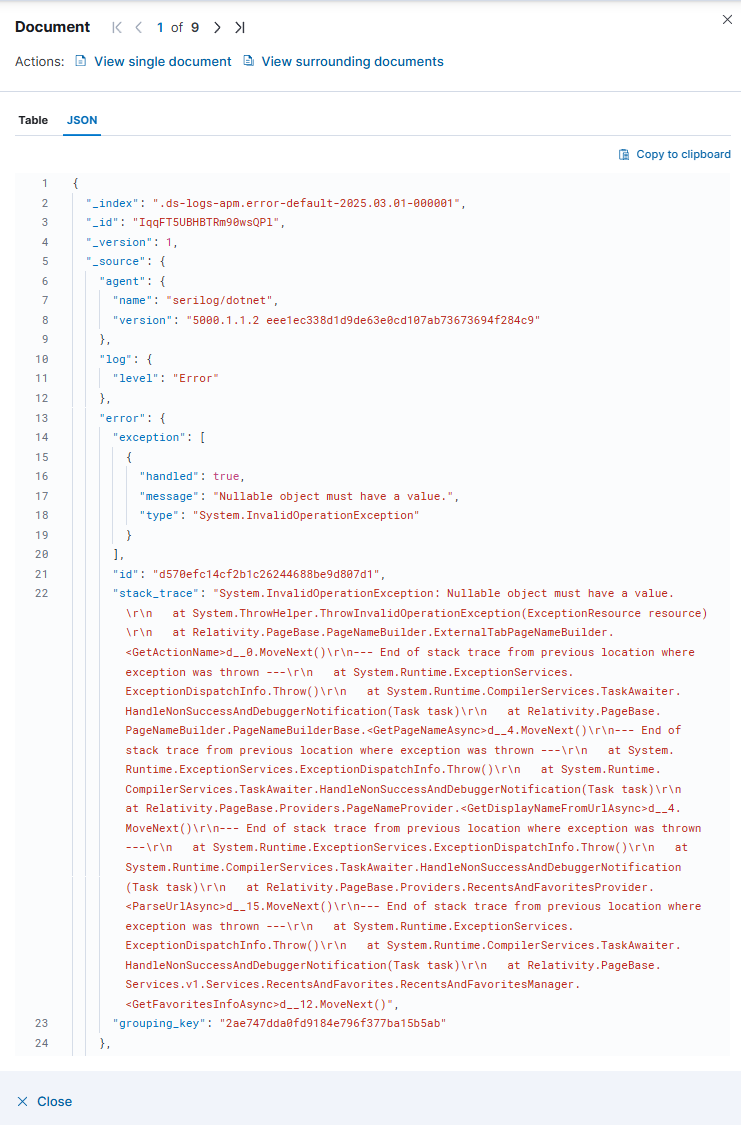
The screenshot above highlights the JSON view displaying the raw document structure. This is useful for developers or when you need to see all nested fields and their exact values.
SQL Server to Kibana Cheat Sheet
If you're used to querying Relativity logs with SQL Server, this cheat sheet will help you quickly translate those queries to Kibana Query Language (KQL).
Key Concept: Unlike SQL Server tables with rows and columns, Elasticsearch stores each log as a JSON document with field:value pairs. When you query in Kibana, you're searching across these documents using simple field:value syntax.
How fields map from SQL to Kibana:
- SQL
[Message]column | Kibanamessagefield - SQL
[Level]column | Kibanalog.levelfield - SQL
[Properties]XML with<property key="System">| Kibanalabels.Systemfield - SQL
[MessageTemplate]column | Kibanalabels.message_template_textfield - SQL
[Exception]column | Kibanaerror.stack_tracefield
The table below shows common SQL queries you already know and their KQL equivalents. Simply copy and paste the KQL queries into Kibana's search bar.
| Use Case | SQL Query | KQL Query |
|---|---|---|
| Search for an exact match on a specific field | SELECT * FROM [EDDSLogging].[eddsdbo].[RelativityLogs] WHERE [Message] = 'Conversion Agent Exception'
|
message:"Conversion Agent Exception"
|
| Search for logs containing a word or term | SELECT * FROM [EDDSLogging].[eddsdbo].[RelativityLogs] WHERE Message LIKE '%ServiceBus%'
|
message:*ServiceBus*
|
| Search for logs with a specific field value (XML Properties) | SELECT * FROM [EDDSLogging].[eddsdbo].[RelativityLogs] WITH (NOLOCK) WHERE [Properties].value('(/properties/property[@key="System"])[1]', 'varchar(max)') = 'Agent' ORDER BY ID DESC
|
labels.System:"Agent"
|
| Search for logs with field existence check (IS NOT NULL) | SELECT * FROM [EDDSLogging].[eddsdbo].[RelativityLogs] WITH (NOLOCK) WHERE [Properties].value('(/properties/property[@key="System"])[1]', 'varchar(max)') = 'Agent' AND [Properties].value('(/properties/property[@key="SubSystem"])[1]', 'varchar(max)') = 'CustomAgent' AND [Properties].value('(/properties/property[@key="System"])[1]', 'varchar(max)') IS NOT NULL ORDER BY ID DESC
|
labels.System:"Agent" AND labels.SubSystem:"CustomAgent" AND labels.System:*
|
| Search for multiple terms using AND/OR | SELECT * FROM [EDDSLogging].[eddsdbo].[RelativityLogs] WHERE [Level] = 'Error' AND (MessageTemplate = 'Document Viewer - Failed to create Relativity Error.' OR Exception IS NOT NULL)
|
log.level:"Error" AND (labels.message_template_text : "Document Viewer - Failed to create Relativity Error." or error.exception.type : *)
|