


Feedback
RabbitMQ Overview
This dashboard provides real-time visibility into the performance, health, and utilization of RabbitMQ within your Relativity environment. RabbitMQ plays a critical role in managing communication between distributed Relativity services. This dashboard helps administrators verify that RabbitMQ services are functioning correctly, messages are flowing as expected, and system resources are within normal thresholds. By tracking key metrics such as queue depth, message throughput, and resource utilization (CPU, memory, and file system I/O), administrators can quickly identify performance bottlenecks or configuration issues affecting the messaging infrastructure.
RabbitMQ Metrics and CPU Utilization
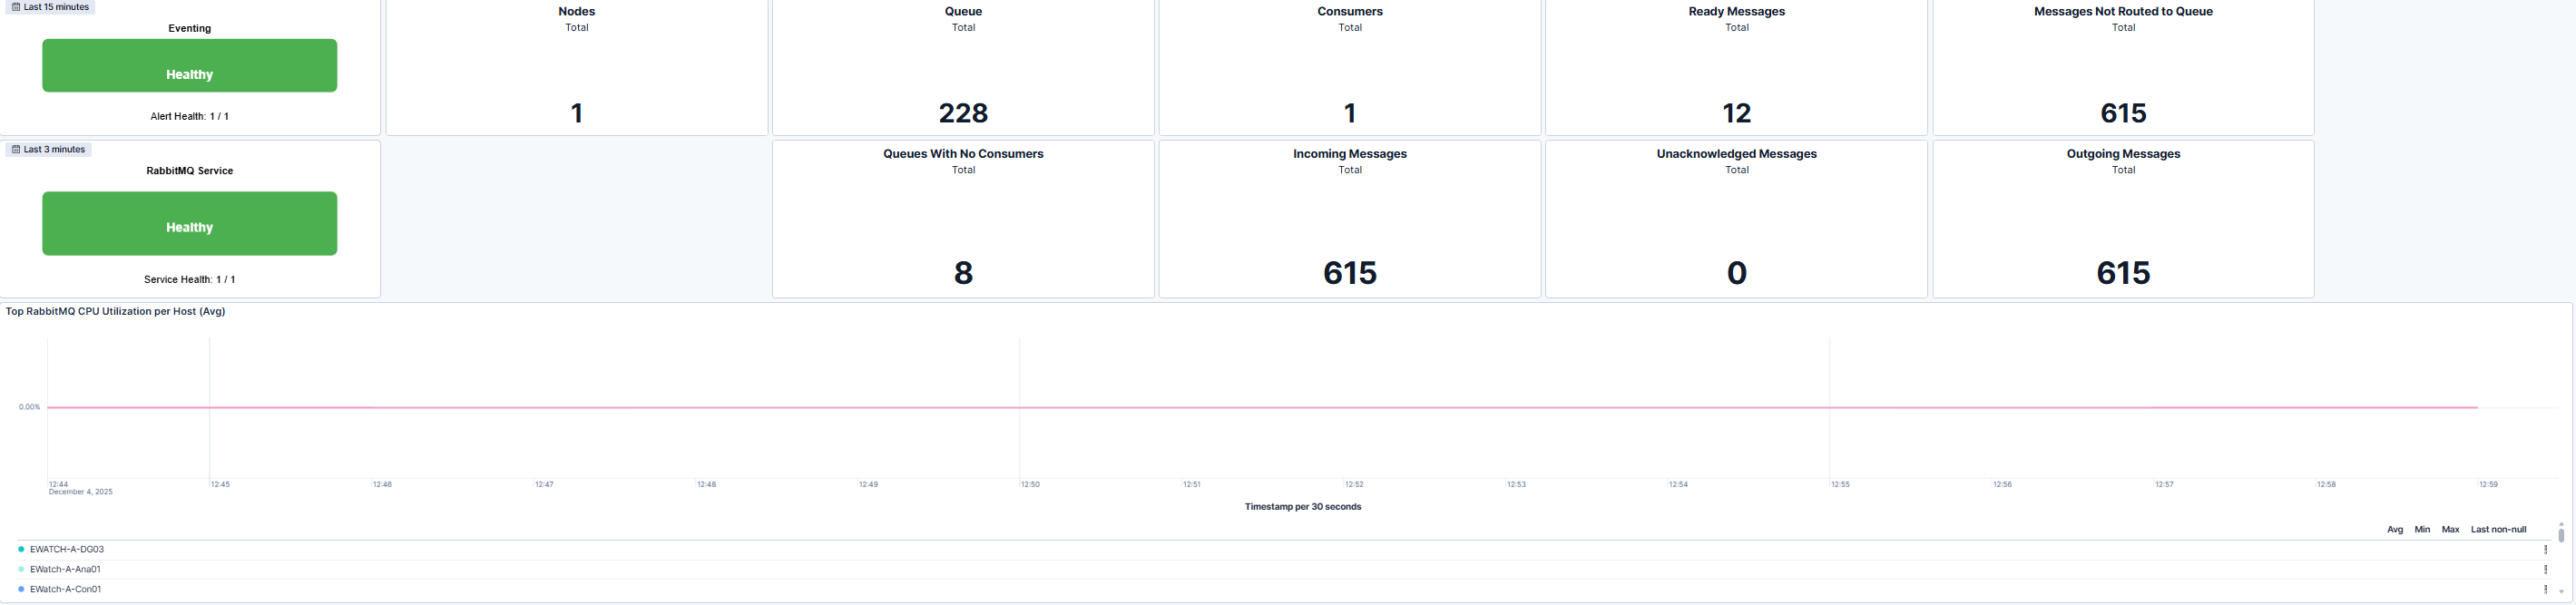
This dashboard displays the upper section of the RabbitMQ Overview Detail dashboard, summarizing RabbitMQ and Eventing health and message flow. Below the health tiles, key operational metrics such as total nodes, total queues, consumers, and message counts (ready, incoming, outgoing, and unacknowledged) provide insight into RabbitMQ's message-handling performance.
The lower portion displays the RabbitMQ CPU Utilization per Host (Average) graph, showing how processing load is distributed across hosts. Sustained spikes may indicate high message throughput or potential resource contention that warrants review.
RabbitMQ Resource Utilization
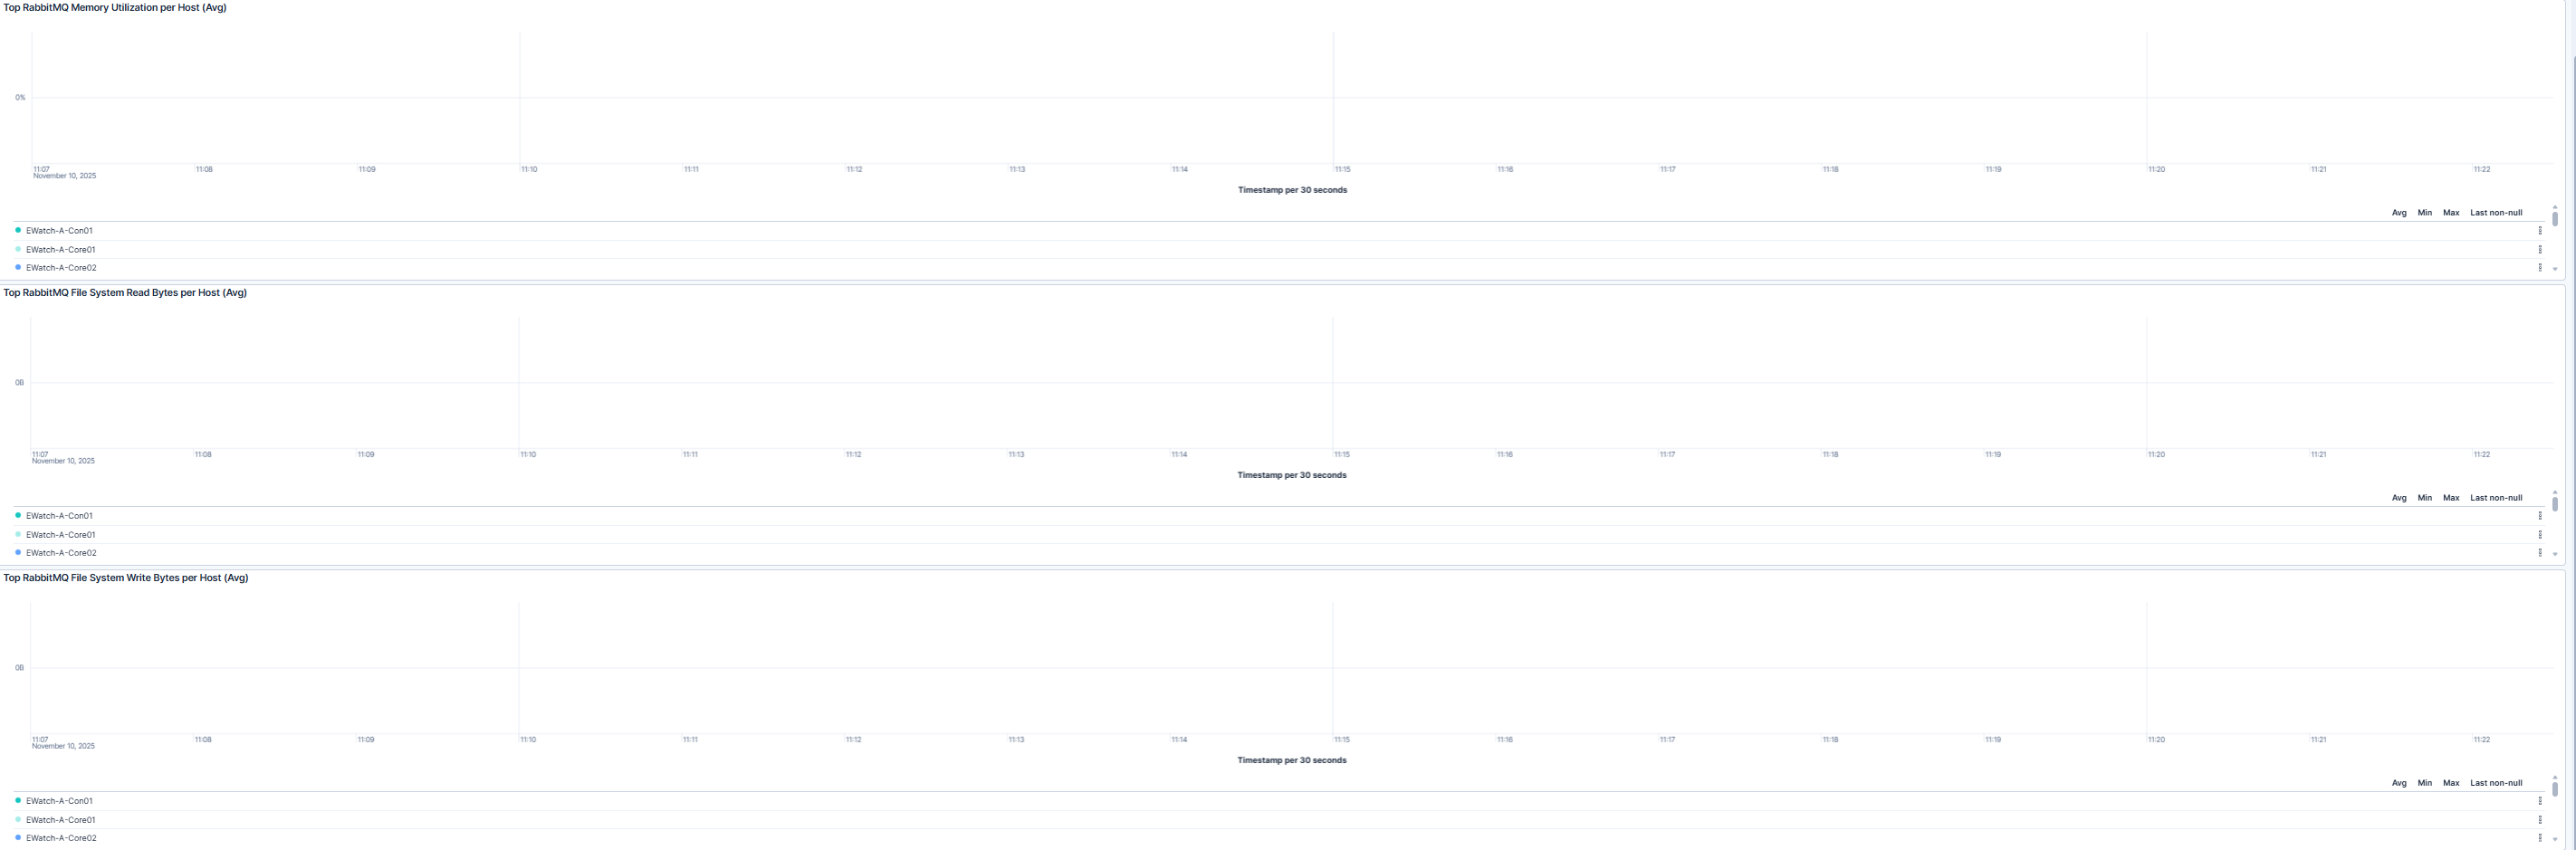
The dashboard displays the system resource utilization graphs for RabbitMQ hosts. It includes three key performance metrics displayed as trend lines:
- Top RabbitMQ Memory Utilization per Host (Average) - Monitors memory consumption by RabbitMQ processes across all nodes to ensure efficient resource usage.
- Top RabbitMQ File System Read Bytes per Host (Average) - Tracks file read activity by RabbitMQ, which helps identify I/O-intensive operations or slow disk performance.
- Top RabbitMQ File System Write Bytes per Host (Average) - Monitors write activity to detect high persistence or queue storage usage that may impact throughput.
These graphs provide an at-a-glance view of RabbitMQ resource consumption patterns, supporting proactive maintenance and capacity planning.
Use Cases
| Use Case | Description |
|---|---|
| Troubleshoot performance issues | Investigate elevated CPU, memory, or disk I/O activity using time-series charts to isolate performance degradation or potential message-processing bottlenecks. |
| Verify post-installation status | After deploying or upgrading RabbitMQ and Environment Watch, confirm that all nodes report metrics correctly and that message queues and consumers initialize as expected. |
| Plan capacity and ensure stability | Monitor long-term utilization trends to forecast hardware needs, optimize performance, and ensure RabbitMQ nodes are sized appropriately for workload demands. |