


Feedback
Processes
This dashboard provides comprehensive visibility into processes running across your hosts, helping you monitor system performance and identify resource-intensive workloads. It displays key process-level metrics—including CPU usage, memory utilization (resident and virtual), and I/O activity—so you can quickly pinpoint processes consuming excessive system resources. This dashboard is particularly useful for understanding how system resources are distributed across processes and for detecting performance bottlenecks or abnormal behaviors in real time.
Process Metrics and Top CPU Utilization
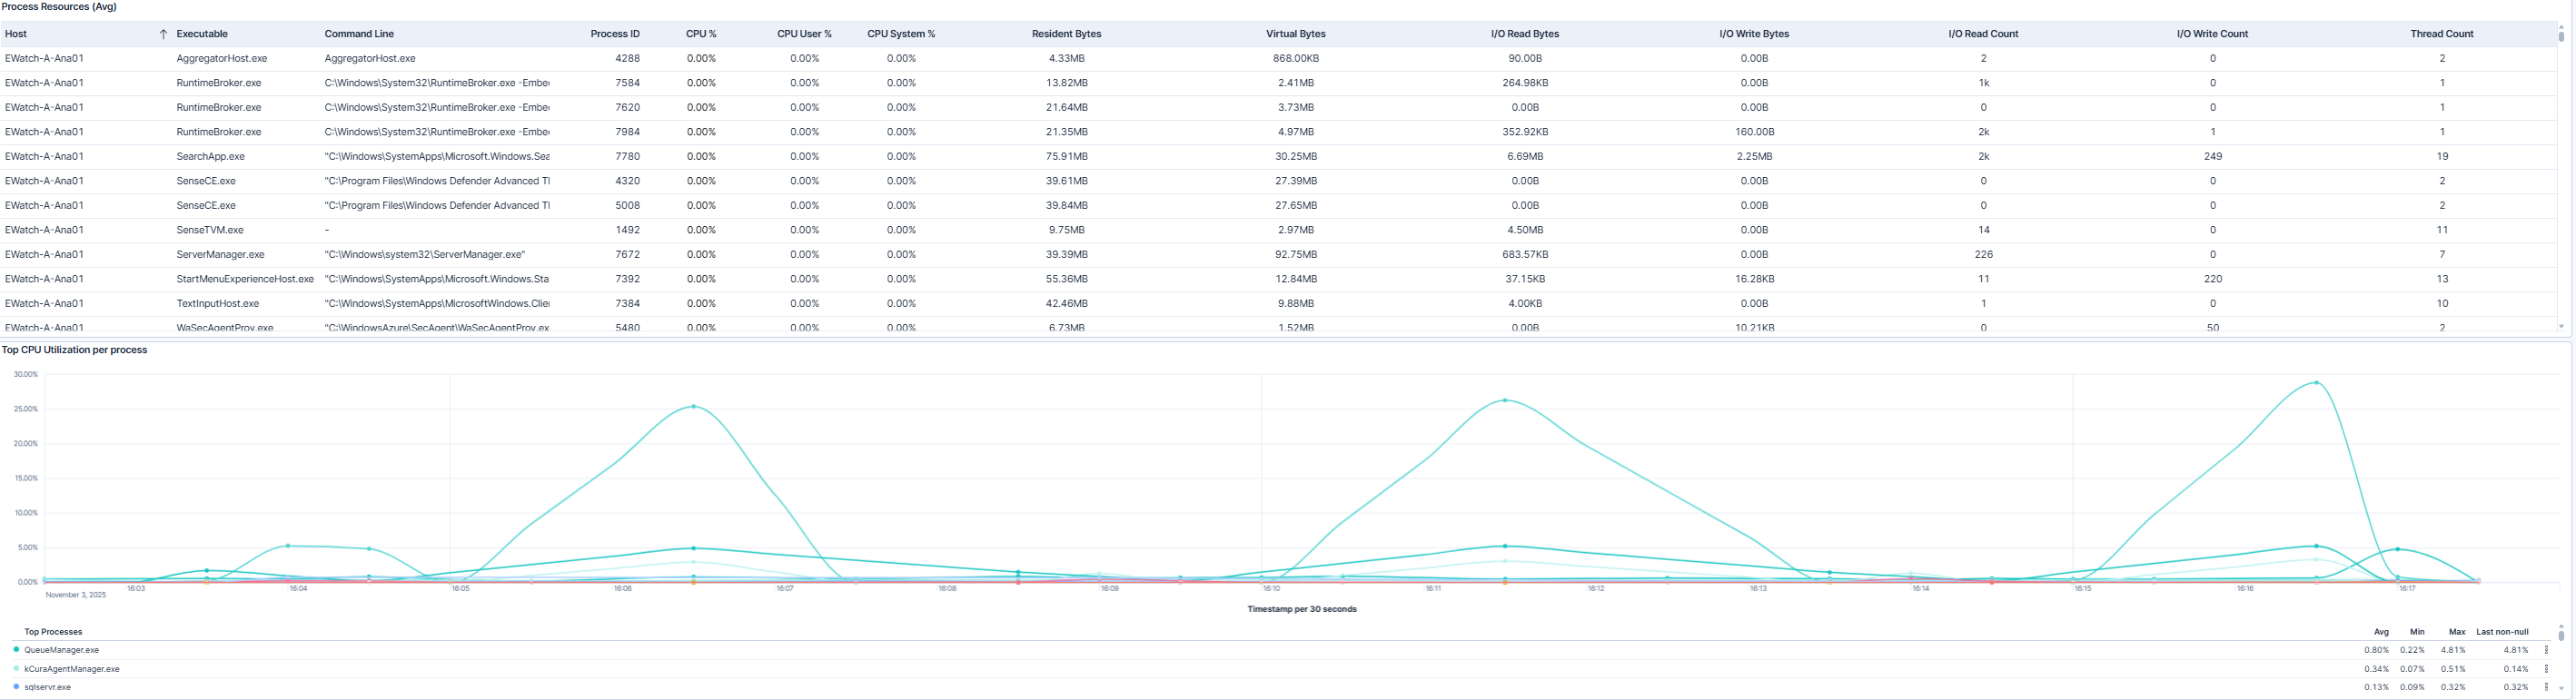
This dashboard shows a detailed table of process resource metrics alongside a graph of the top CPU-consuming processes. The table lists each process by host and executable, showing the command line, process ID, CPU usage (overall and broken down by user and system time), memory usage (resident and virtual), I/O activity (bytes read and written, read/write counts), and thread count. The graph highlights the processes using the most CPU, enabling you to quickly identify which processes are driving system load and may require investigation or optimization.
Top Memory and File System I/O Utilization per Process
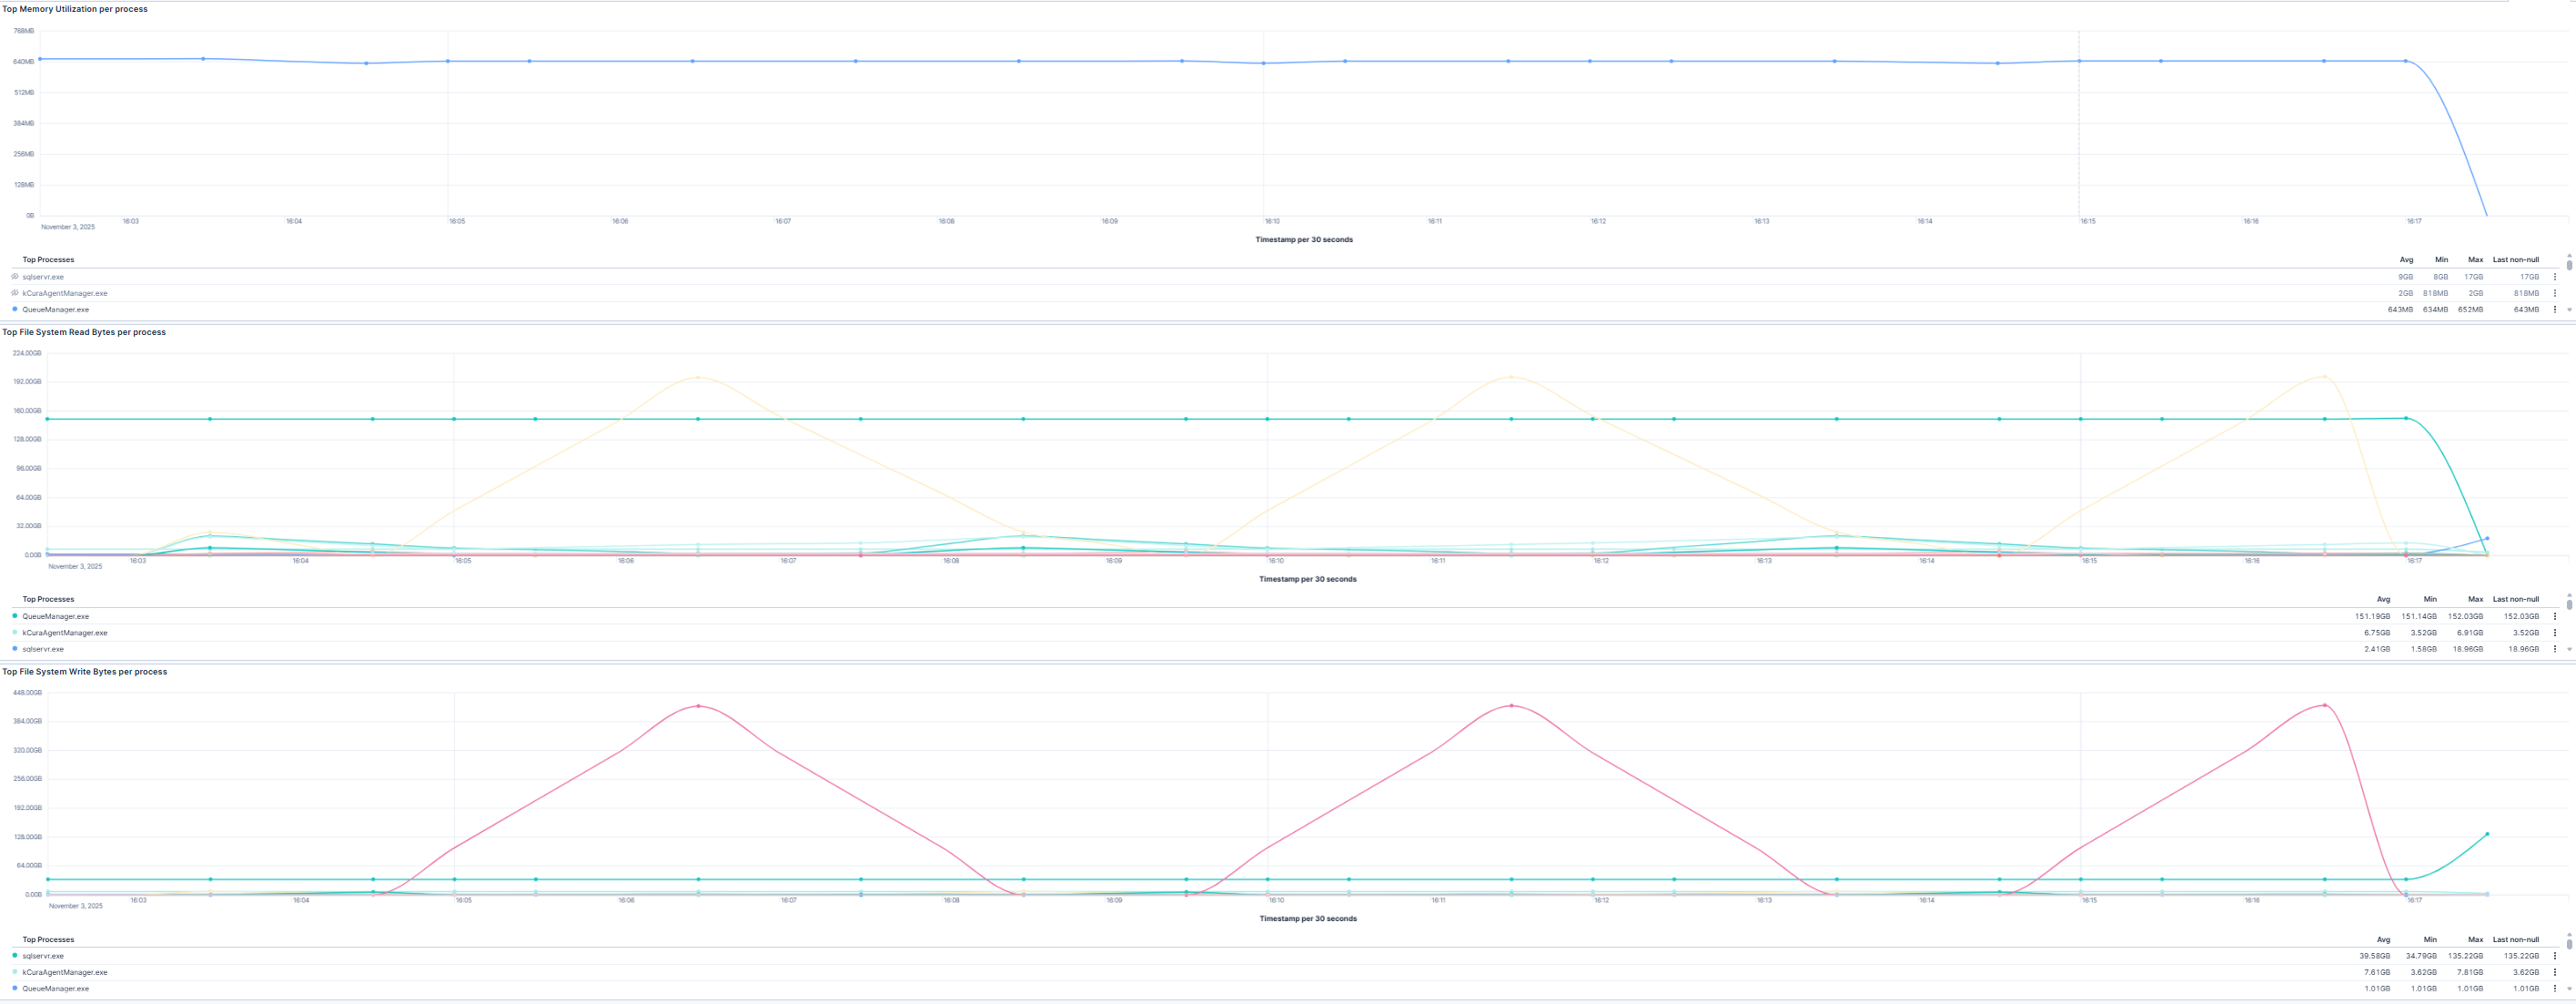
This section focuses on processes that are the most resource-intensive in terms of memory and file system activity. The three visualizations show the top memory-consuming processes, as well as those performing the highest disk read and write operations. By combining these views, you can quickly detect memory-hungry processes, pinpoint potential bottlenecks in file system I/O, and understand how different processes impact overall system performance.
Use Cases
The Processes Dashboard supports multiple operational and analytical use cases: | Use Case | Description | |-----------------------------------|-------------| | Troubleshoot host performance | Identify processes consuming excessive CPU or memory and understand their impact on host performance. | | Optimize resource utilization | Analyze process-level resource usage to improve workload distribution and system efficiency. | | Detect anomalous process activity | Detect unusual spikes in CPU, memory, or disk activity that may indicate misbehaving applications or potential security issues. | | Support capacity planning | Track long-term trends in process resource usage to inform infrastructure scaling and prevent performance degradation. |