


Feedback
Network
This dashboard provides insights into network performance across hosts by tracking bandwidth usage, packet counts, errors, and drops. It helps administrators identify high-traffic hosts, detect network issues, and maintain reliable connectivity.
Network Traffic Overview
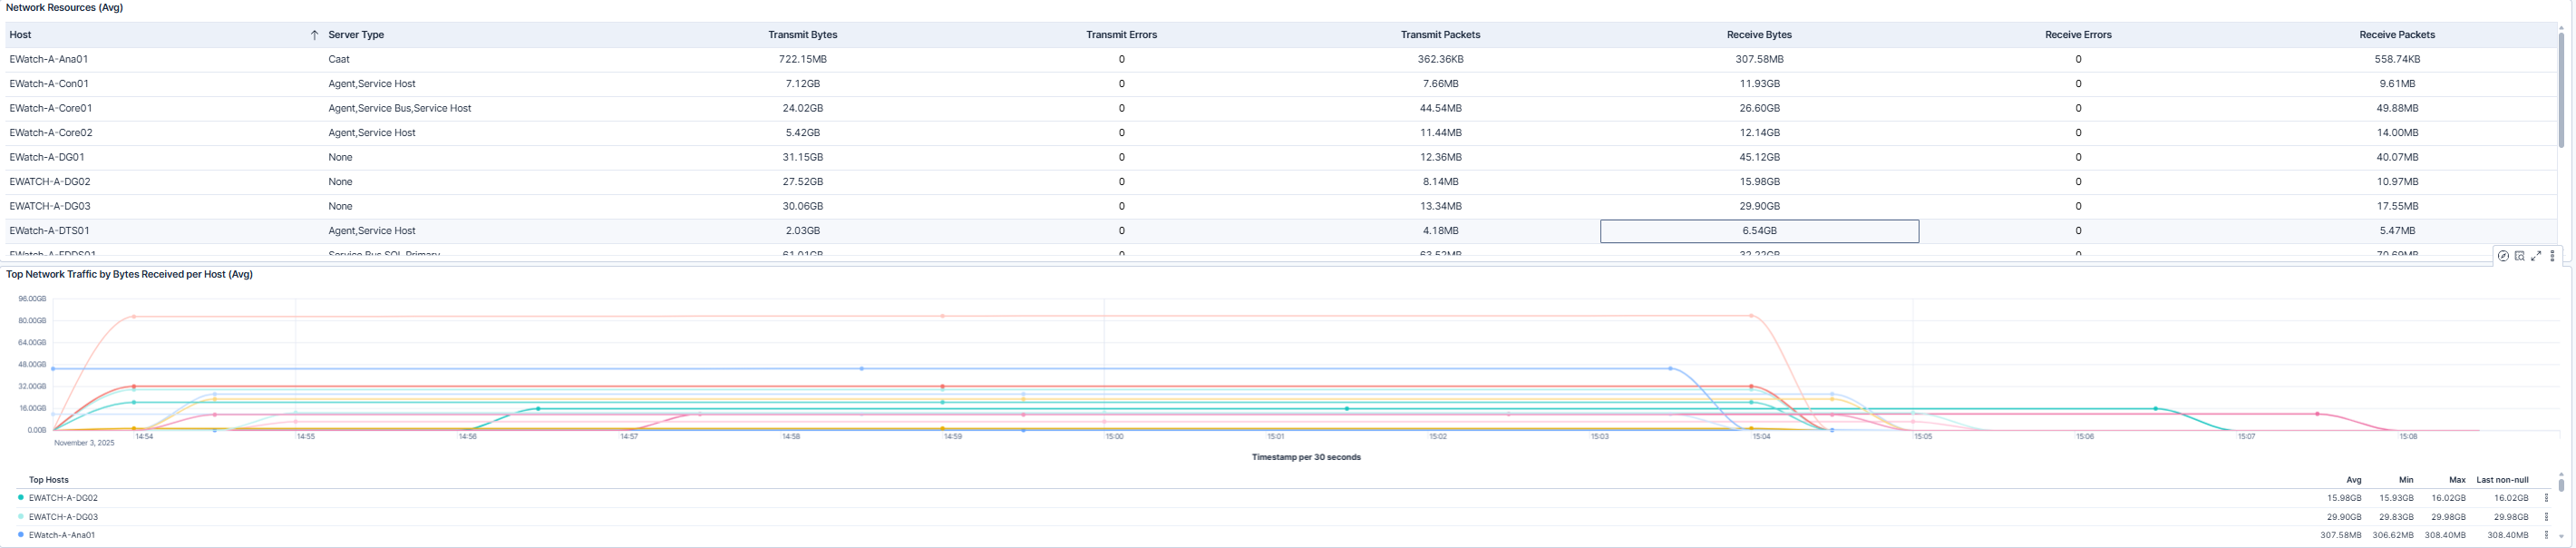
This dashboard provides an overview of network performance across all hosts. A summary table outlines average activity metrics—such as data sent and received, packet counts, and error rates—for each host and server type. Alongside it, a time-based graph visualizes which hosts are receiving the most network traffic, making it easy to identify trends, spikes, or systems experiencing unusually high inbound activity.
Transmit Traffic and Network Errors
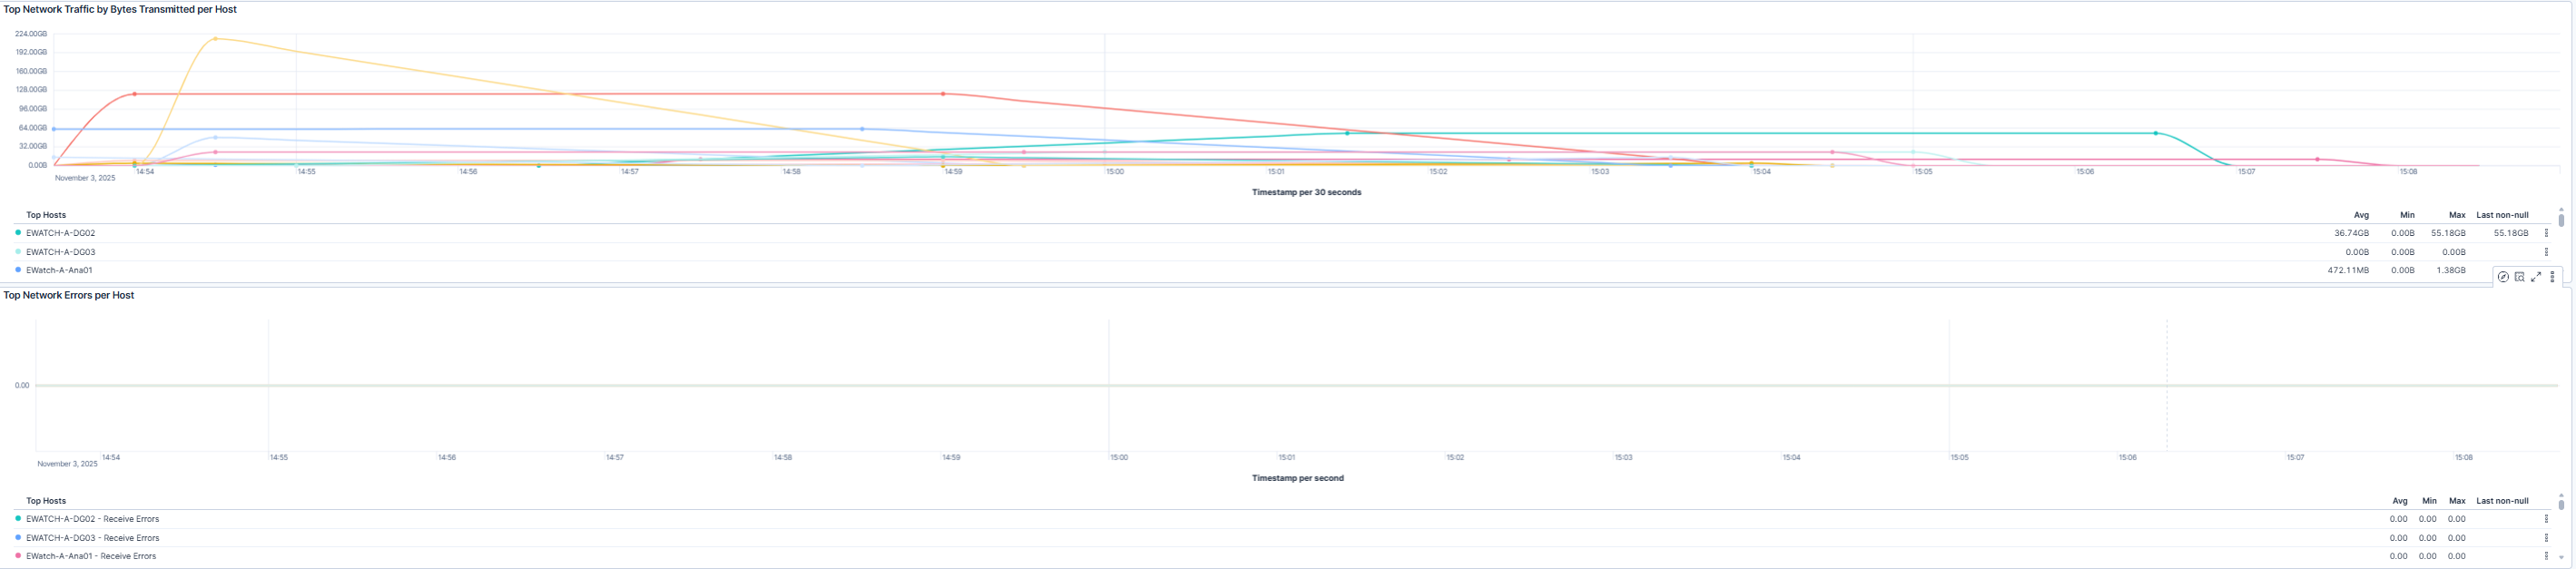
This dashbpard shows the top network activity by bytes transmitted per host and top network errors per host. The visualizations help administrators quickly detect hosts generating high outbound traffic and pinpoint sources of network errors affecting performance.
Use Cases
| Use Case | Description |
|---|---|
| Identify high-usage network hosts | Monitor inbound and outbound network traffic to identify high-usage hosts. |
| Address connectivity issues early | Track network errors and dropped packets to proactively address connectivity issues. |
| Detect abnormal network activity | Detect unusual network activity that may indicate misconfigurations or performance bottlenecks. |
| Plan and optimize network capacity | Analyze trends over time to optimize network performance and capacity planning. |