


Feedback
Kepler Services Overview
This dashboard provides a centralized view of service-level activity and performance within the Relativity environment. It tracks transaction rates, error counts, and request distribution across hosts and service applications, helping administrators monitor system health, validate service behavior, and identify potential bottlenecks. This dashboard is essential for operational monitoring, post-installation validation, and diagnosing issues related to Kepler service performance.
Kepler Transaction Summary and Distribution
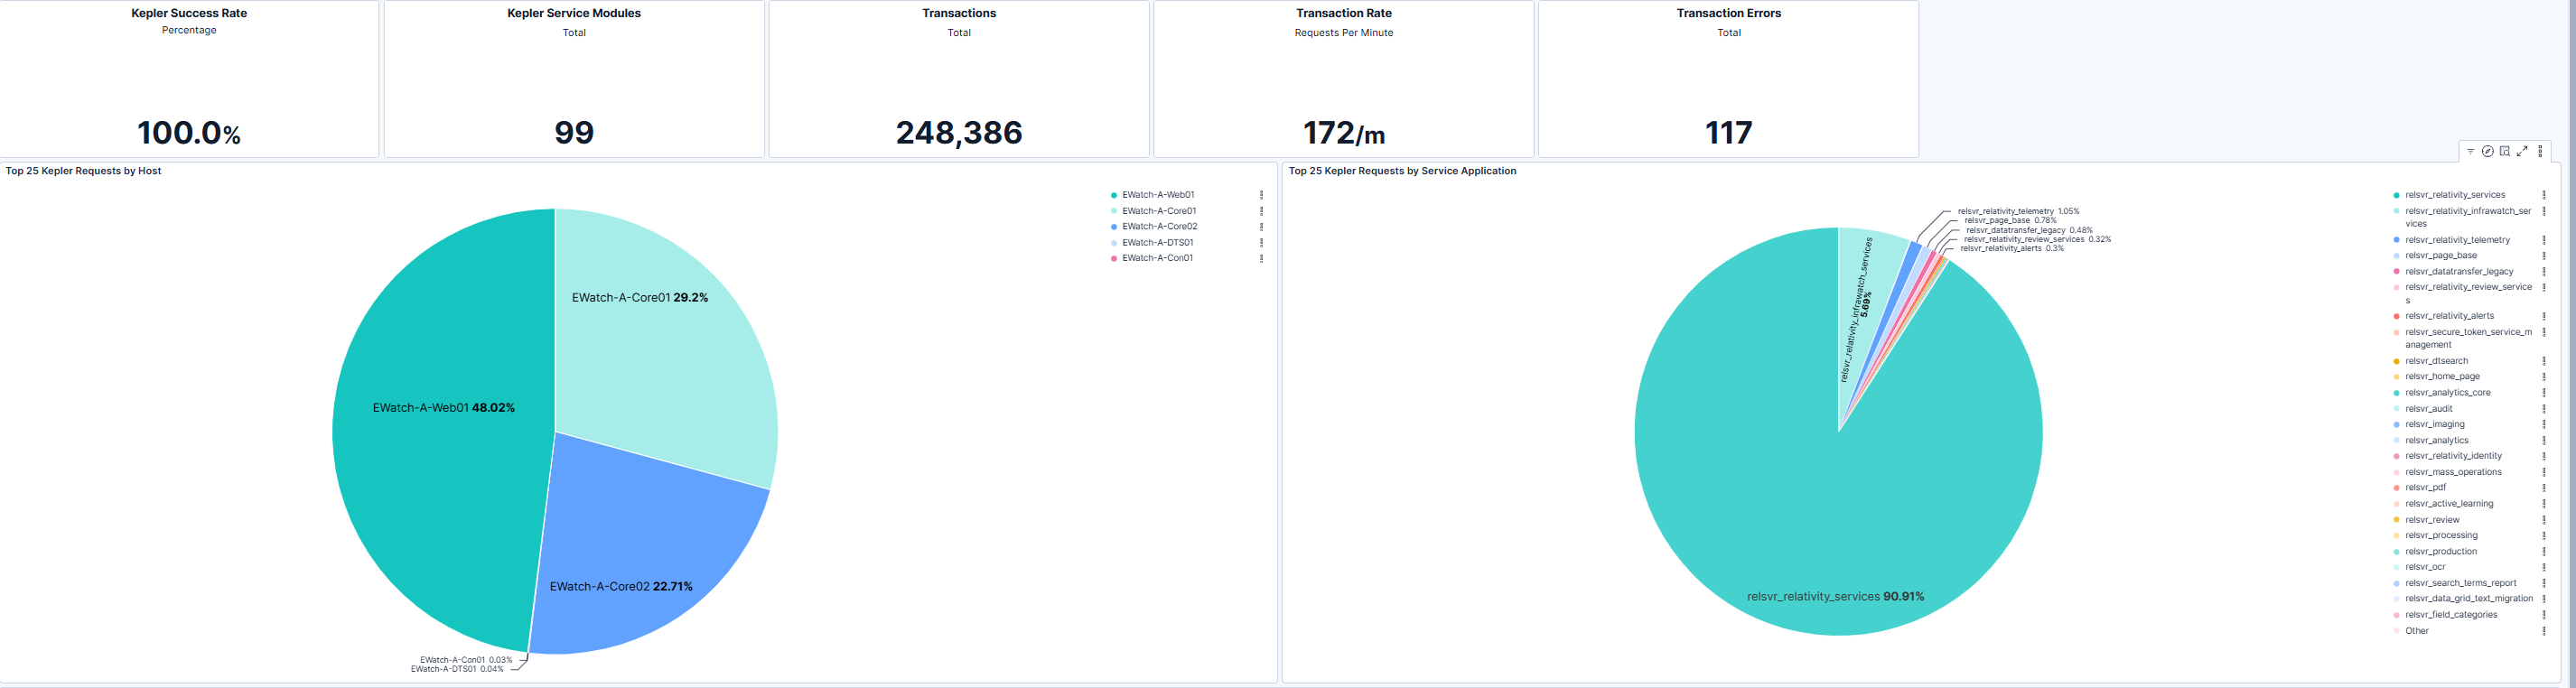
This section provides high-level metrics including success rate, total transactions, transaction rate per minute, and error counts. These indicators allow relativity administrators to quickly assess overall service reliability and throughput. The accompanying charts break down Kepler requests by host and by service application, enabling visibility into workload distribution and identifying which hosts or applications handle the largest share of requests. This insight supports capacity planning and helps detect imbalances or anomalies that may require attention.
Kepler Module Activity Over Time
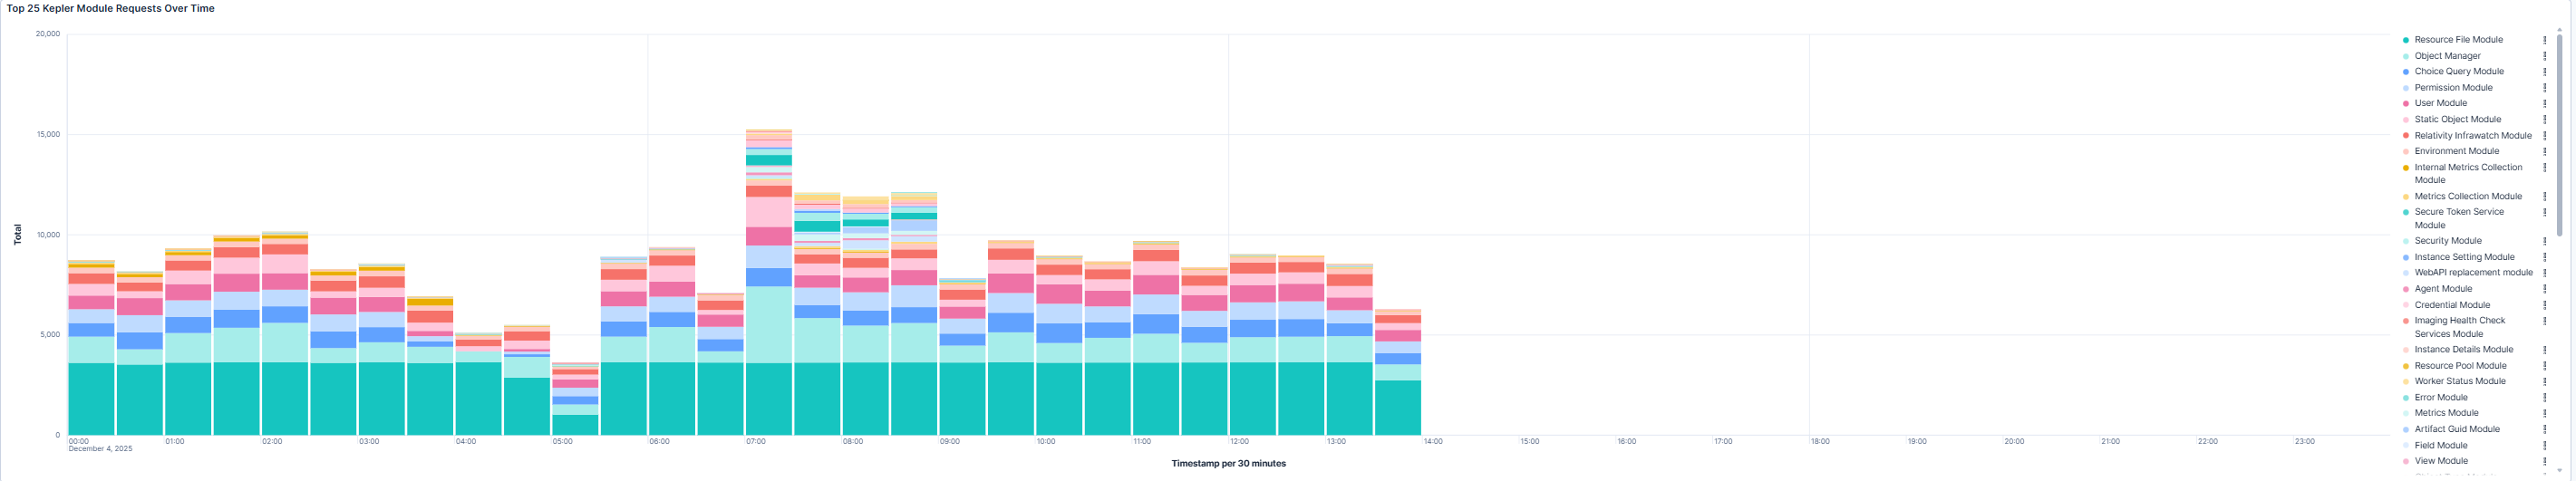
This section visualizes request volume trends for the top Kepler requestss over time. Monitoring these patterns helps relativity administrators understand workload fluctuations, identify peak activity periods, and correlate performance changes with system events or user activity. Consistent tracking of module-level requests supports proactive resource management and troubleshooting when performance issues arise.
Use Cases
| Use Case | Description |
|---|---|
| Validate Kepler service health | Confirm that Kepler services are processing requests successfully and within expected performance thresholds. |
| Monitor transaction activity | Track transaction rates and error counts to ensure reliable service operation and detect anomalies early. |
| Analyze workload distribution | Use host and application-level breakdowns to identify uneven request handling and optimize resource allocation. |
| Investigate performance issues | Leverage module-level trends to pinpoint which services or time periods correlate with performance degradation. |