


Feedback
Kepler Service Requests
This dashboard provides a granular insight into individual request activity within the Relativity environment. It highlights the most frequent requests, error occurrences, and transaction-level details, enabling relativity administrators to monitor performance, identify problematic endpoints, and troubleshoot issues efficiently. This dashboard is essential for deep-dive analysis when investigating service reliability or optimizing request handling.
Top Kepler Requests and Errors
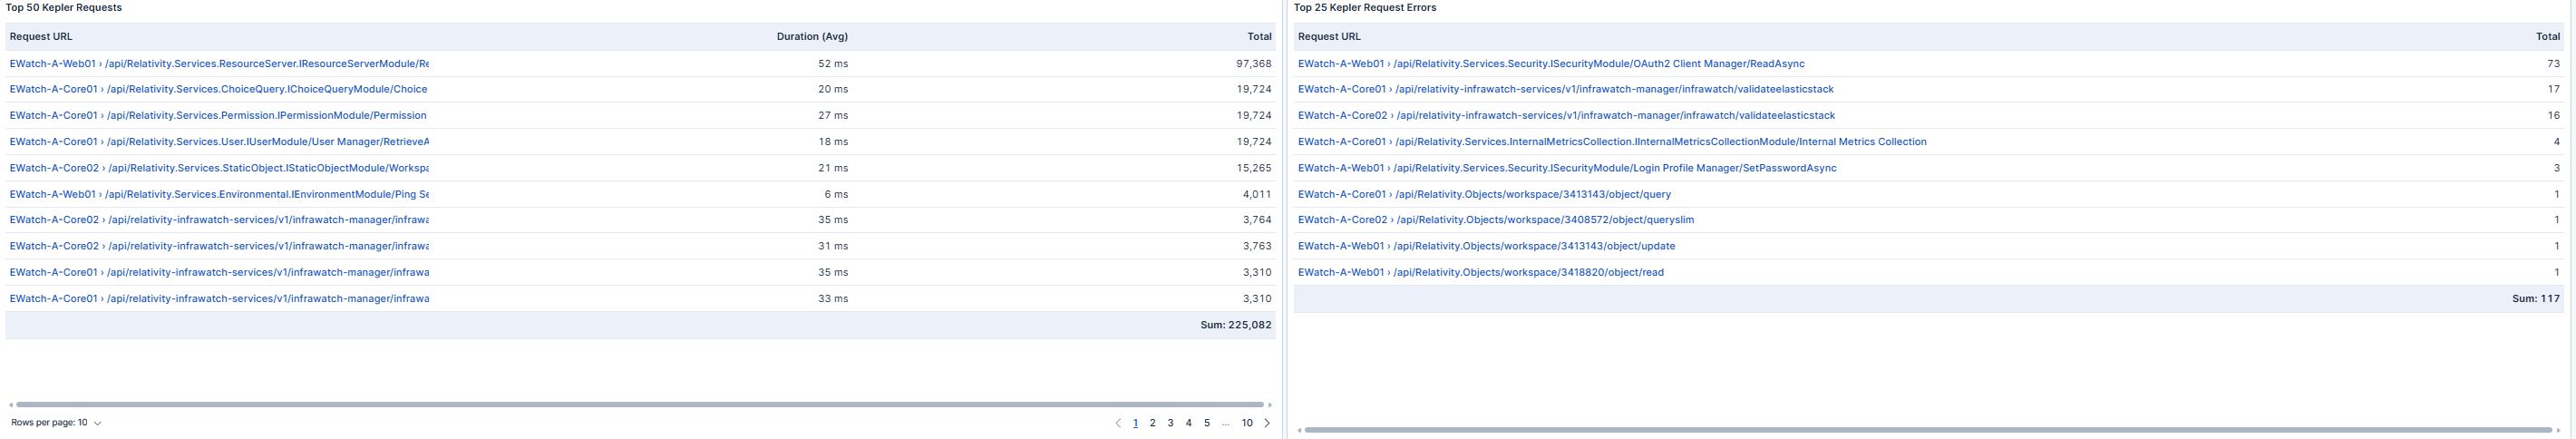
This section lists the most common Kepler requests by URL, along with their average duration and total execution count. These metrics help relativity administrators identify high-volume operations and assess whether response times align with expected performance benchmarks. The accompanying error summary highlights the endpoints generating the most failures, supporting targeted troubleshooting and prioritization of corrective actions.
Detailed Transaction Log
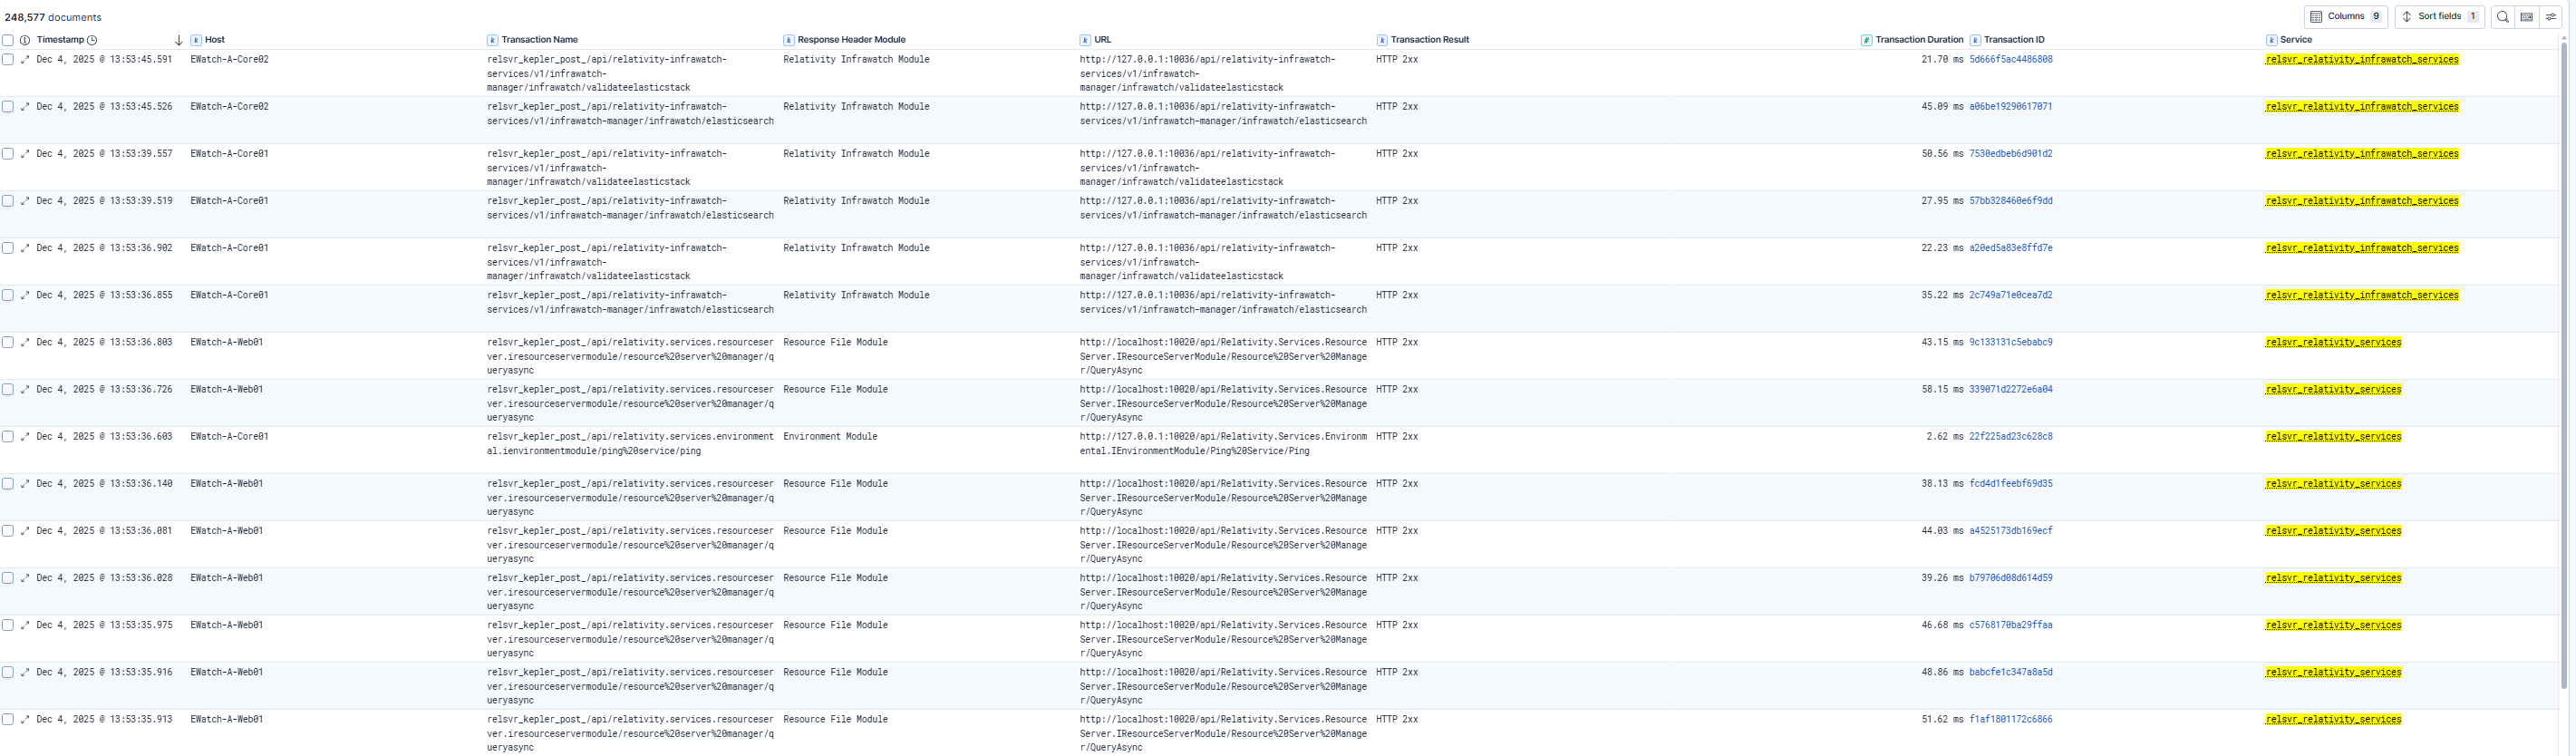
This section provides a comprehensive transaction-level view, including timestamps, request URLs, response times, and status codes. Relativity administrators can use this data to trace individual requests, correlate failures with specific modules or hosts, and validate whether service behavior matches operational expectations.
Use Cases
| Use Case | Description |
|---|---|
| Identify high-volume requests | Determine which endpoints handle the most traffic and evaluate their performance impact. |
| Troubleshoot errors | Pinpoint failing requests and analyze patterns to accelerate resolution. |
| Validate service performance | Review transaction durations and success rates to ensure services meet operational standards. |
| Perform root-cause analysis | Use detailed logs to investigate anomalies and correlate issues with system events or configurations. |