


Feedback
IIS Instance Overview
This dashboard provides detailed visibility into the performance and operational status of individual IIS (Internet Information Services) instances within your Relativity environment. It displays key metrics such as total requests, active threads, connections, and application pool uptime — allowing users to assess server responsiveness and resource utilization at a granular level.
IIS Instance Performance and Application Pool Details
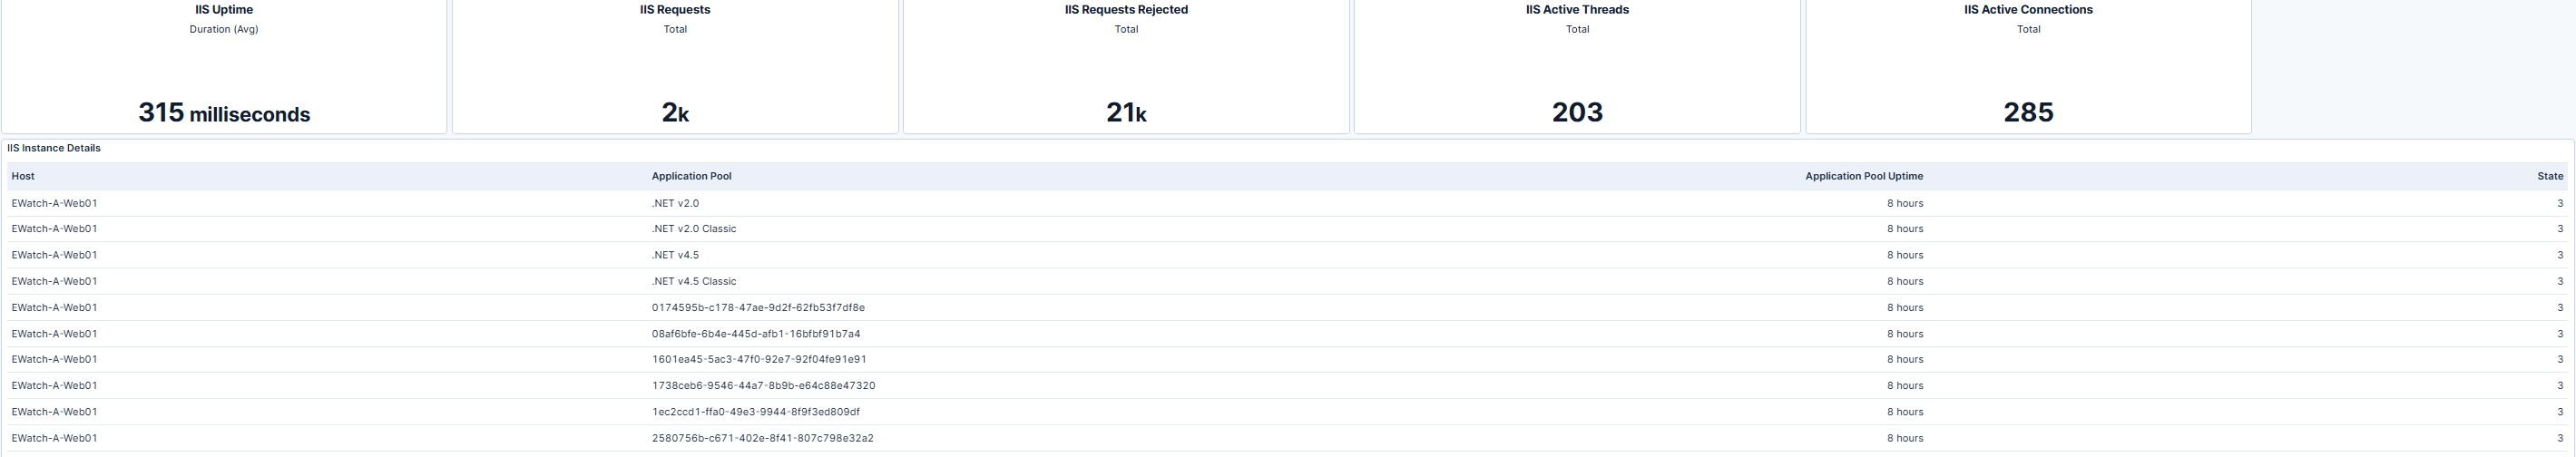
The IIS Instance Overview dashboard provides environment-wide metrics — including IIS uptime, IIS Requests, and IIS requests rejected, IIS active threads, and IIS active connections — to help administrators assess web server responsiveness. Below these summary metrics, detailed information for each application pool shows uptime, host, and state, helping verify that all pools are active and stable.
Use Cases
| Use Case | Description |
|---|---|
| Monitor application pool health | Verify that all IIS application pools are running and stable. Review uptime and state to detect pools that have restarted unexpectedly or are unresponsive. |
| Troubleshoot request handling issues | Analyze total and rejected request counts to determine if IIS instances are overloaded or misconfigured when users report web interface delays or errors. |
| Validate post-deployment performance | After installing or updating Relativity components, confirm that IIS instances and application pools are processing requests normally and maintaining expected uptime. |
| Optimize web server resources | Track thread and connection counts to assess workload handling efficiency, supporting scaling, load balancing, or hardware planning. |