


Feedback
Alerts Overview
This dashboard provides a centralized view of the health status across all Relativity feature domains. It highlights whether any active alerts exist within each domain, helping administrators quickly identify areas that require attention. This dashboard serves as the main landing page for Environment Watch, supporting proactive monitoring and system health validation. It provides immediate insight into the overall state of the Relativity environment, enabling quick identification of problem areas without navigating multiple dashboards.
Alerts Overview Dashboard
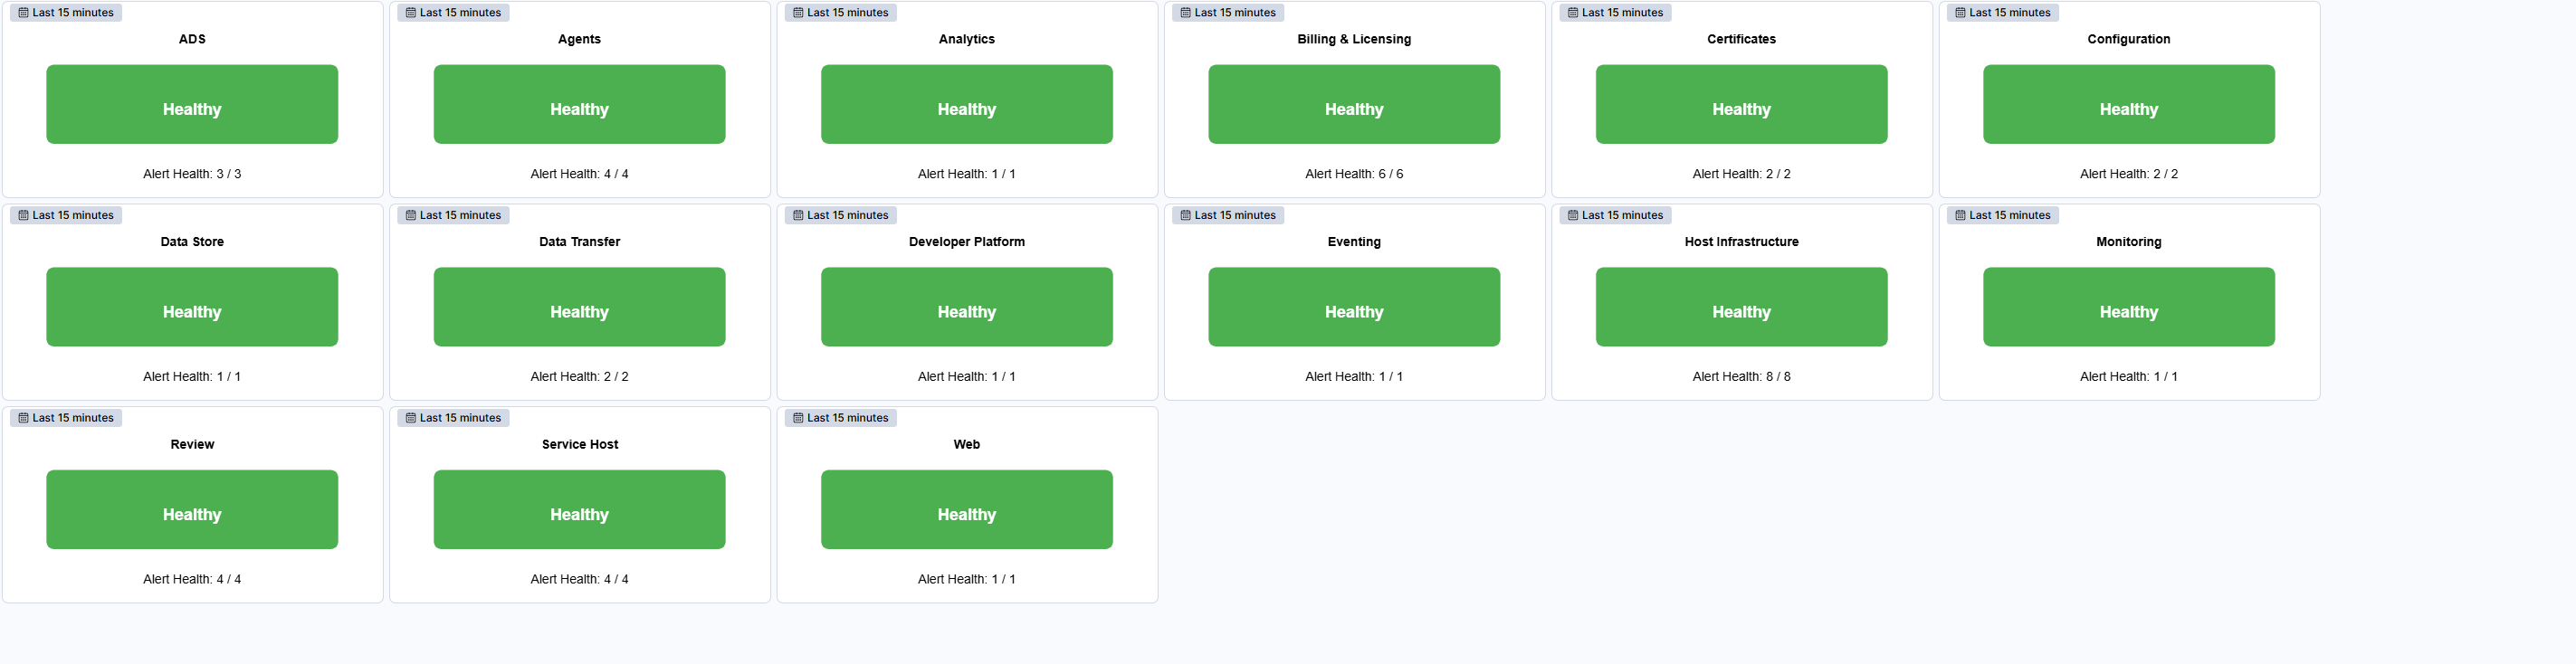
This dashboard shows the system's health status: a green Healthy indicator means there are no active alerts, while a red Unhealthy indicator signals alerts that require attention. Each health indicator also displays the number of active alerts, helping administrators quickly understand the overall health of the environment and focus on areas that require action without navigating through multiple dashboards.
Use Cases
| Use Case | Description |
|---|---|
| Rapid health assessment | Confirm the overall health of the Relativity environment at a glance and identify domains with active alerts. |
| Prioritize troubleshooting | Focus investigation on domains marked as Unhealthy to resolve issues before they impact performance or user experience. |
| Validate post-installation status | Verify that all feature domains function correctly after upgrades or deployments by checking for active alerts. |
| Continuous monitoring | Use the dashboard during daily operational checks to maintain system stability and prevent outages. |