


Feedback
Commonly-used dashboards
This topic provides recommendations for the fields to group by and pivot on to create some commonly used dashboards in your case life cycle.
With these dashboards, you and your case team will be better equipped to explore and prioritize your review, identify patterns and trends across custodians, and develop better review strategies with real-time insight.
Use the examples described below to generate ideas for dashboards you may want to create in your cases.
Note the following:
- The fields described here may differ in name than what you see in your workspace.
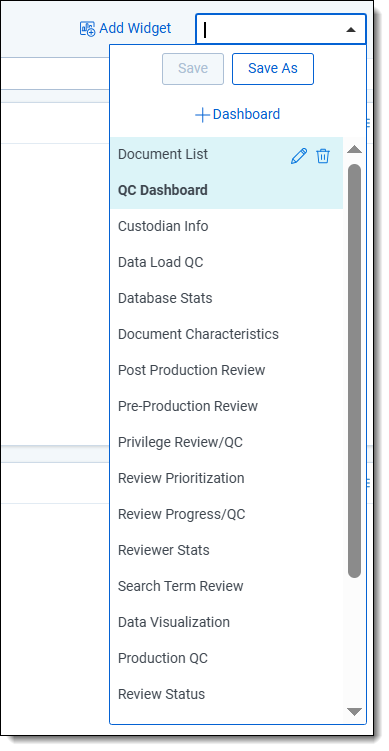
- When adding a widget, you cannot select fields that have not been enabled for pivot on or group by; you must manually enable those fields in order to select them. If those fields are part of a locked application, you must unlock it in order to edit them.
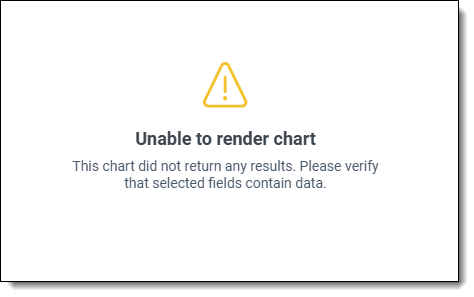
- A widget will not render if the included fields do not contain any data. For example, if you attempt to create an STR-based dashboard without having run STR on key terms, you will see the following:
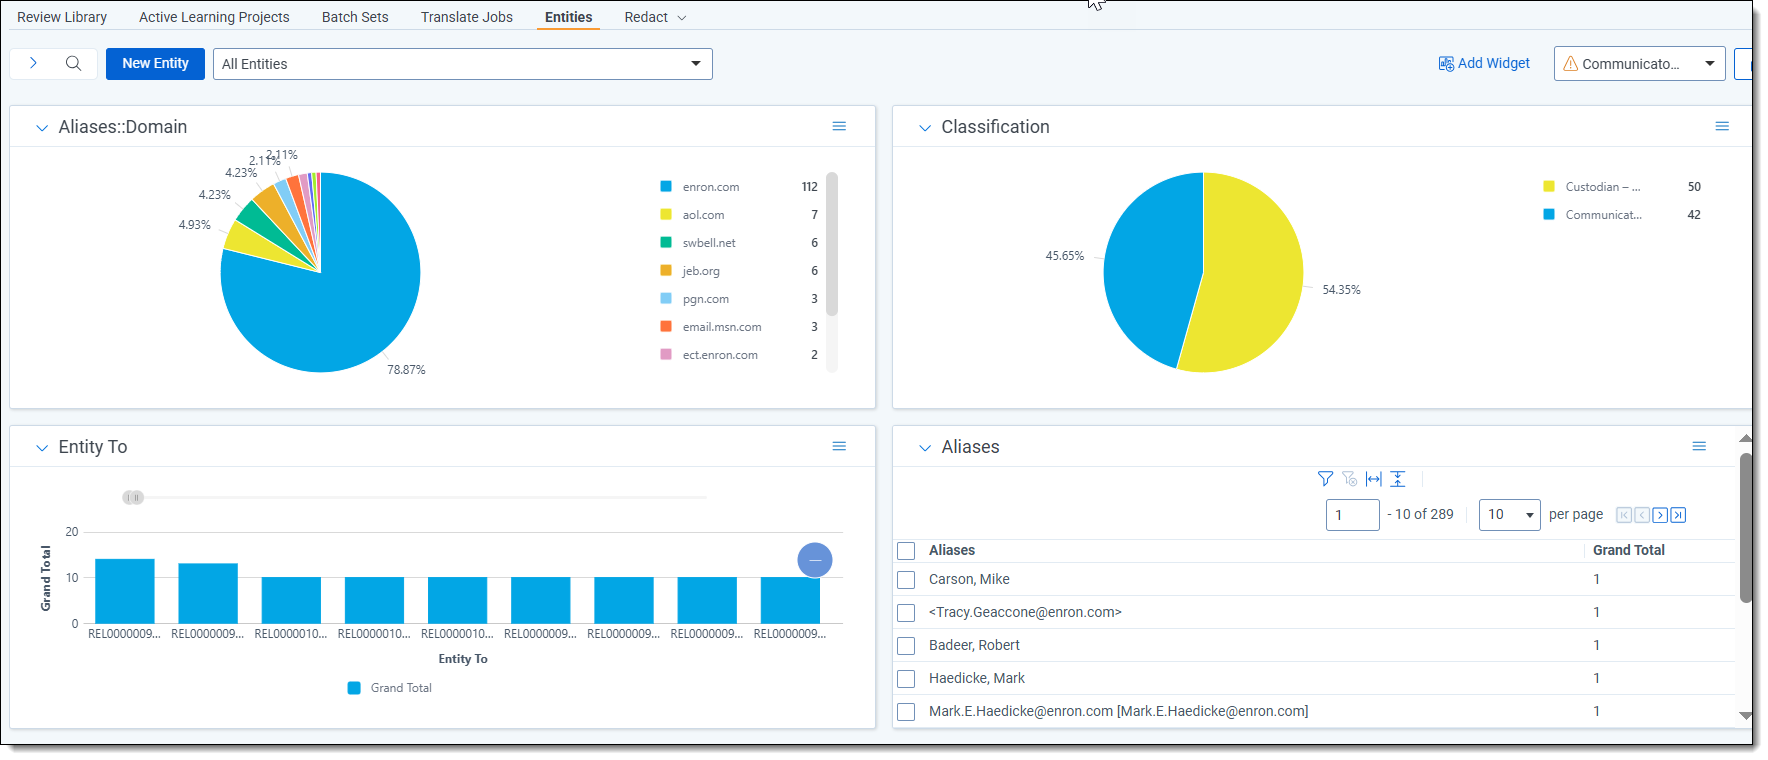
Communicators
If you've run name normalization and want to create a Communicators dashboard within the Entities tab, group by and pivot on the following fields:
- Group by Aliases: Domain
- Group by Aliases
- Group by Classification
- Group by Entity To
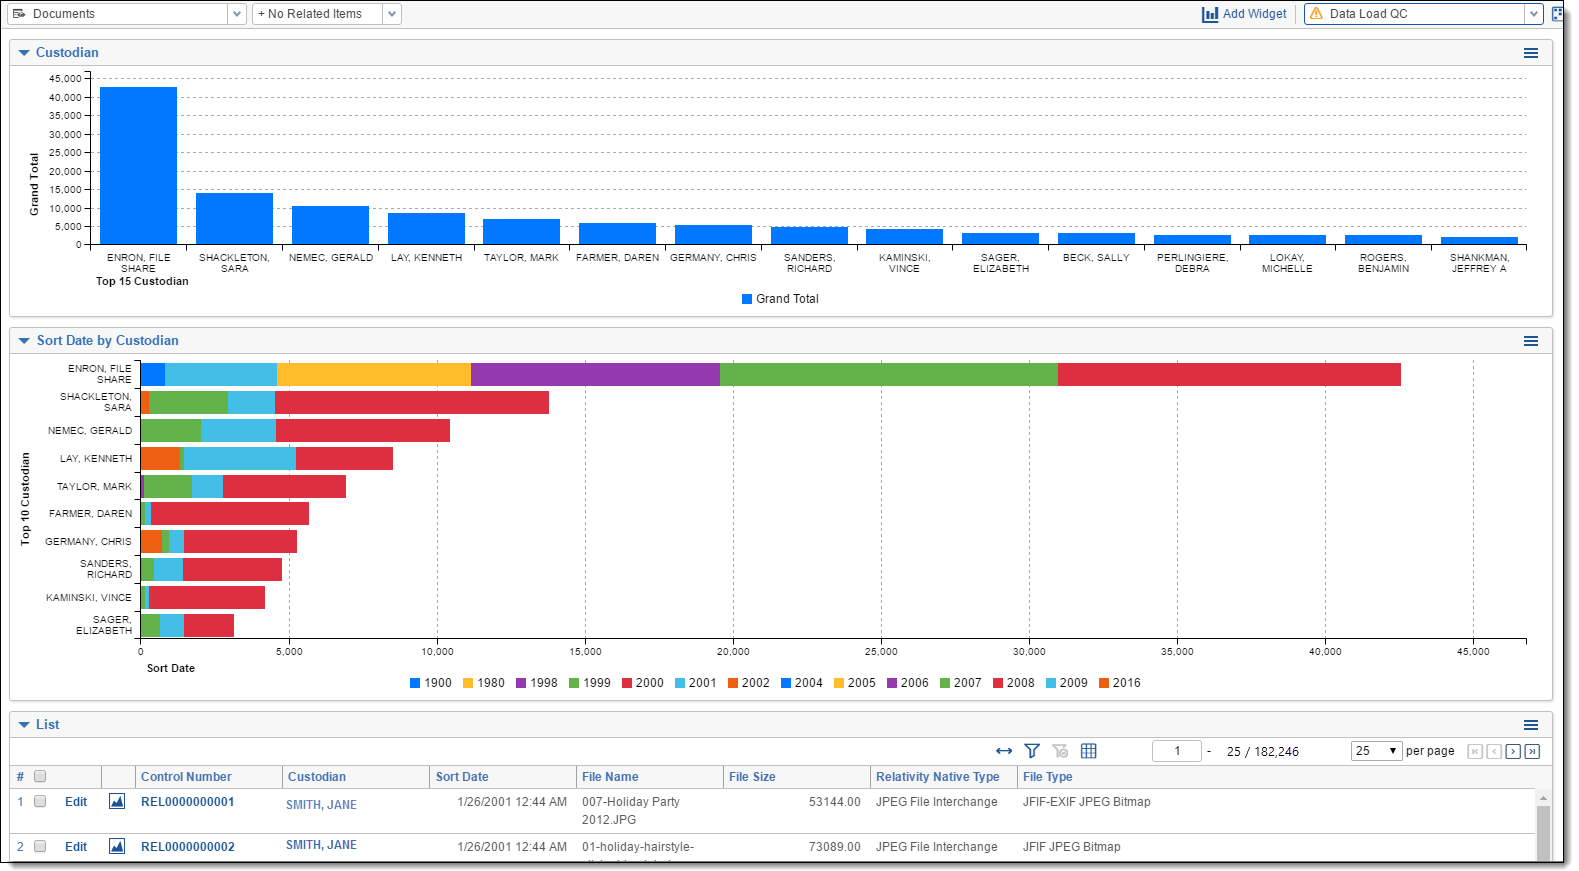
Data Load QC
To create the Data Load QC dashboard, group by and pivot on the following fields:
- Group by Custodian
- Group by Custodian and pivot on Sort Date (Year)
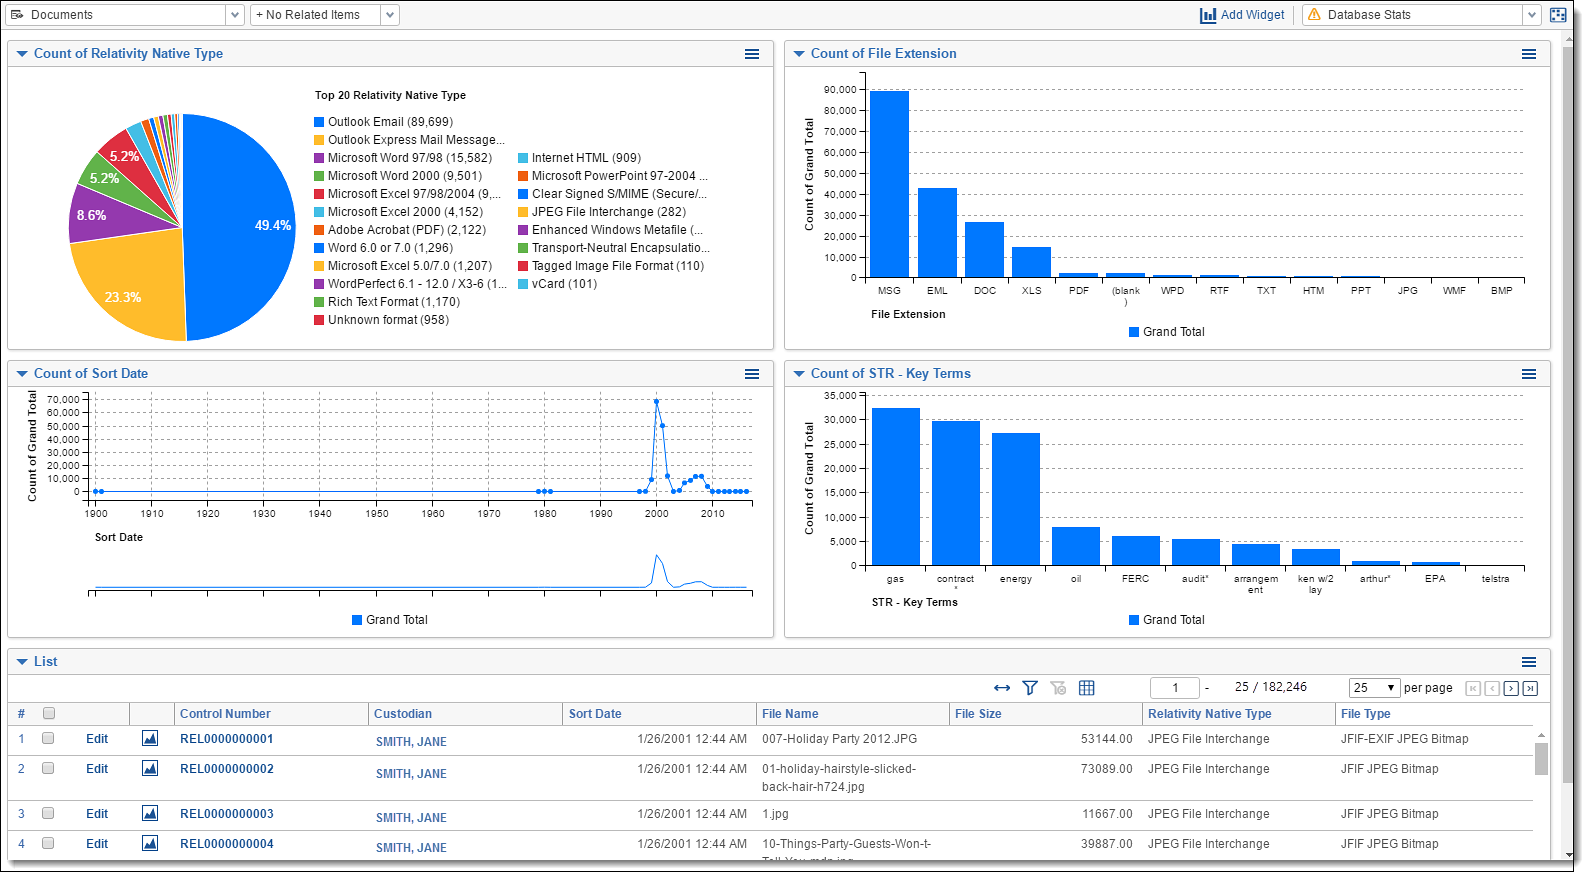
Database Stats
To create the Database Stats dashboard, group by and pivot on the following fields:
- Group by Native Type
- Group by Extension
- Group by Sort Date
- Group by Key Term STR
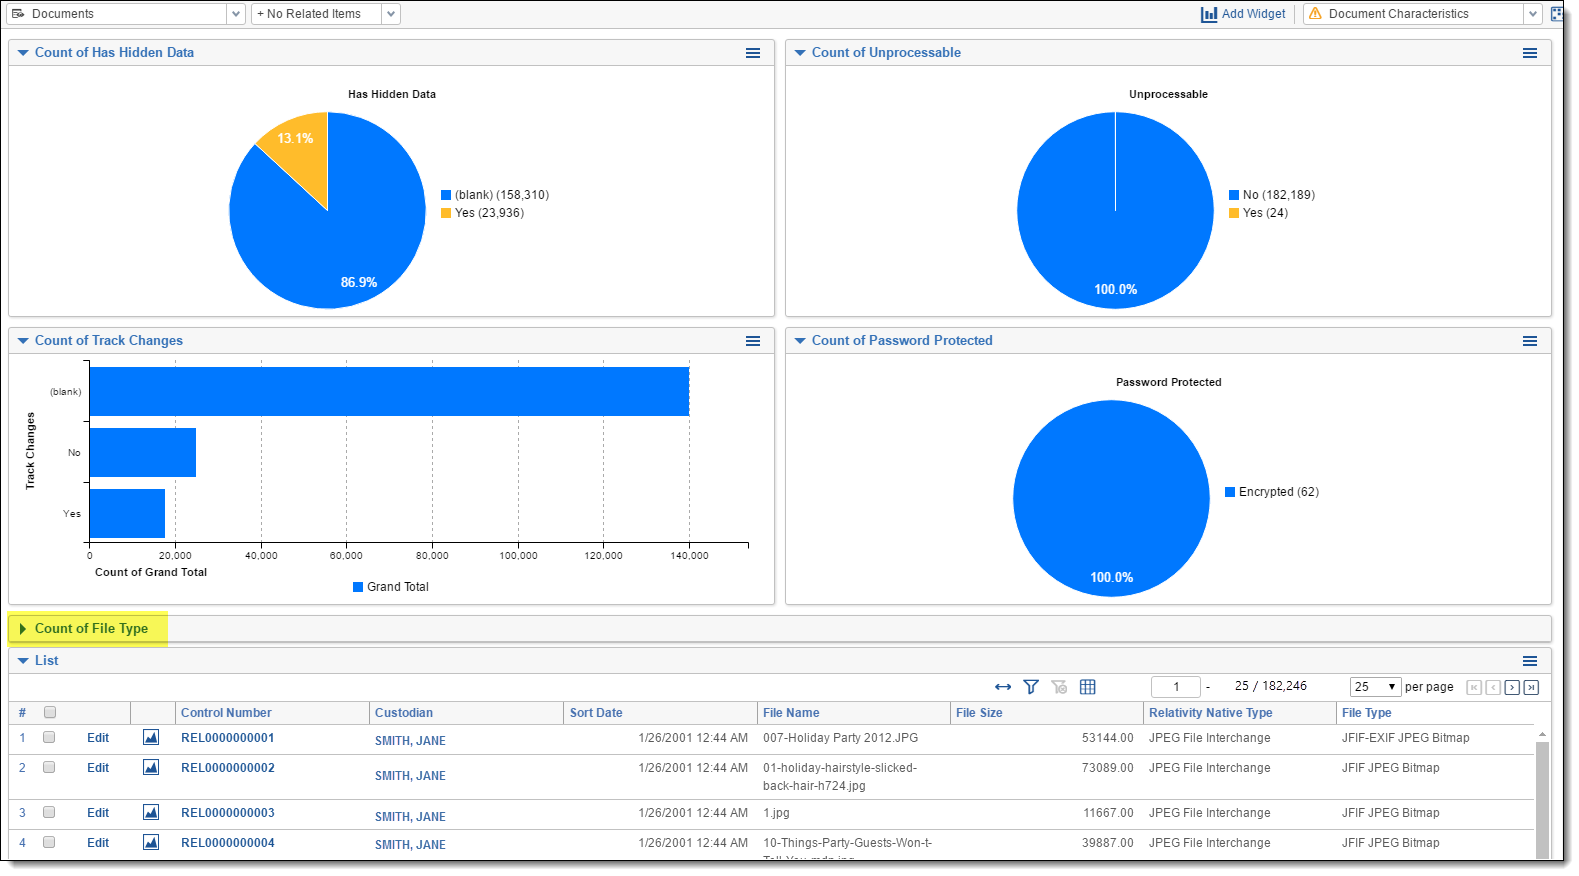
Document Characteristics
To create the Document Characteristics dashboard, group by and pivot on the following fields:
- Group by Unprocessable
- Group by Track Changes
- Group by Password Protected
- Group by File Type
- Group by Has Hidden Data - this widget is collapsed in the dashboard example below.
You can collapse your widgets, as seen in Has Hidden Data below. If you save your dashboard with a widget collapsed, it will remain collapsed.
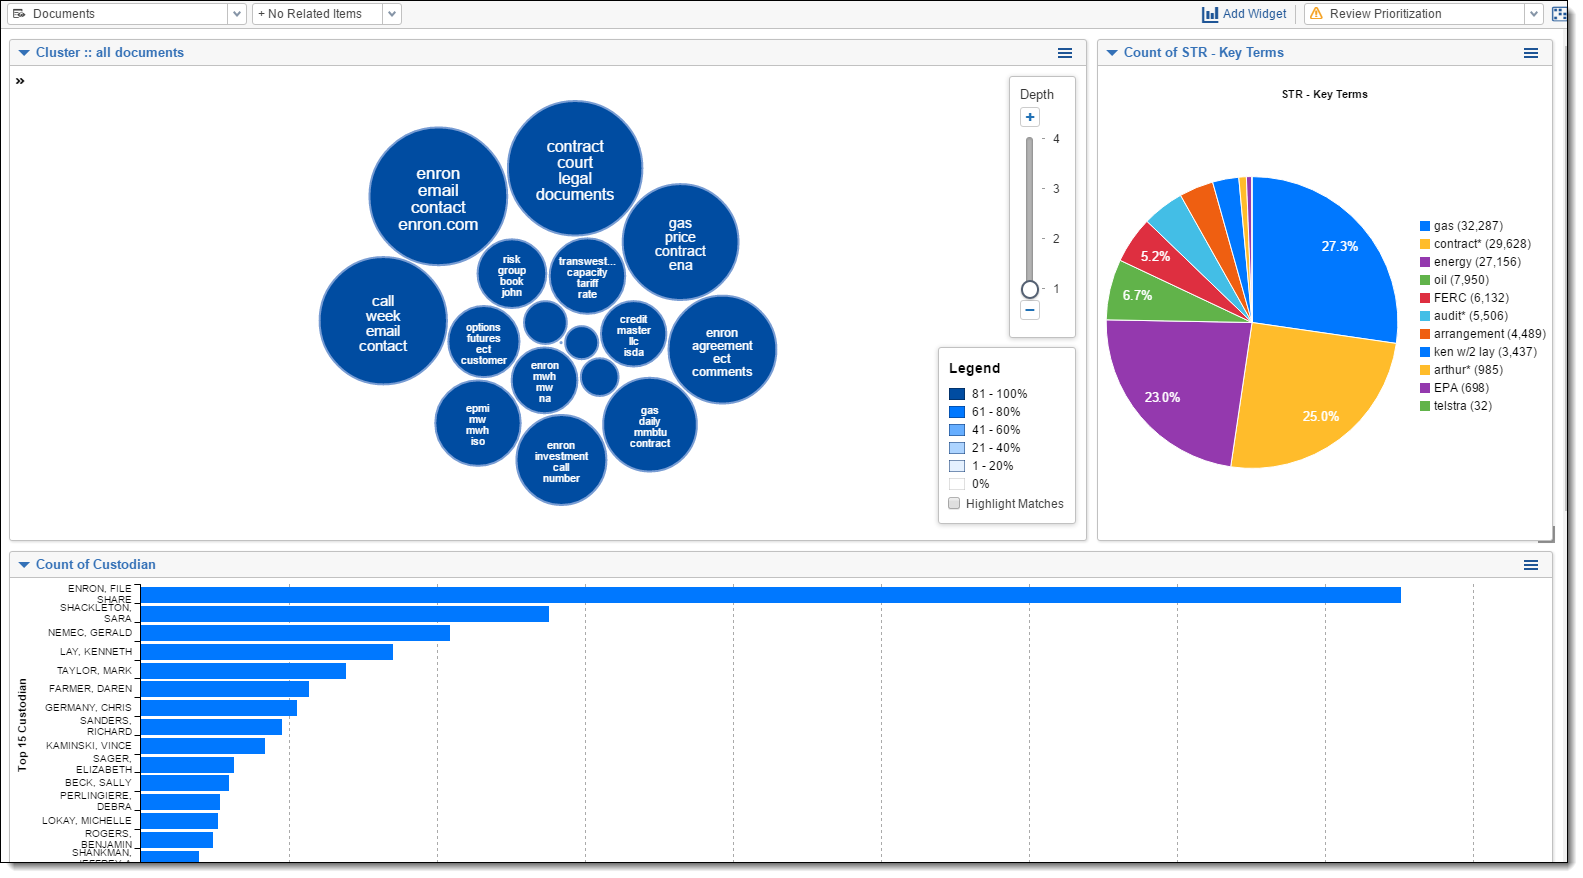
Review Prioritization
To create the Review Prioritization dashboard, group by and pivot on the following fields:
- Cluster Visualization Widget
- Group by Key Term STR
- Group by Custodian
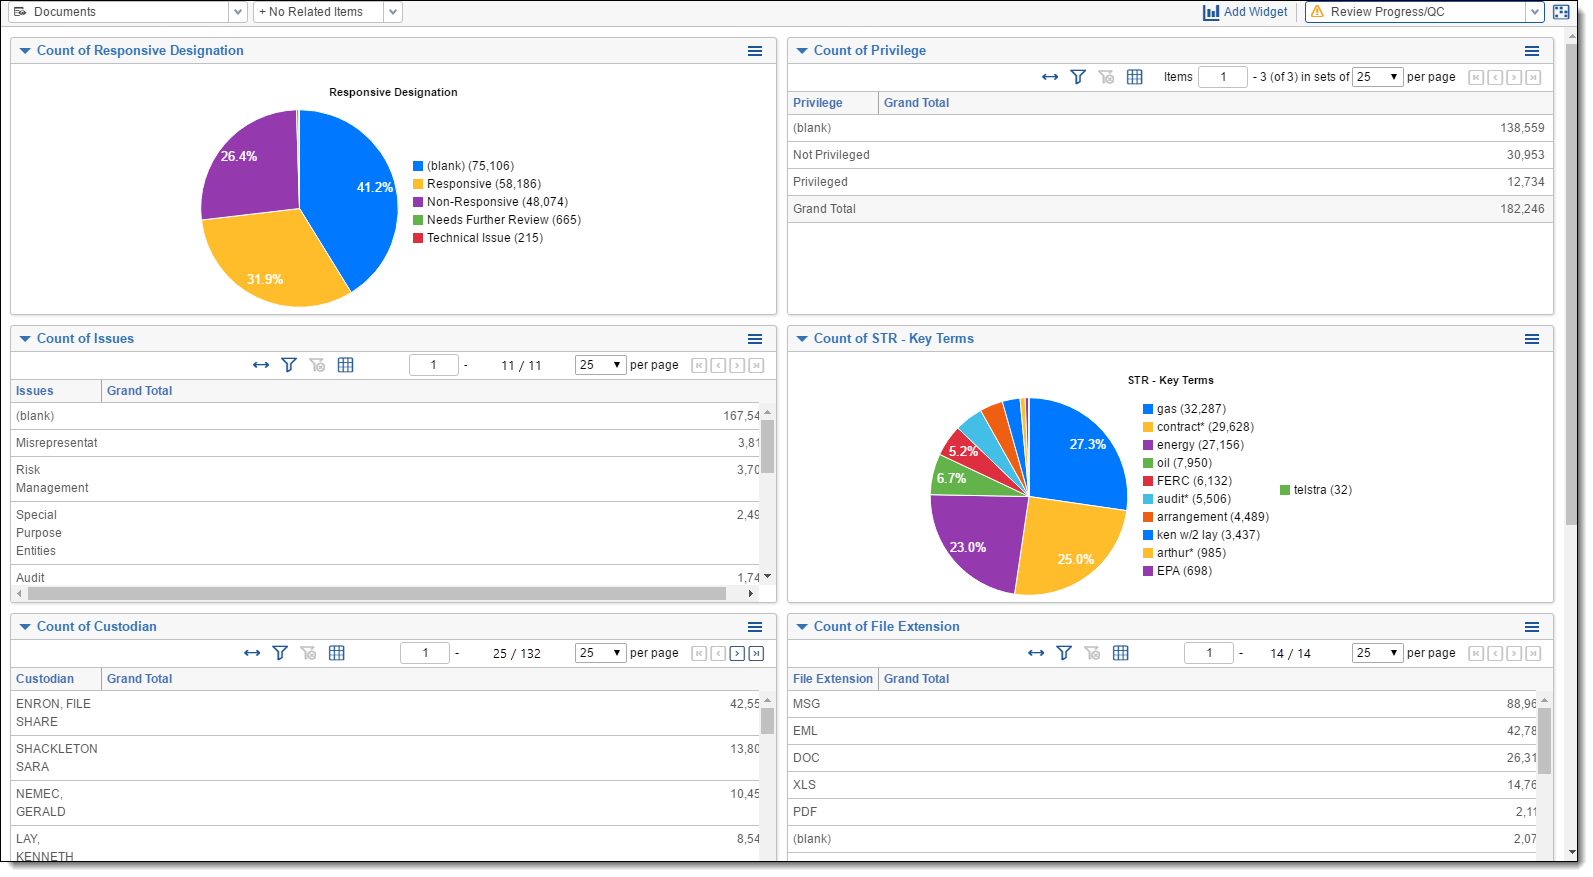
Review Progress/QC
To create the Review Progress/QC dashboard, group by and pivot on the following fields:
- Group by Responsive Designation
- Group by Privilege
- Group by Issues
- Group by Key Term STR
- Group by Custodian
- Group by File Extension
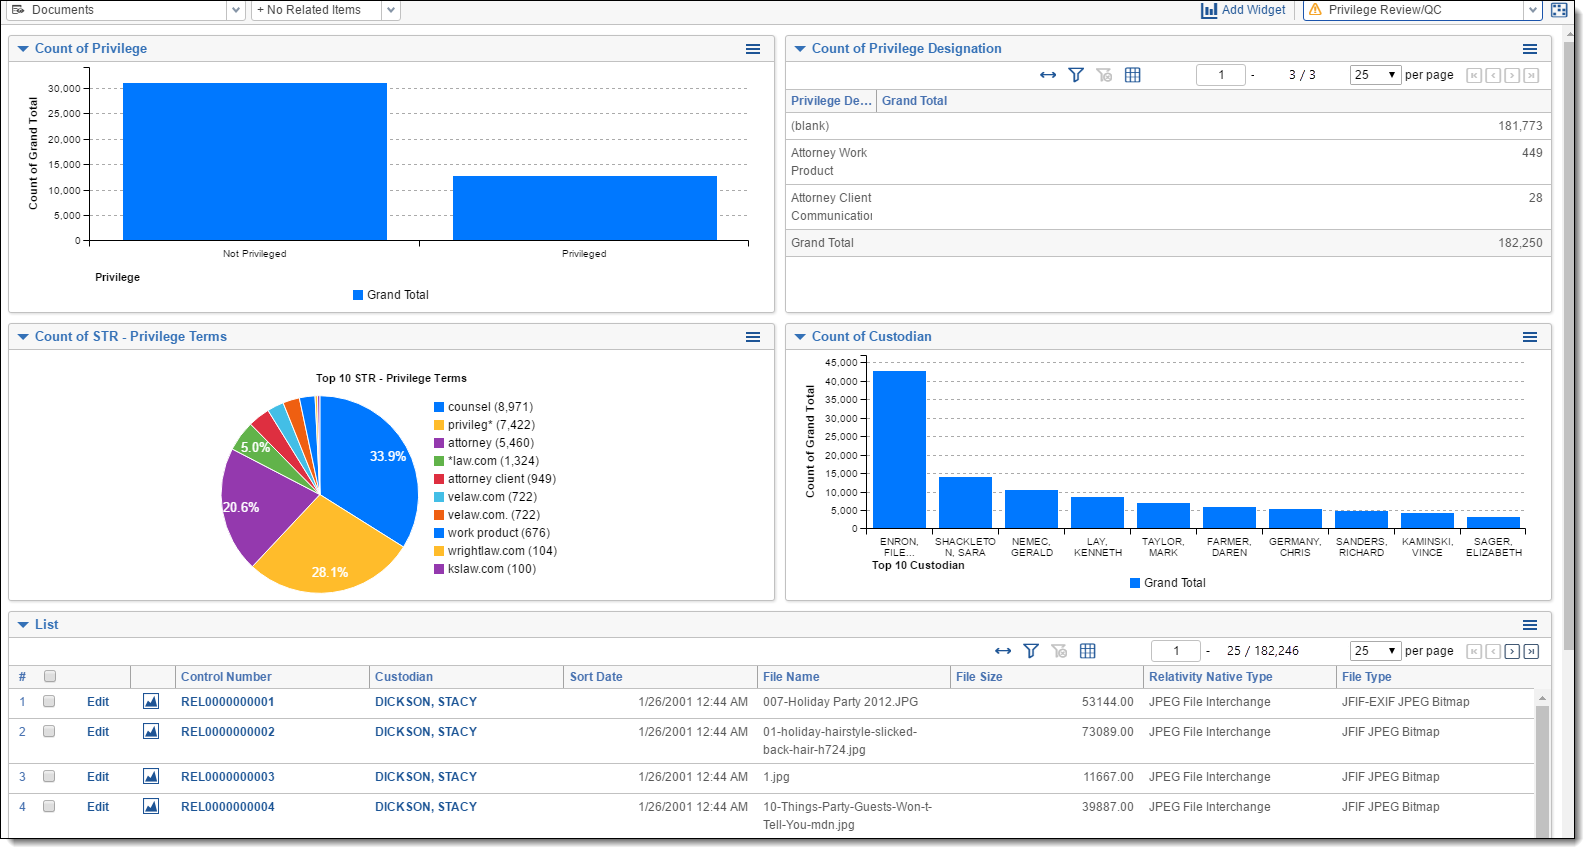
Privilege Review/QC
To create the Privilege Review/QC dashboard, group by and pivot on the following fields:
- Group by Privilege
- Group by Privilege Designation
- Group by Privilege Terms STR
- Group by Custodian
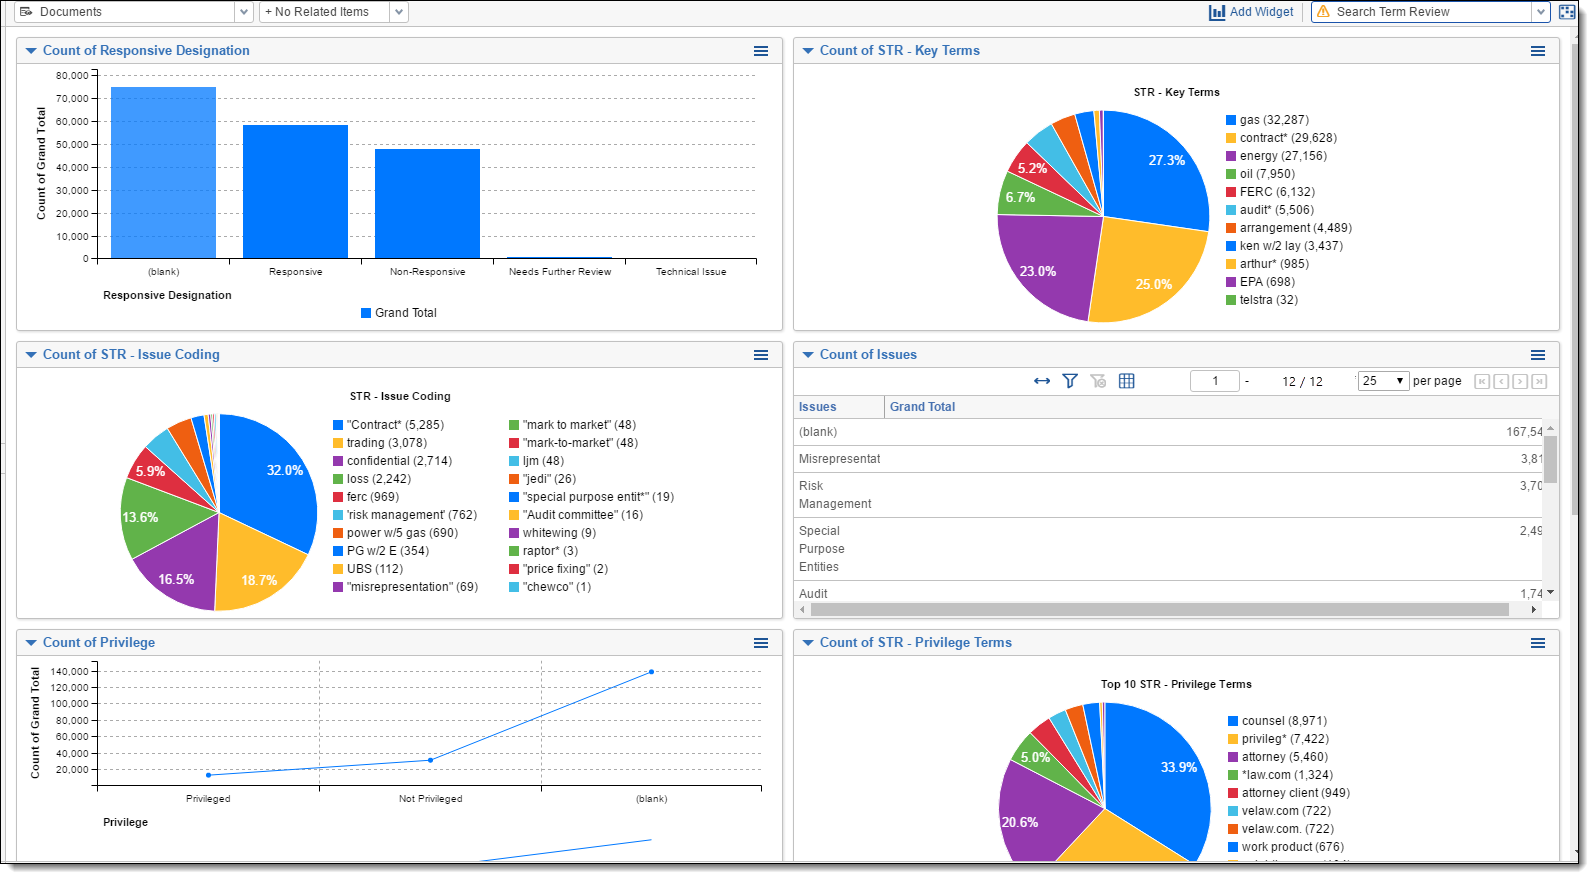
Search Term Review
To create the Search Term Review dashboard, group by and pivot on the following fields:
- Group by Responsive Designation
- Group by Key Term STR
- Group by Issue Coding STR
- Group by Issues
- Group by Privilege
- Group by Privilege Terms STR
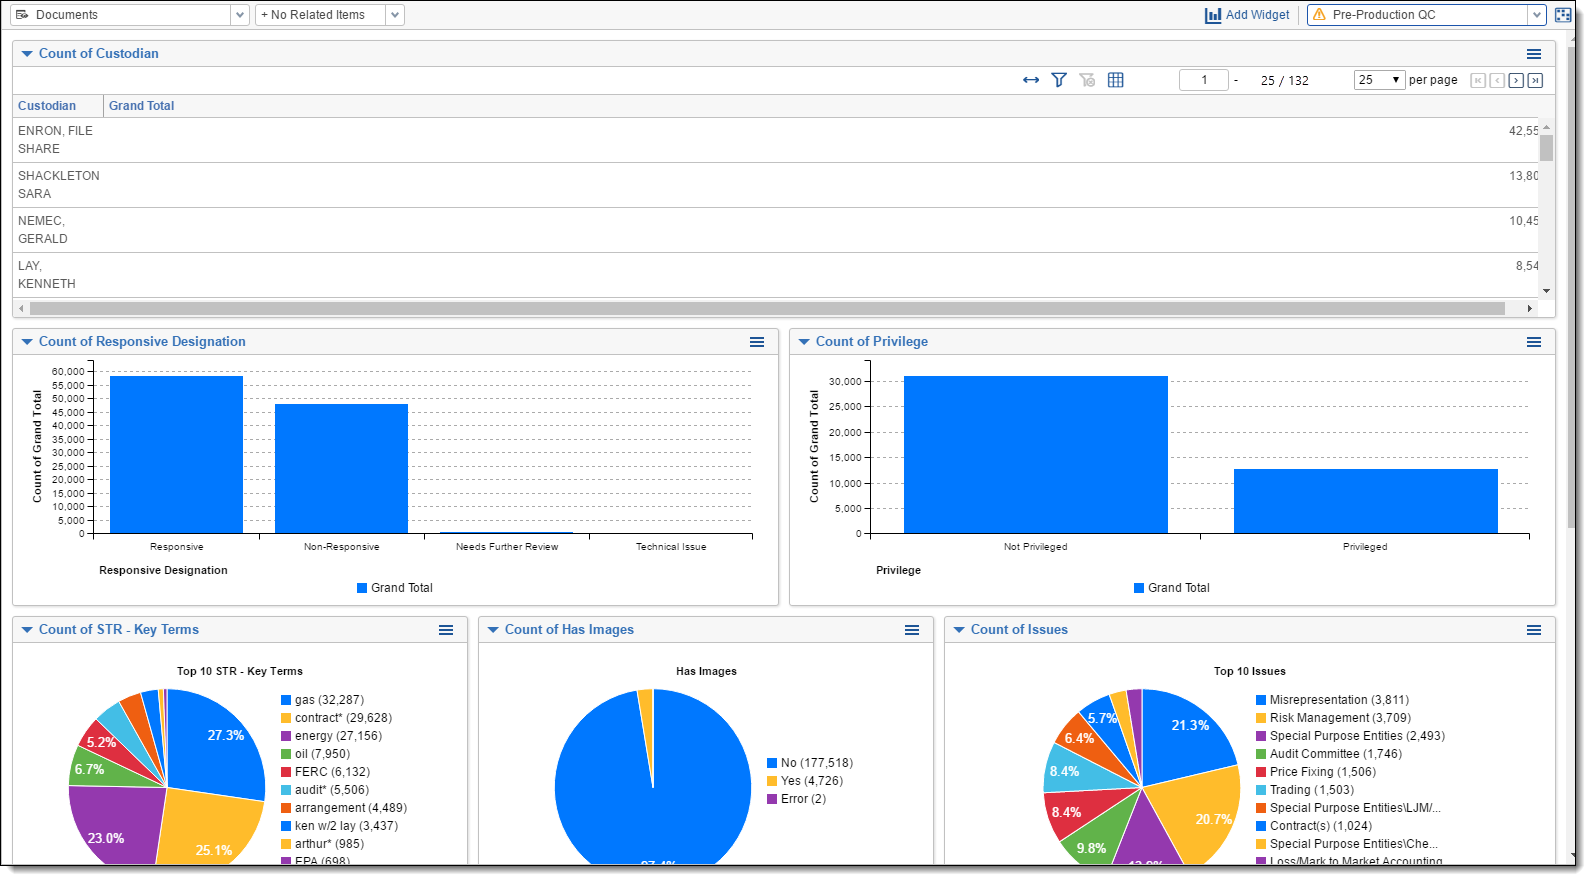
Pre-Production QC
The production fields in your environment may not be enabled for group by/pivot on, and you may be unable to manually enable them if the application is locked.
To create the Pre-Production QC dashboard, group by and pivot on the following fields:
- Group by Custodian
- Group by Responsive Designation
- Group by Privilege
- Group by Key Term STR
- Group by Has Images
- Group by Issues
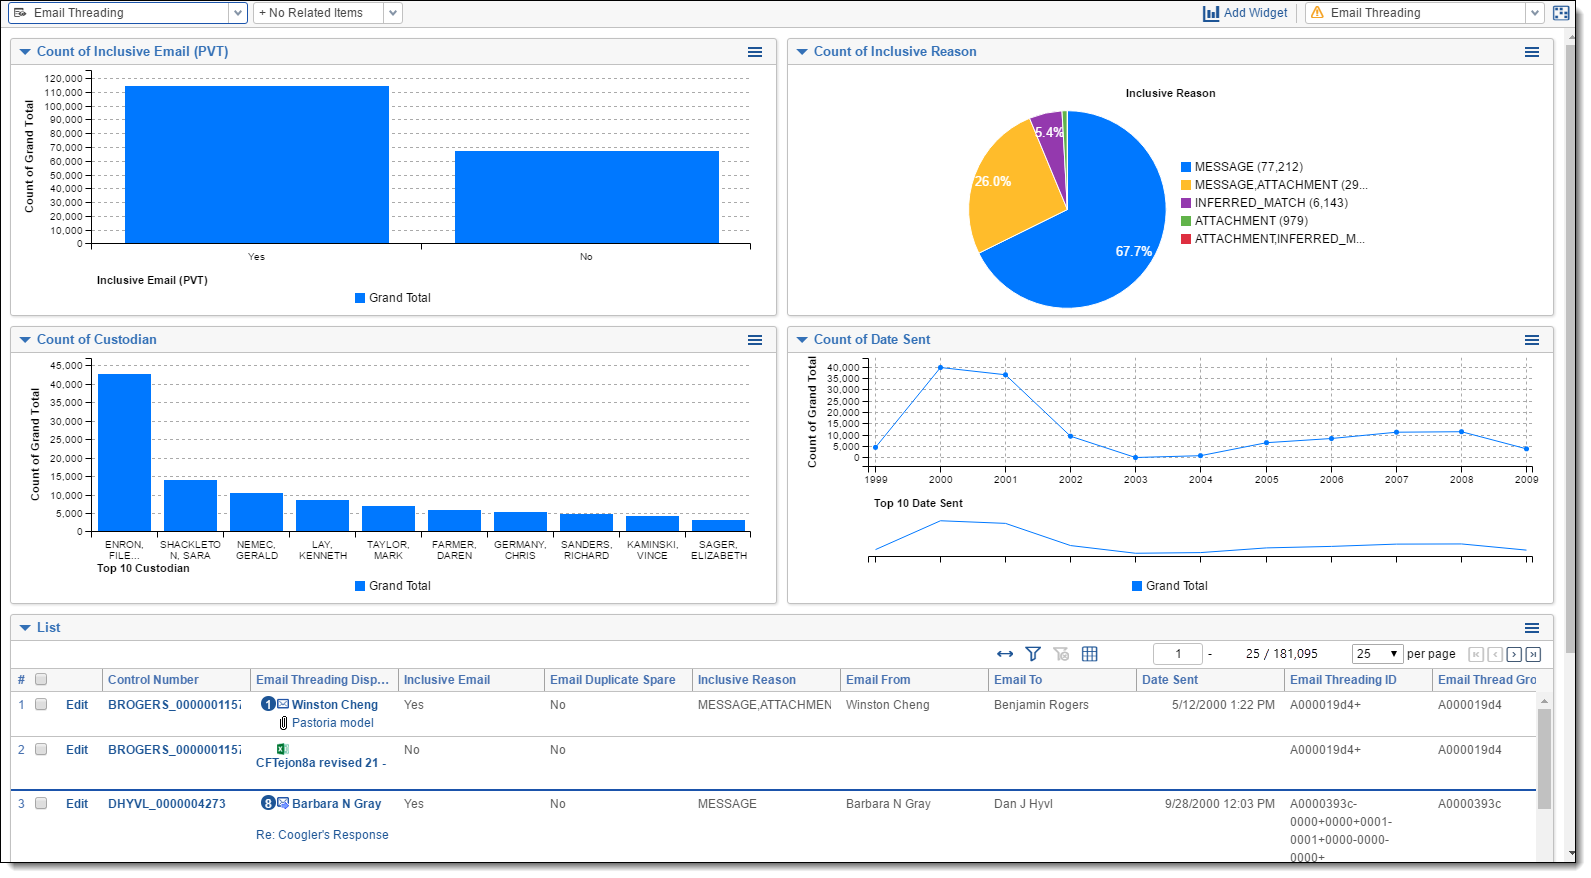
Email Threading
To create the Email Threading dashboard, group by and pivot on the following fields:
- Group by Inclusive Email
- Group by Inclusive Reason
- Group by Custodian
- Group by Date Sent (year)
We recommend using your Email Threading view with this dashboard.
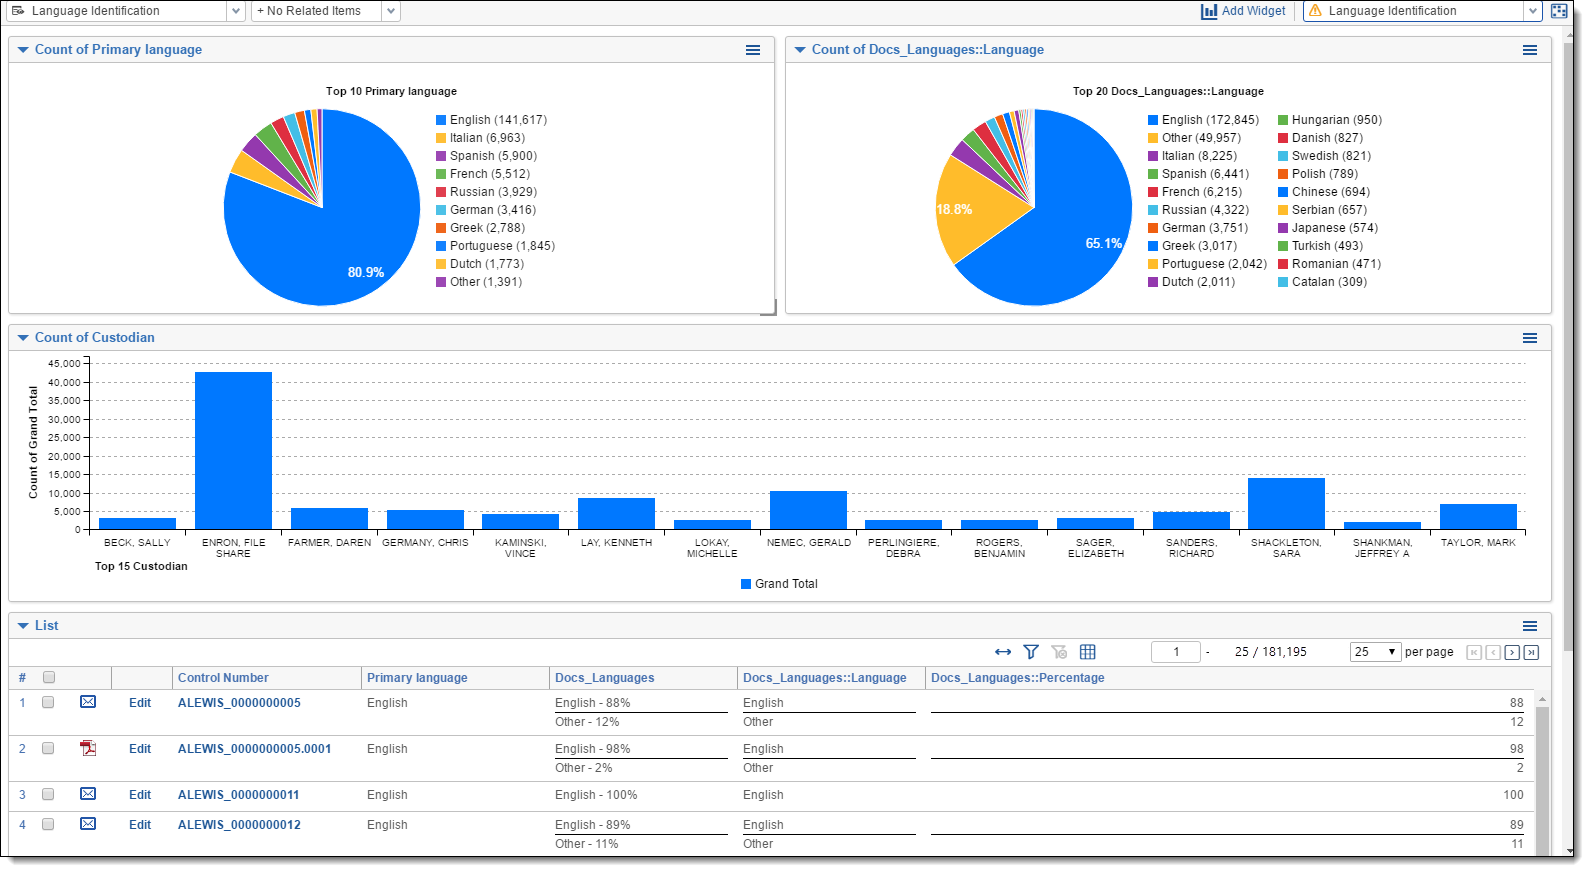
Language Identification
To create the Language Identification dashboard, group by and pivot on the following fields:
- Group by Primary Language
- Group by Docs_Languages::Language
- Group by Custodian
We recommend using your Language Identification view with this dashboard.
Special considerations
- Create a default Document List dashboard (lowest order number) with only the item/document list, no additional widgets.
- You can only have one Cluster Visualization widget on a dashboard.
- You can create dashboards on other objects.
- Dashboards can be created in your template, so they carry over to your new workspaces. However, some dashboards, such as those with search term report widgets or cluster visualization, will need to be created in the individual workspace once you’ve created your clusters and/or STRs.