


Feedback
Relativity Server CLI Troubleshooting
This document provides troubleshooting guidance for common Relativity Server CLI issues encountered during Environment Watch and Data Grid Audit setup, configuration, and operation.
Prerequisite Access
Before running the CLI, you must have access to all of the following:
- Relativity Admin account
- Secret Store
- Kepler (SSL certificate)
- Elasticsearch
- Kibana
- APM Server For verification steps for all prerequisites, see Additional Pre-requisite Access Checks.
This guide assumes the Relativity Server bundle was extracted to C:\server-bundle or a similar directory chosen by the user.
APM Integration and Data View
Elastic APM Integration Package
The Elastic APM integration package must be added and configured in Kibana before running the CLI setup.
Troubleshooting Steps:
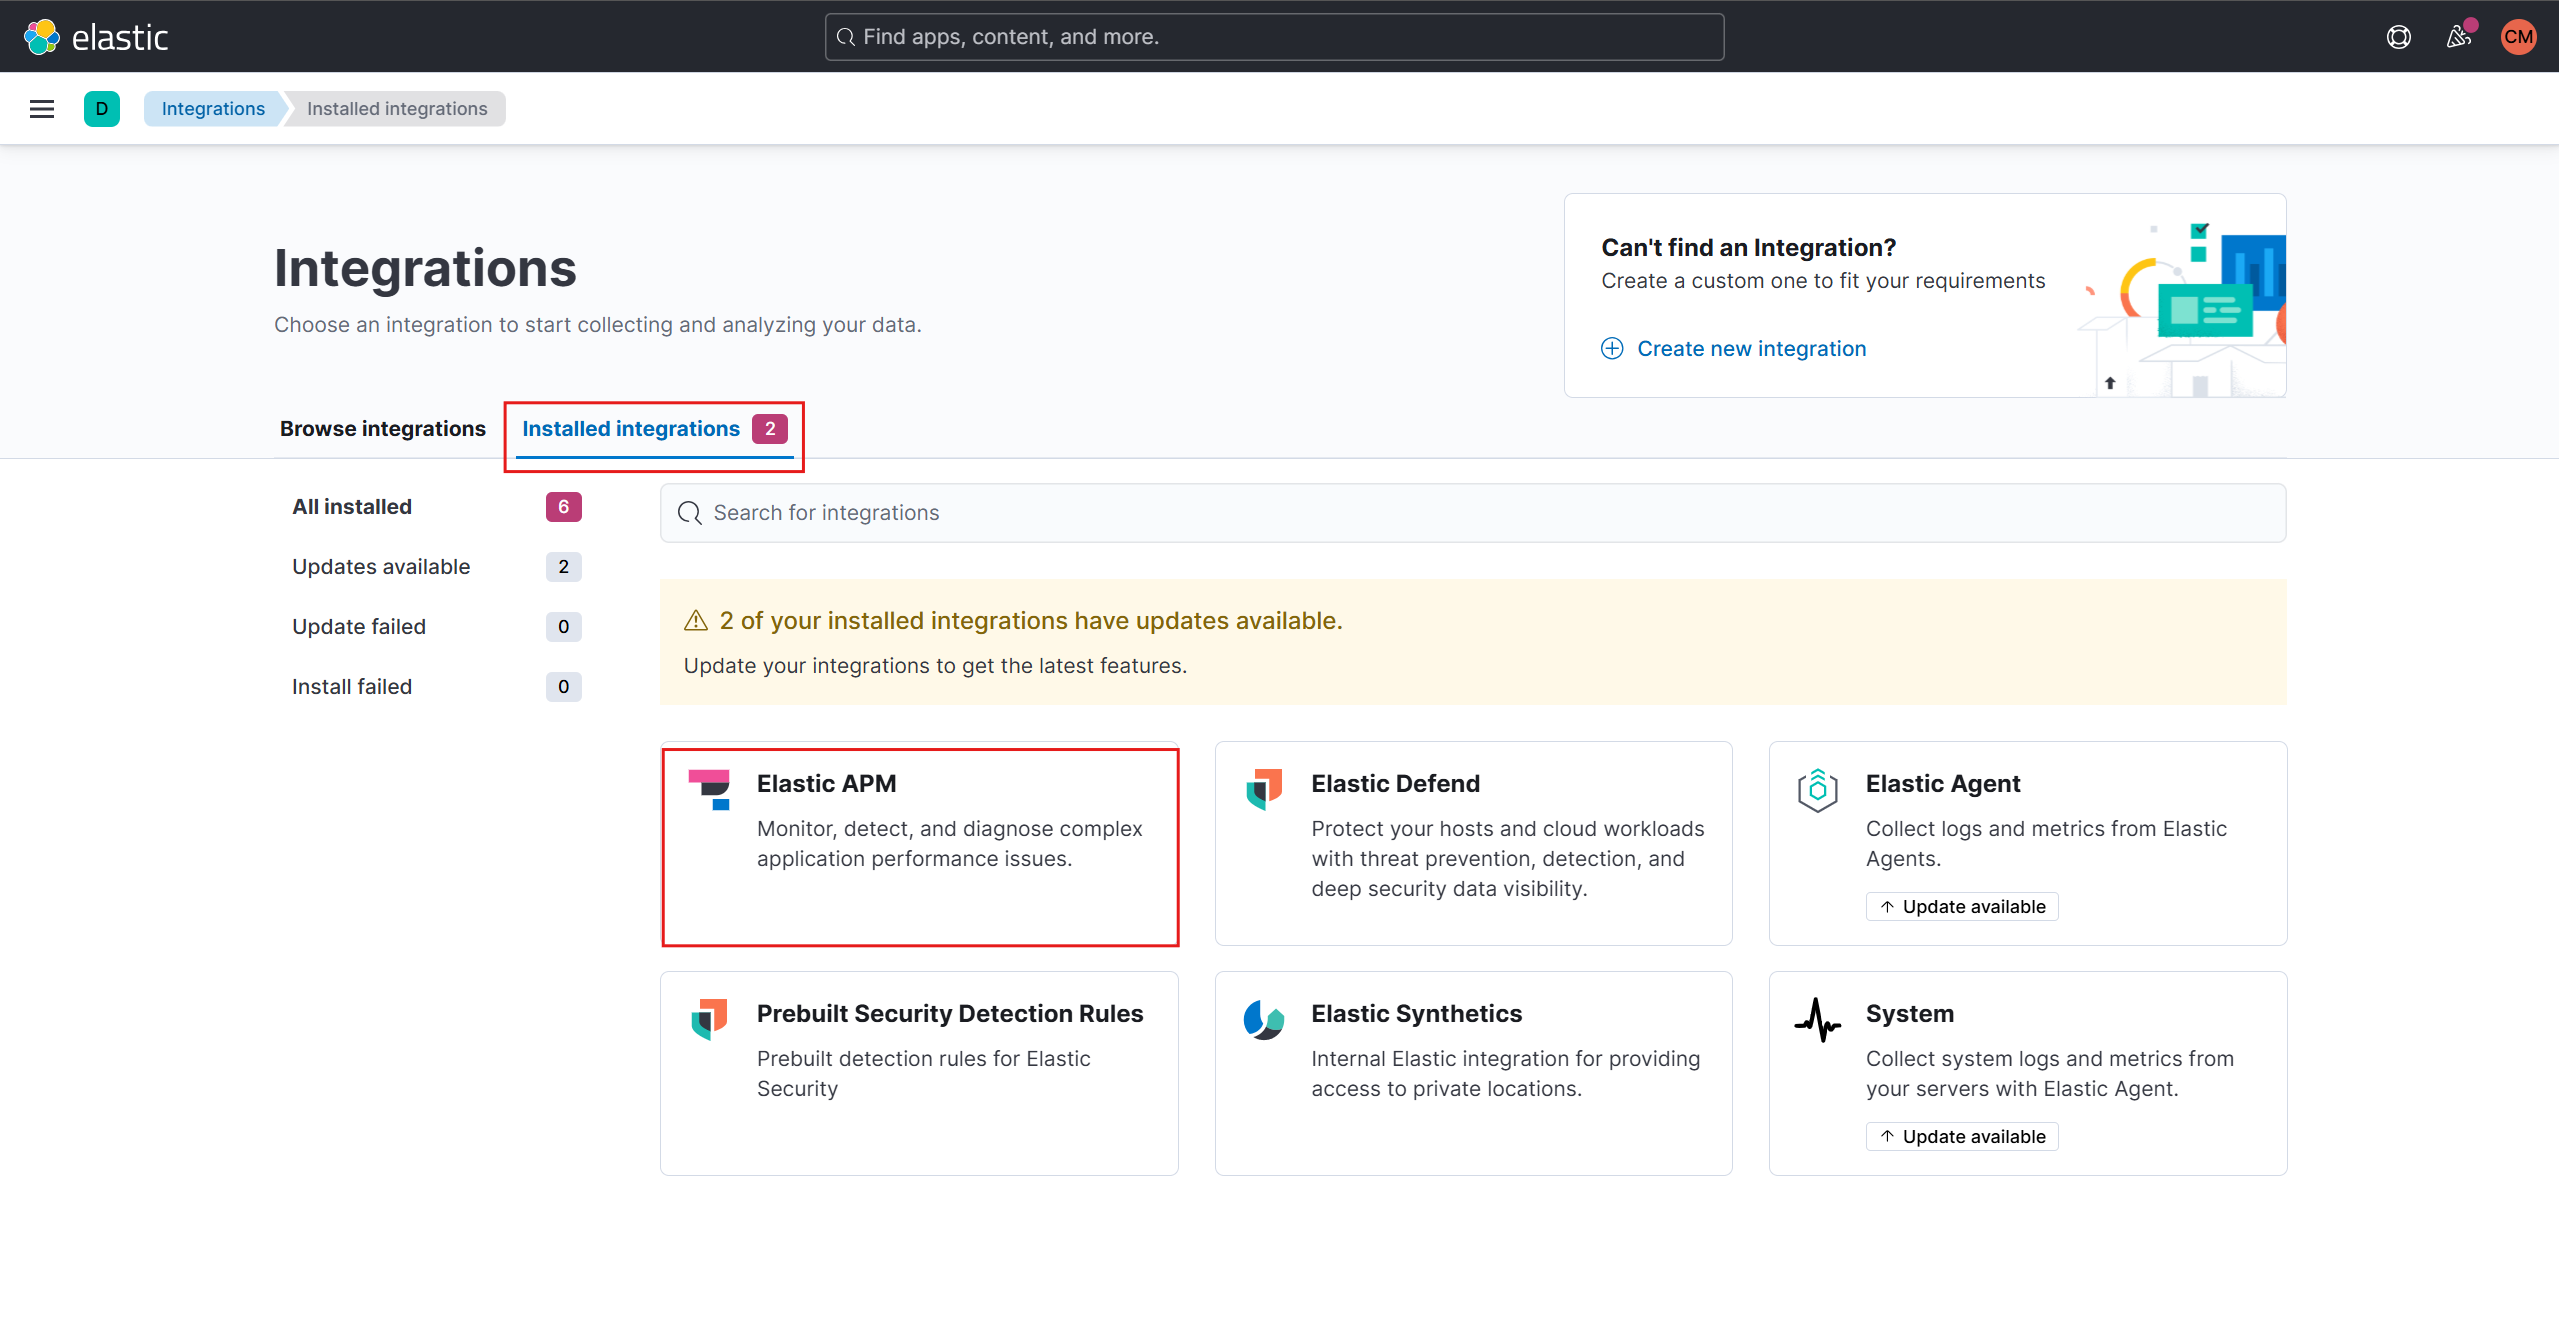
- Verify if APM Integration is already installed:
-
Login to Kibana and navigate to Management > Integrations.
-
Search for "Elastic APM" in the search bar.
-
Check if "Elastic APM" appears under Installed integrations.
-
If APM integration is not installed, follow the detailed setup instructions in the Elastic APM Integration Setup Guide.
-
If you encounter errors such as "Package not found" or installation timeouts during APM integration package installation, refer to the official Elastic APM Integration Setup Guide.
To verify connectivity, always use the following format for verification commands:
Copy
curl.exe -k -u <username>:<password> -X GET "https://<hostname_or_ip>:9200/"
Expected Output:
Copy
{
  "name" : "EMTTEST",
  "cluster_name" : "elasticsearch",
  "cluster_uuid" : "PwBZoINKQjGZ53WH4gFfBg",
  "version" : {
    "number" : "8.17.3",
    "build_flavor" : "default",
    "build_type" : "zip",
    "build_hash" : "a091390de485bd4b127884f7e565c0cad59b10d2",
    "build_date" : "2025-02-28T10:07:26.089129809Z",
    "build_snapshot" : false,
    "lucene_version" : "9.12.0",
    "minimum_wire_compatibility_version" : "7.17.0",
    "minimum_index_compatibility_version" : "7.0.0"
  },
  "tagline" : "You Know, for Search"
}
Data View
Self Instrumentation Data View
Self-instrumentation allows you to monitor the CLI's own metrics, traces, and logs. See Self-Instrumentation for setup and troubleshooting instructions.
Without the self-instrumentation Data View, you may not see CLI self-monitoring data in Kibana dashboards.
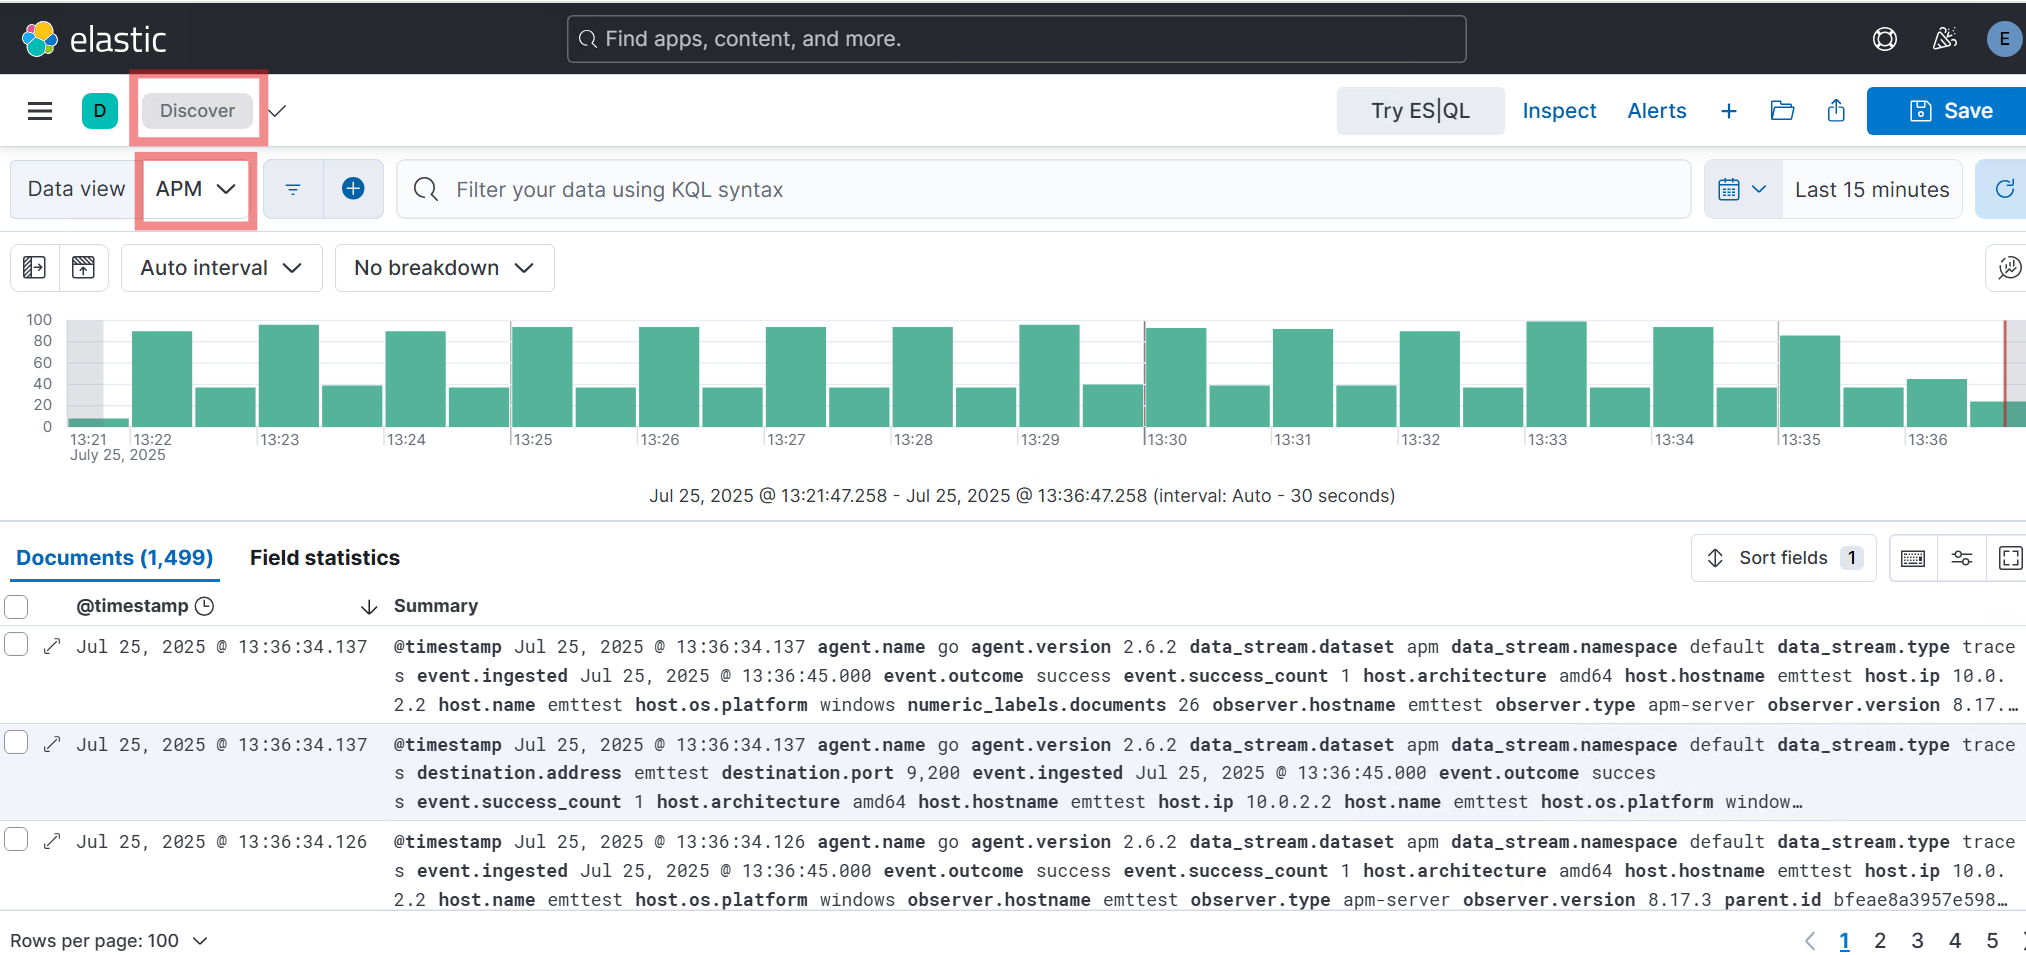
To check if the APM Data View is created in Kibana:
-
Open a browser and go to
http://<hostname_or_ip>:5601 -
Log in using elastic credentials
-
Confirm the APM Data View is present:
Kibana Encryption Keys Issues
Kibana encryption keys must be added to C:\elastic\kibana\config\kibana.yml before running CLI setup. If encryption keys are missing or invalid, the CLI will display errors such as:
Copy
[ERROR] Missing required Kibana encryption key: xpack.encryptedSavedObjects.encryptionKey
[ERROR] Missing required Kibana encryption key: xpack.reporting.encryptionKey
[ERROR] Missing required Kibana encryption key: xpack.security.encryptionKey
If you encounter encryption key validation errors or warnings in the CLI, follow the instructions in Kibana Encryption Keys Configuration.
Common CLI Errors
This section covers common errors encountered during the Environment Watch and Data Grid Audit setup workflows.
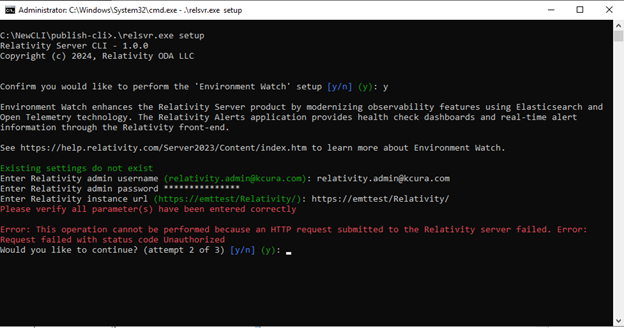
Unauthorized Access
Symptoms:
-
The CLI returns an "Unauthorized" error for Relativity or Elasticsearch credentials.
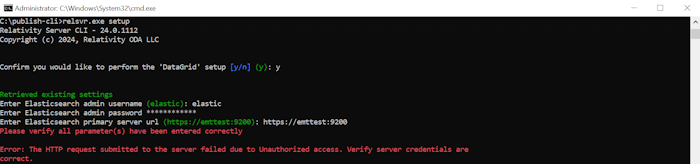
Troubleshooting Steps:
- Verify Relativity Credentials: Ensure the Relativity admin username and password are correct.
- Verify Elasticsearch Credentials: Ensure the Elasticsearch admin username and password are correct.
Incorrect Server URLs
Symptoms:
-
The CLI returns an error indicating that a server URL is incorrect.
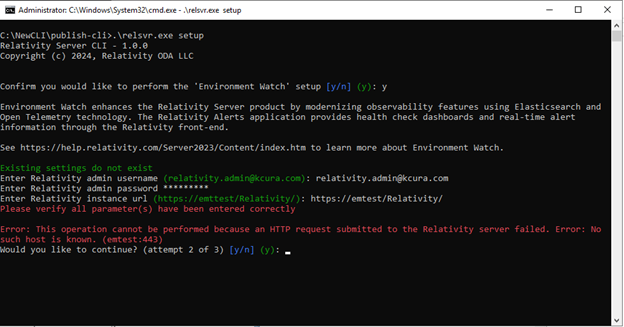
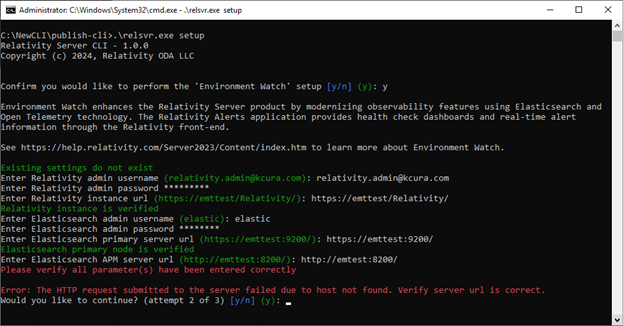
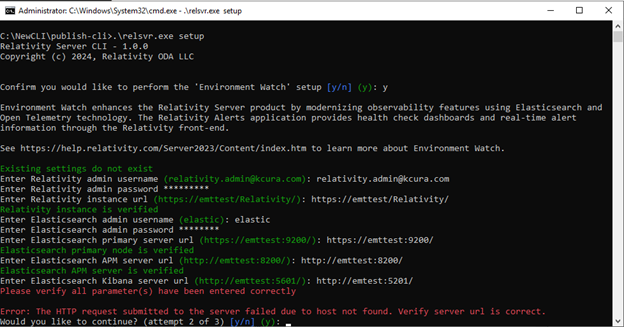
Troubleshooting Steps:
- Verify URLs: Check the URLs for Relativity, Elasticsearch, APM, and Kibana to ensure they are correct and accessible.
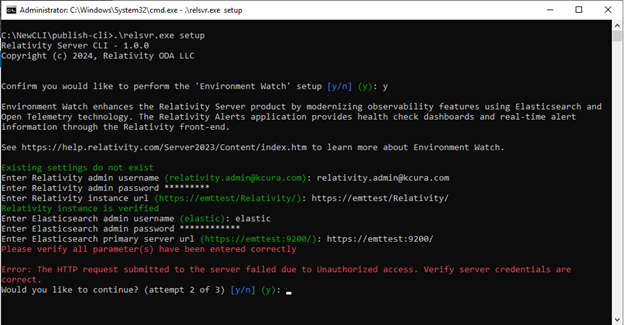
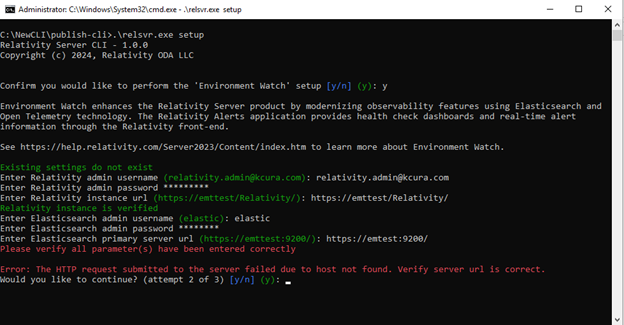
Incorrect Elasticsearch Server Credentials
Symptoms:
-
The CLI specifically flags Elasticsearch credentials as incorrect.

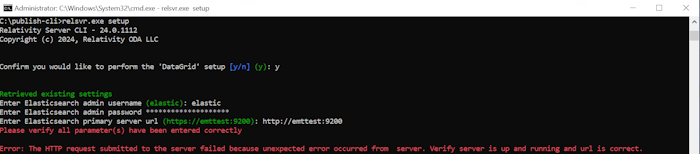
Troubleshooting Steps:
- Verify Elasticsearch Credentials and URL: Double-check the Elasticsearch admin username, password, and server URL.
Retry Limit Reached
Symptoms:
-
The CLI exits after multiple failed attempts to enter correct parameters.
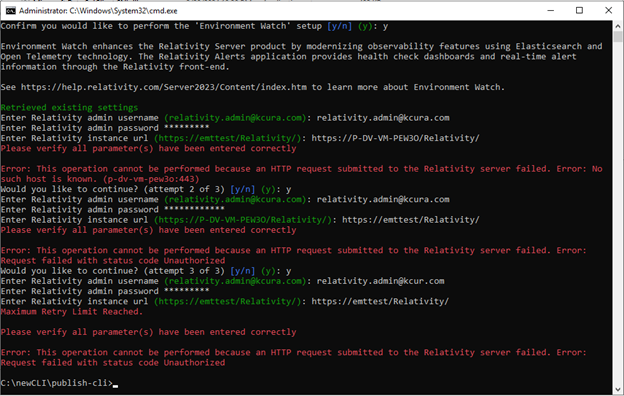
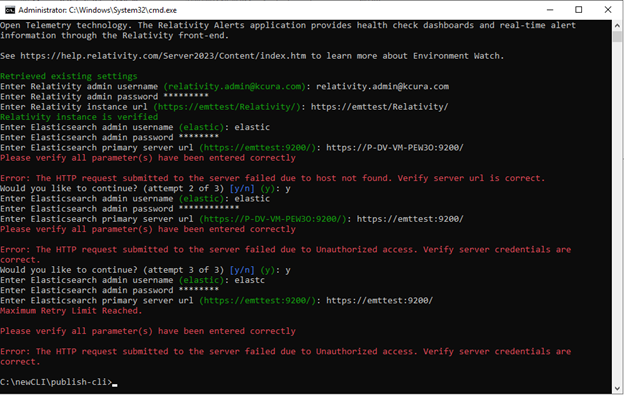
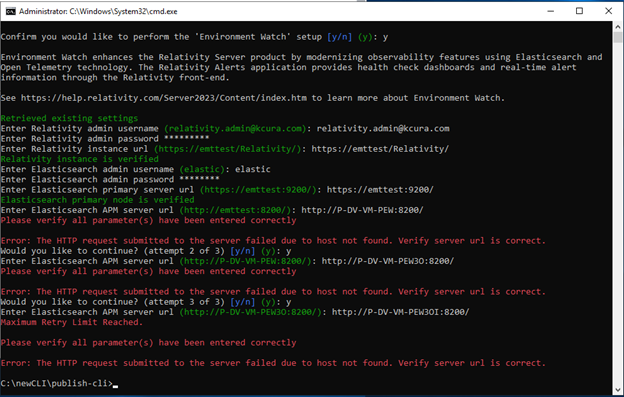
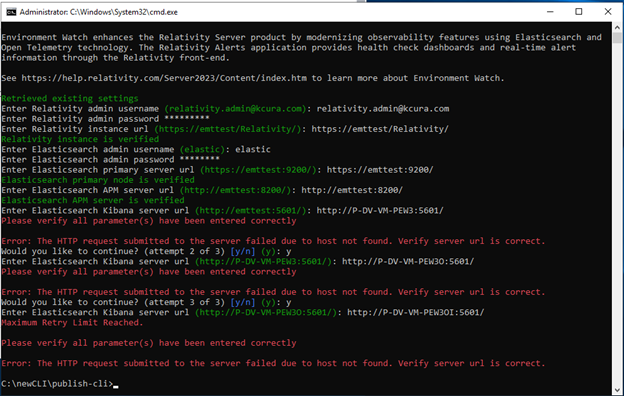
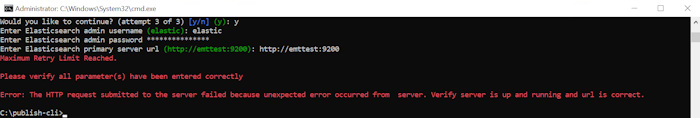
Troubleshooting Steps:
- Restart the CLI: The maximum number of attempts has been reached. Rerun the setup command:
Copy
relsvr.exe setup
For full setup instructions, see Relativity_Server_CLI Setup.