Feedback
Post-Install Verification for Monitoring Agents
Verify Monitoring Agent dashboard exists
Ensure the Monitoring Agent dashboard is present.
Steps:
- Login to Kibana.
- Navigate to Dashboards
- Use the search bar to search for
Monitoring Agents.
Expected Result:
- Monitoring Agent is listed.
Screenshot:
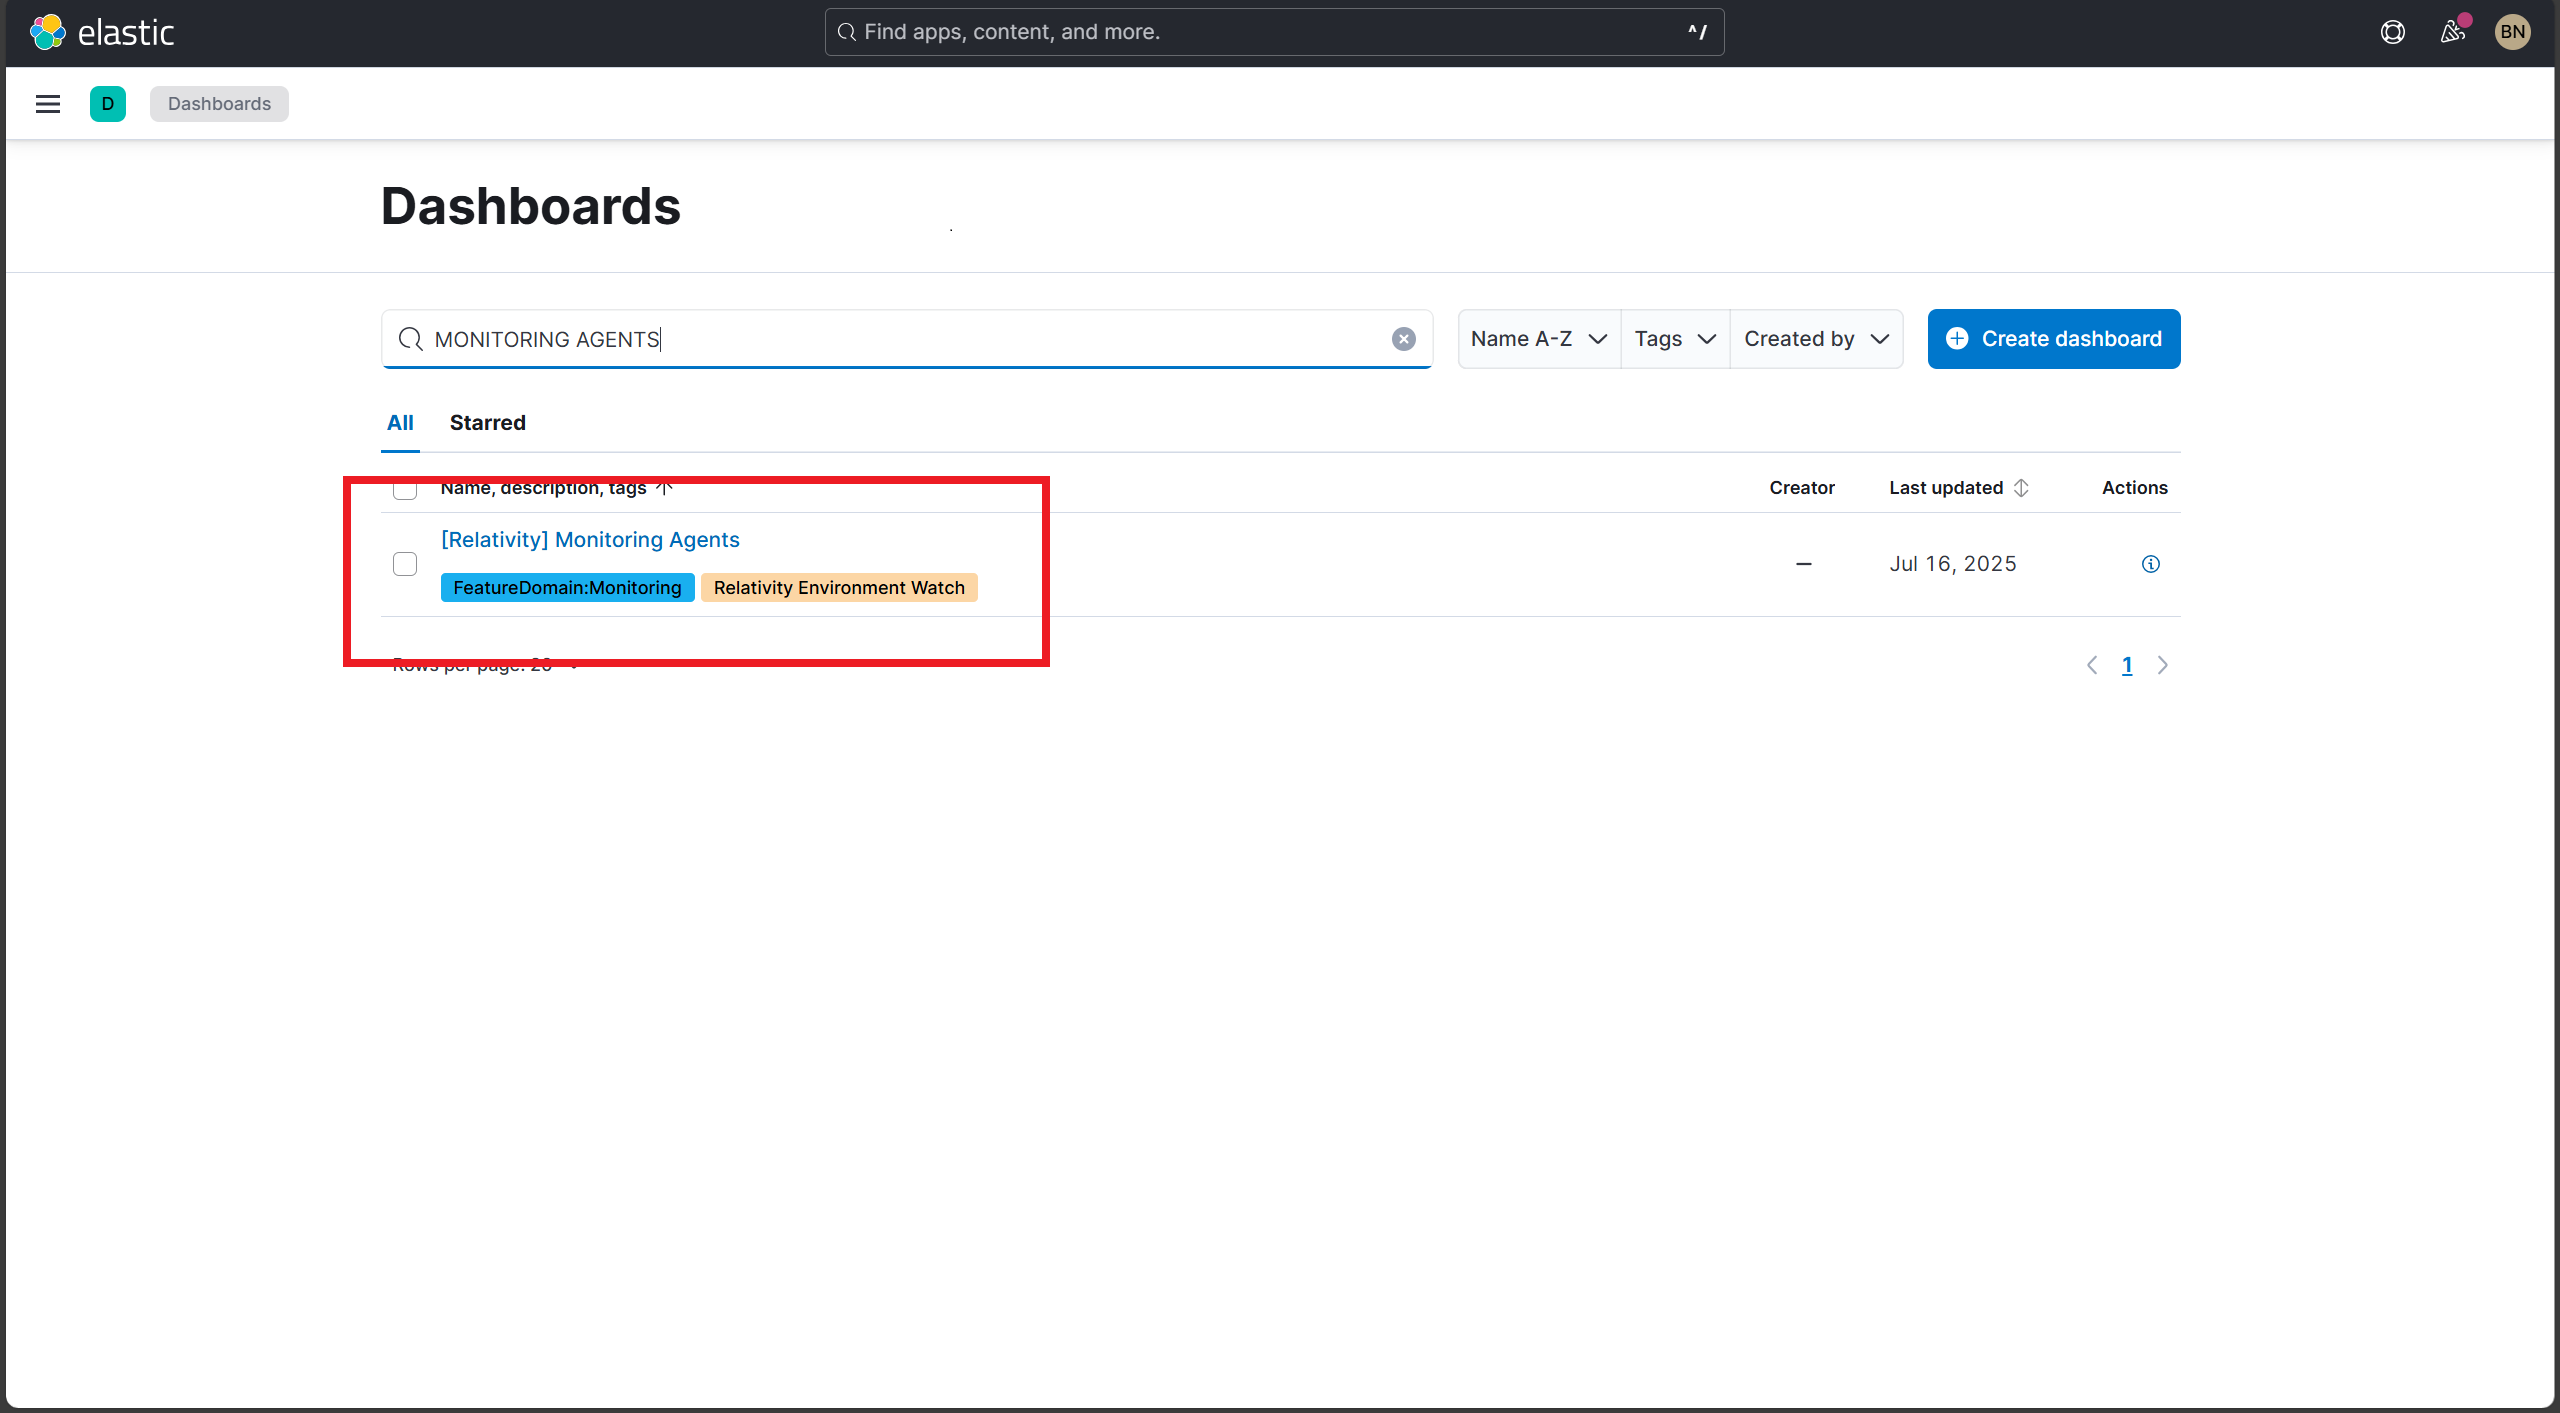
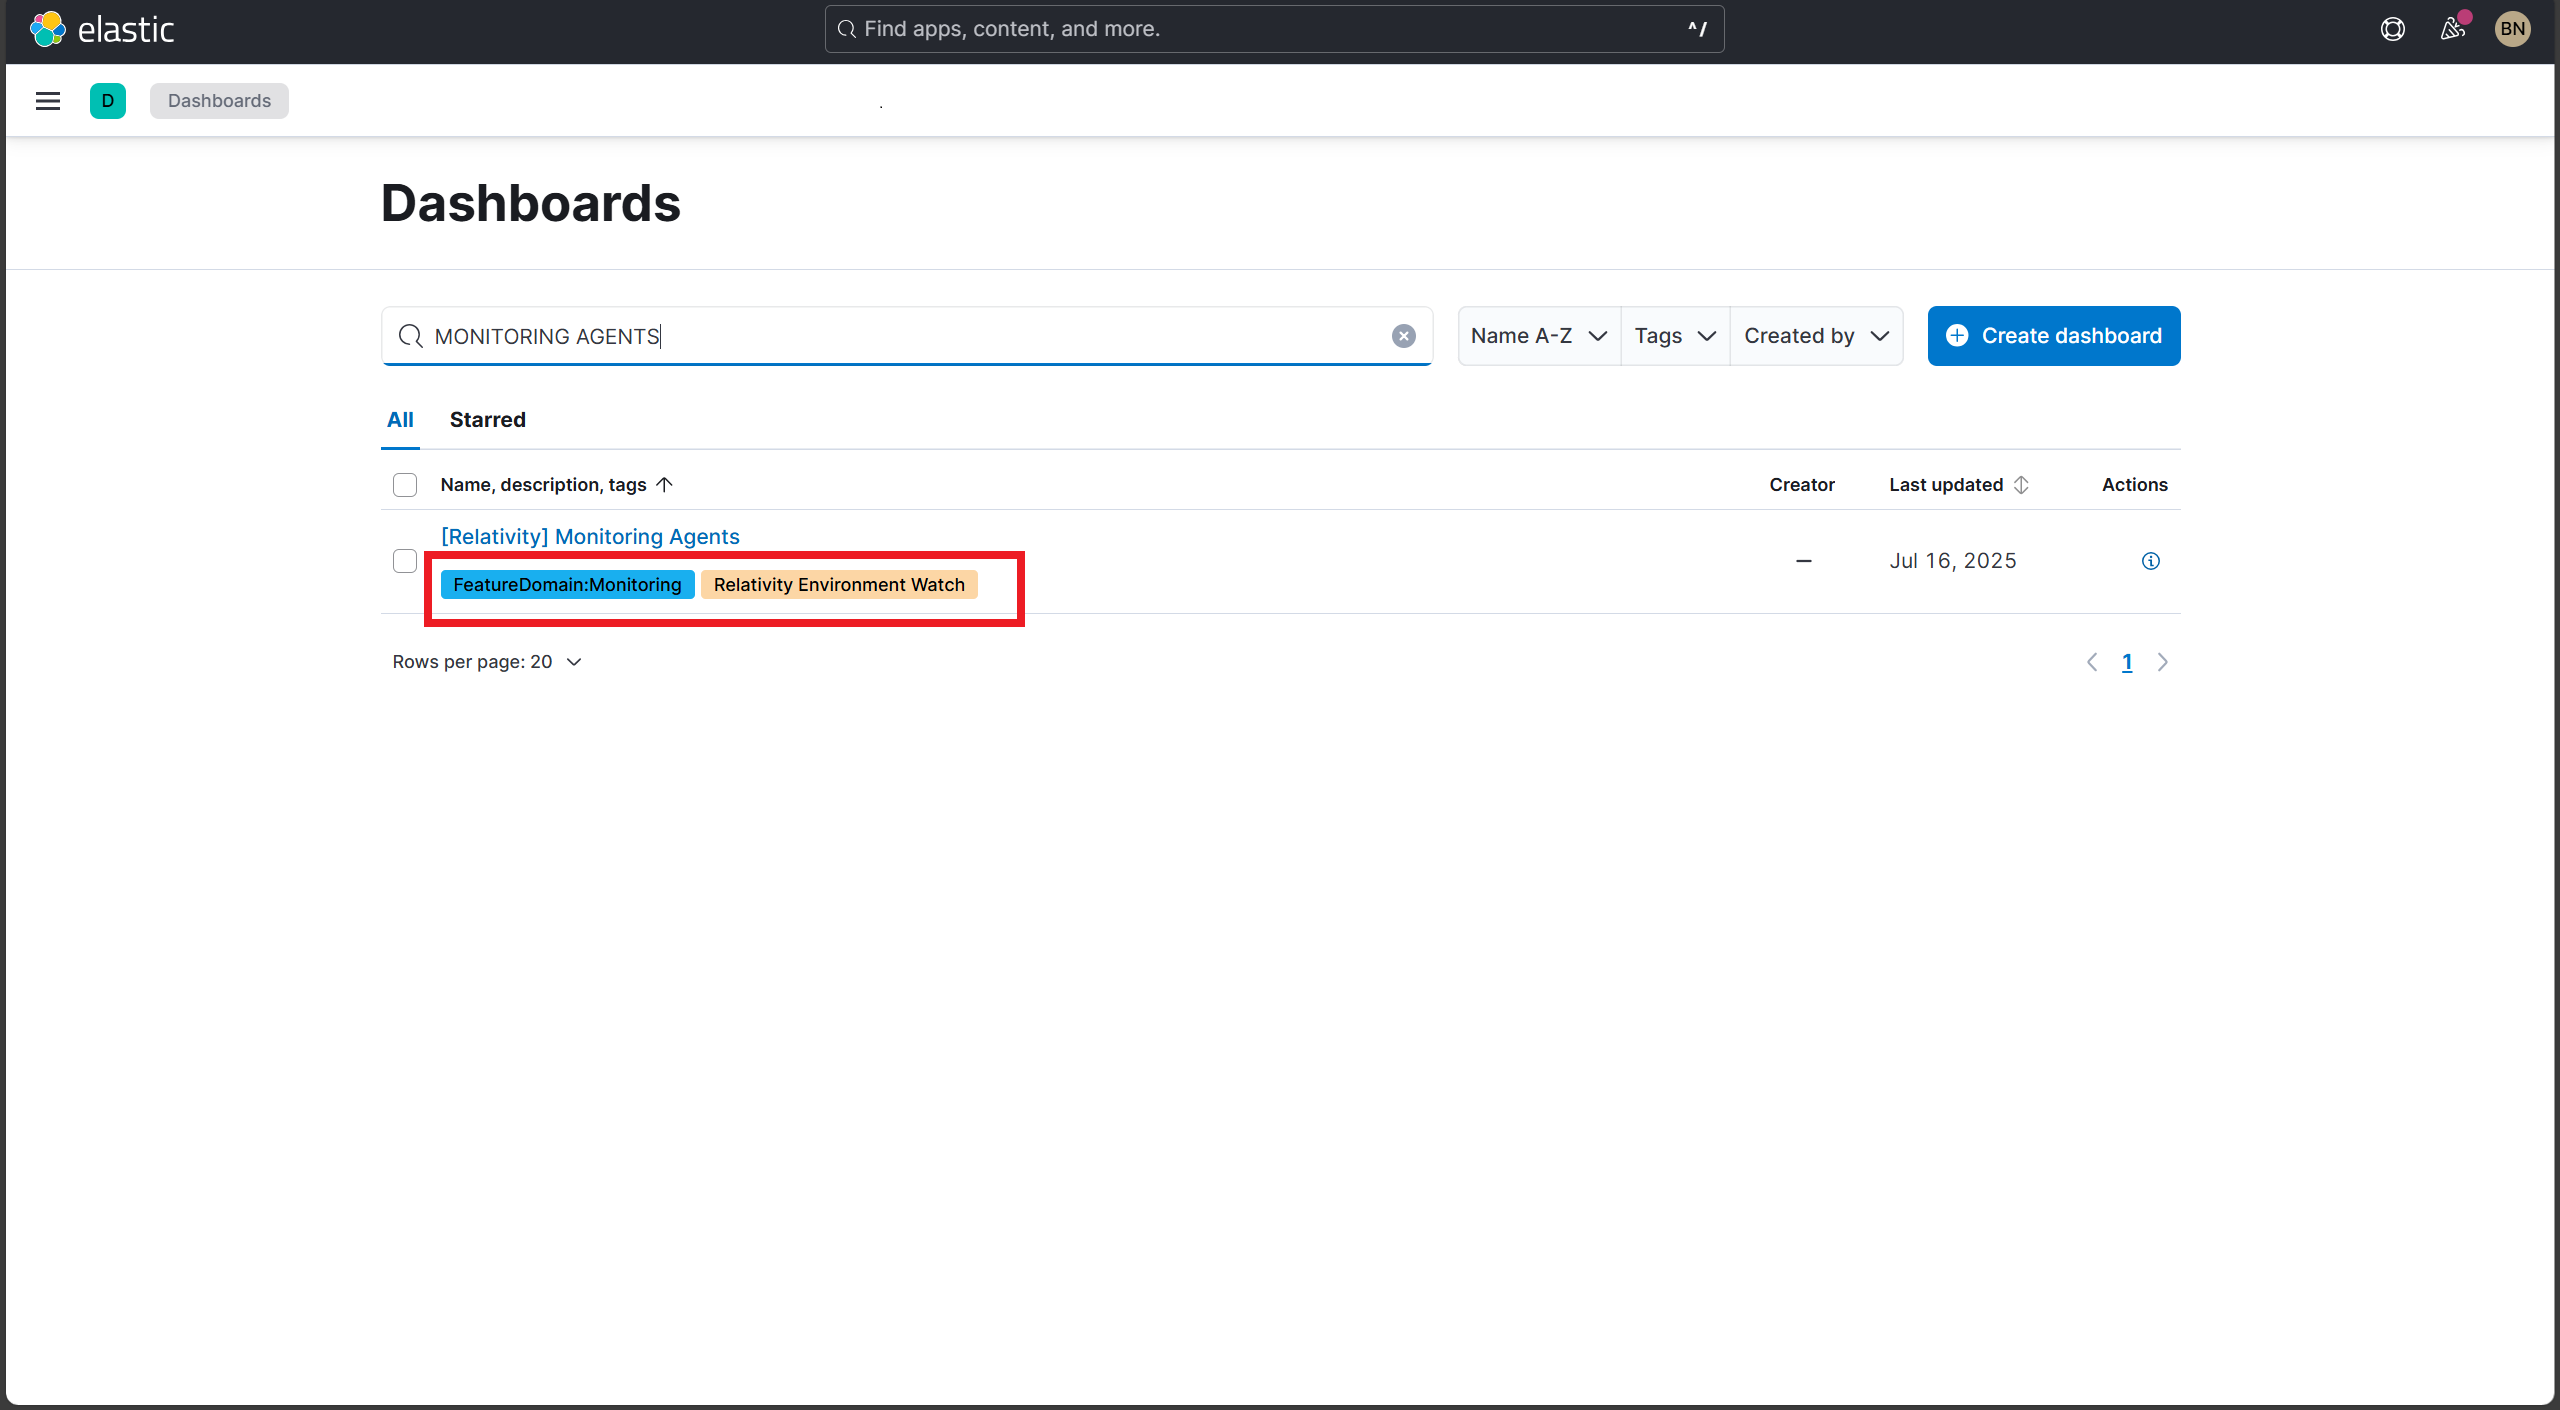
Verify Monitoring Agents dashboard tags
Ensure the correct tags are assigned to the dashboard.
Steps:
- Login to Kibana.
- Navigate to Dashboards.
- Use the search bar to search for
Monitoring Agentsand open the dashboard.
Expected Result:
- Tags:
- Relativity Environment Watch
- FeatureDomain: Monitoring
Screenshot:
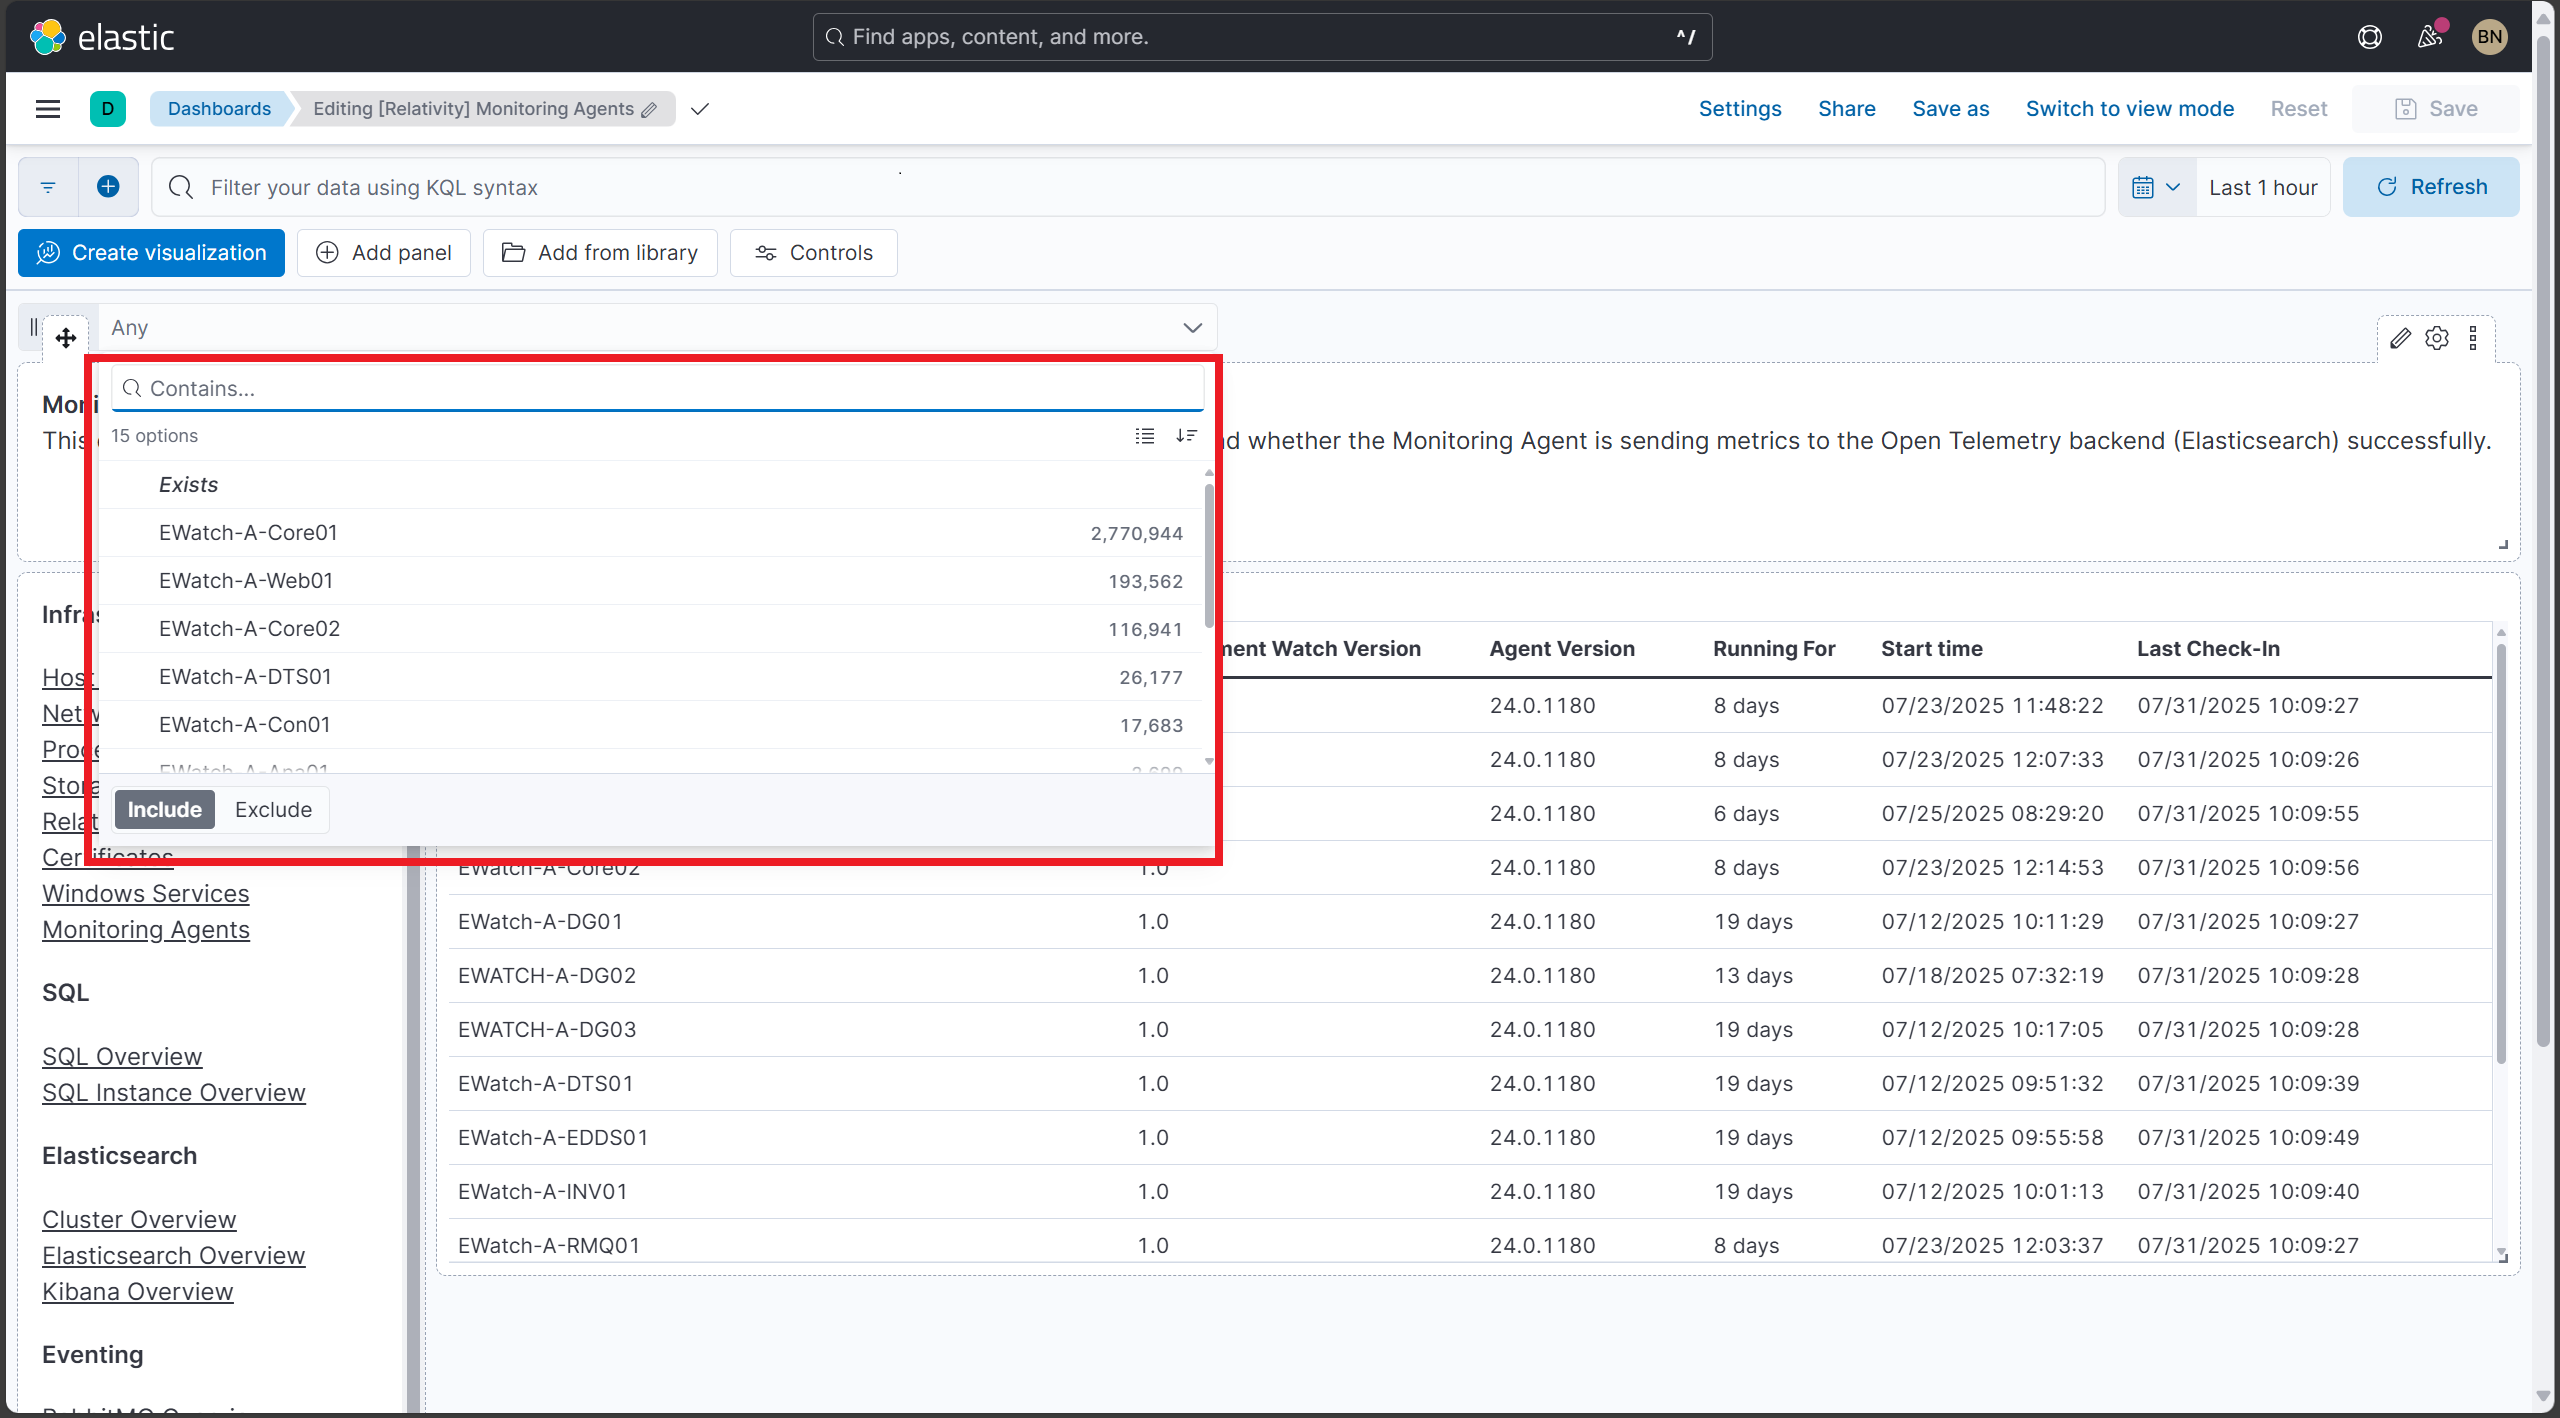
Verify dashboard filters populate with data
Ensure filter dropdowns are populated with available data.
Steps:
- Login to Kibana.
- Navigate to Observability | Dashboard.
- Click on the dashboard and open each filter dropdown.
Expected Result:
- Filter dropdowns show available values.
Filters may take a few minutes to populate after initial data collection begins.
Screenshot:
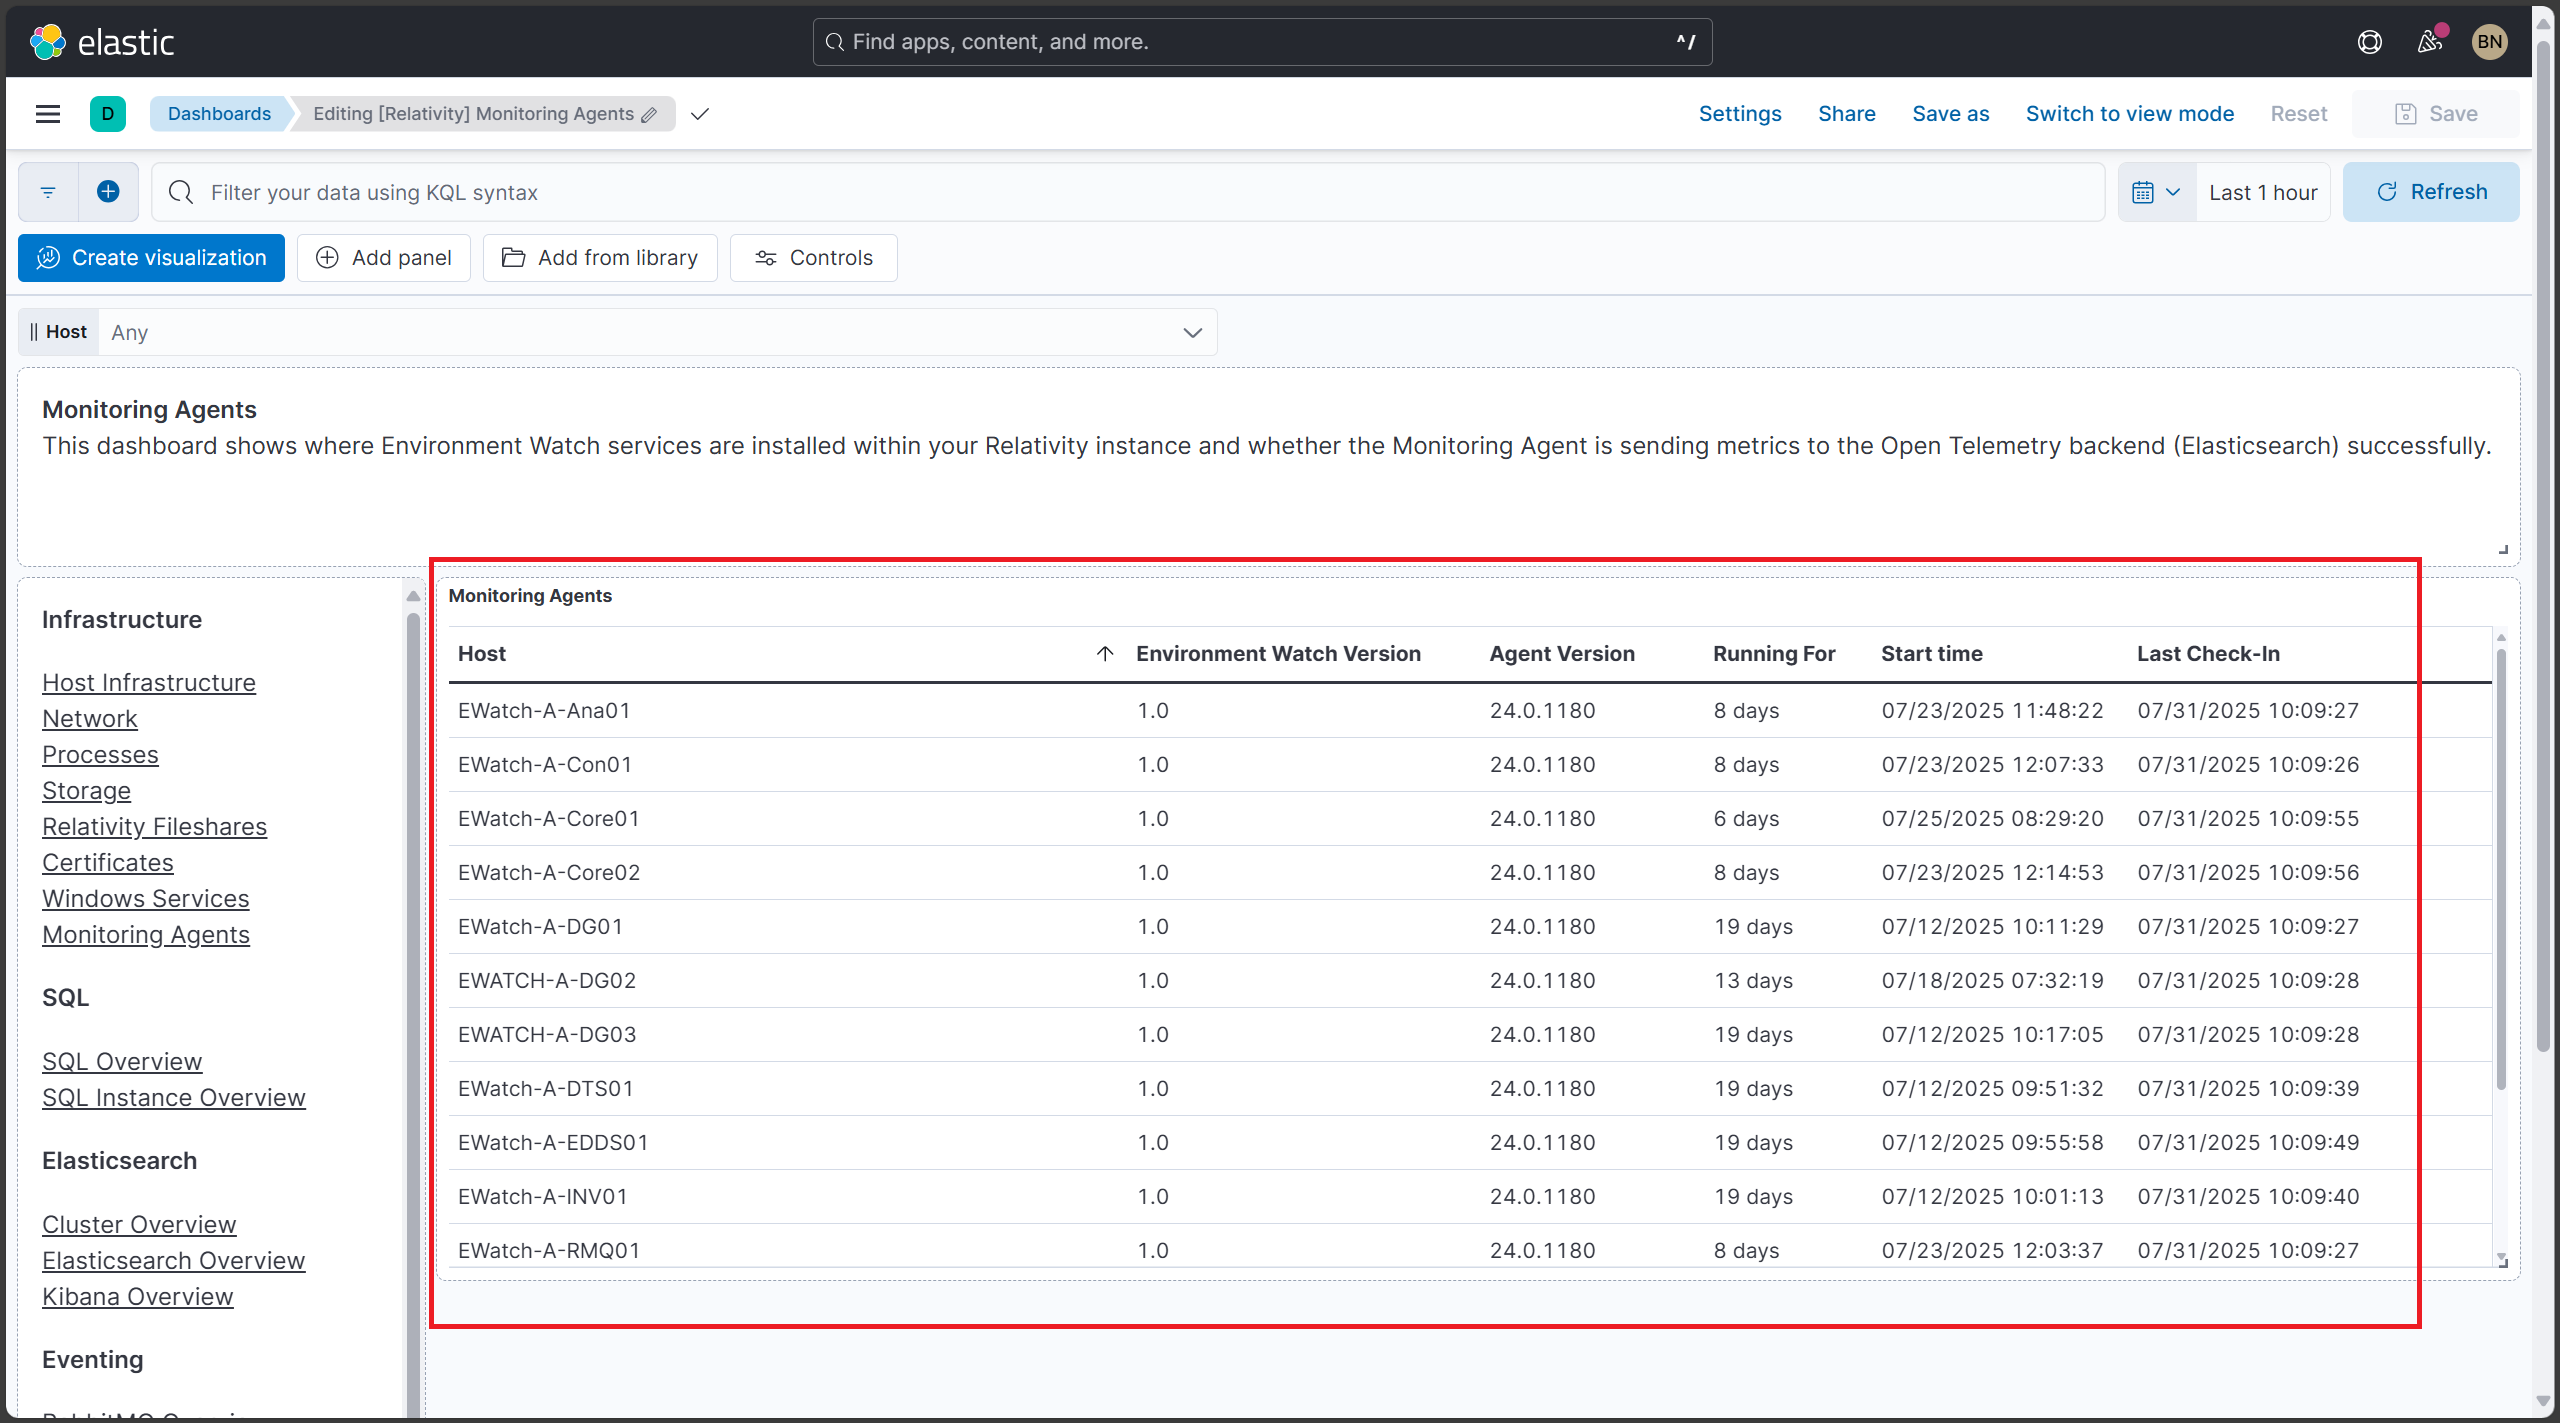
Verify data population by changing filters and time ranges
Ensure the dashboard data is loading correctly.
Steps:
- Login to Kibana.
- Open the Monitoring Agent dashboard.
- To change the time range, use the time filter at the top right, select the desired range (e.g., 15 minutes, 1 hour, 12 hours, 24 hours), and apply changes.
- Adjust filters to see if data updates accordingly.
Expected Result:
- All panels are populated with data.
Screenshot:
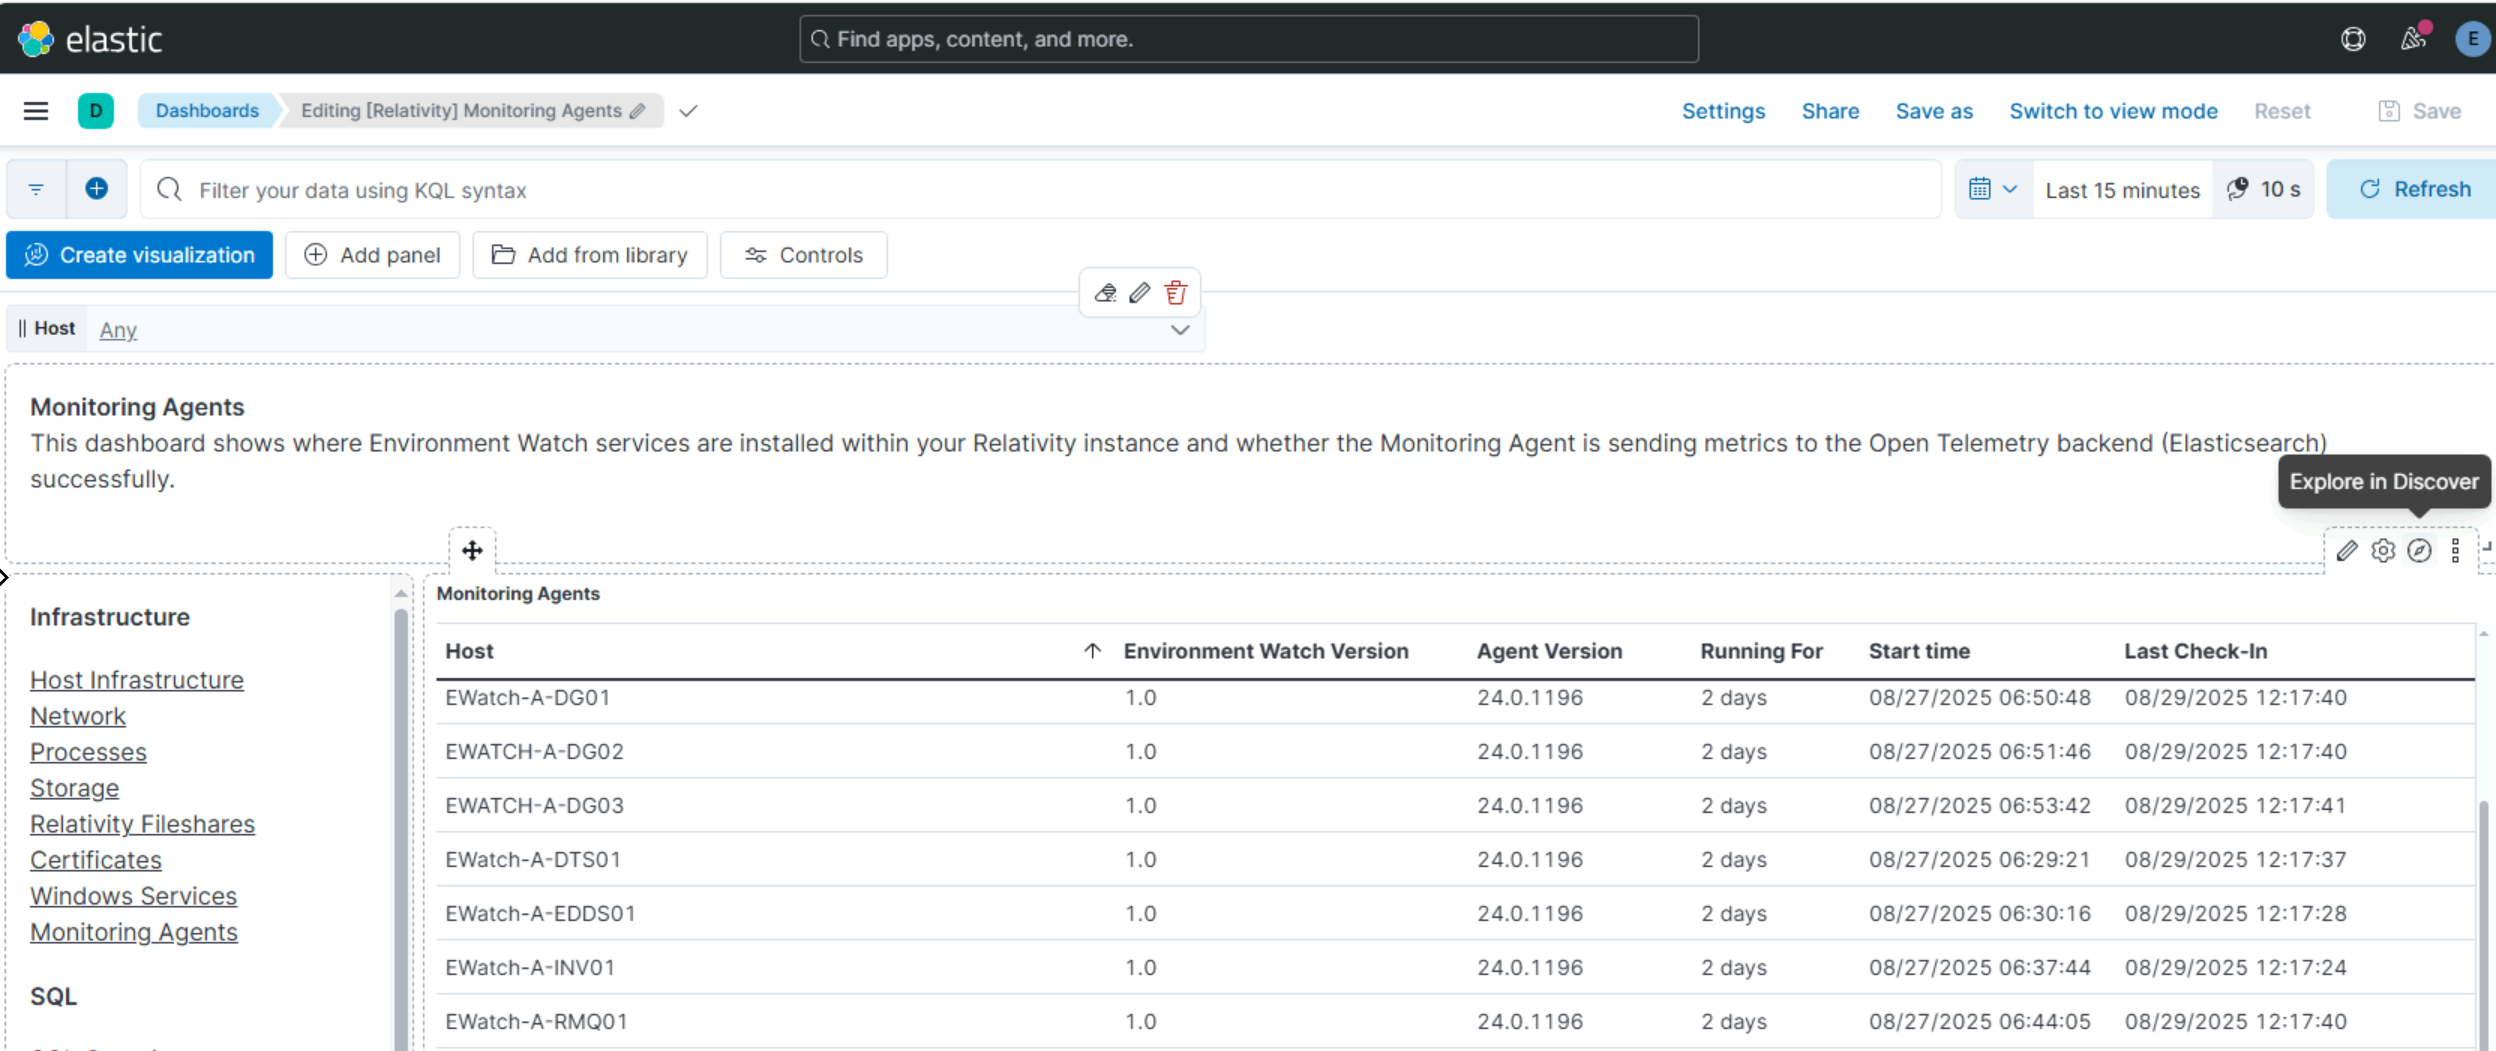
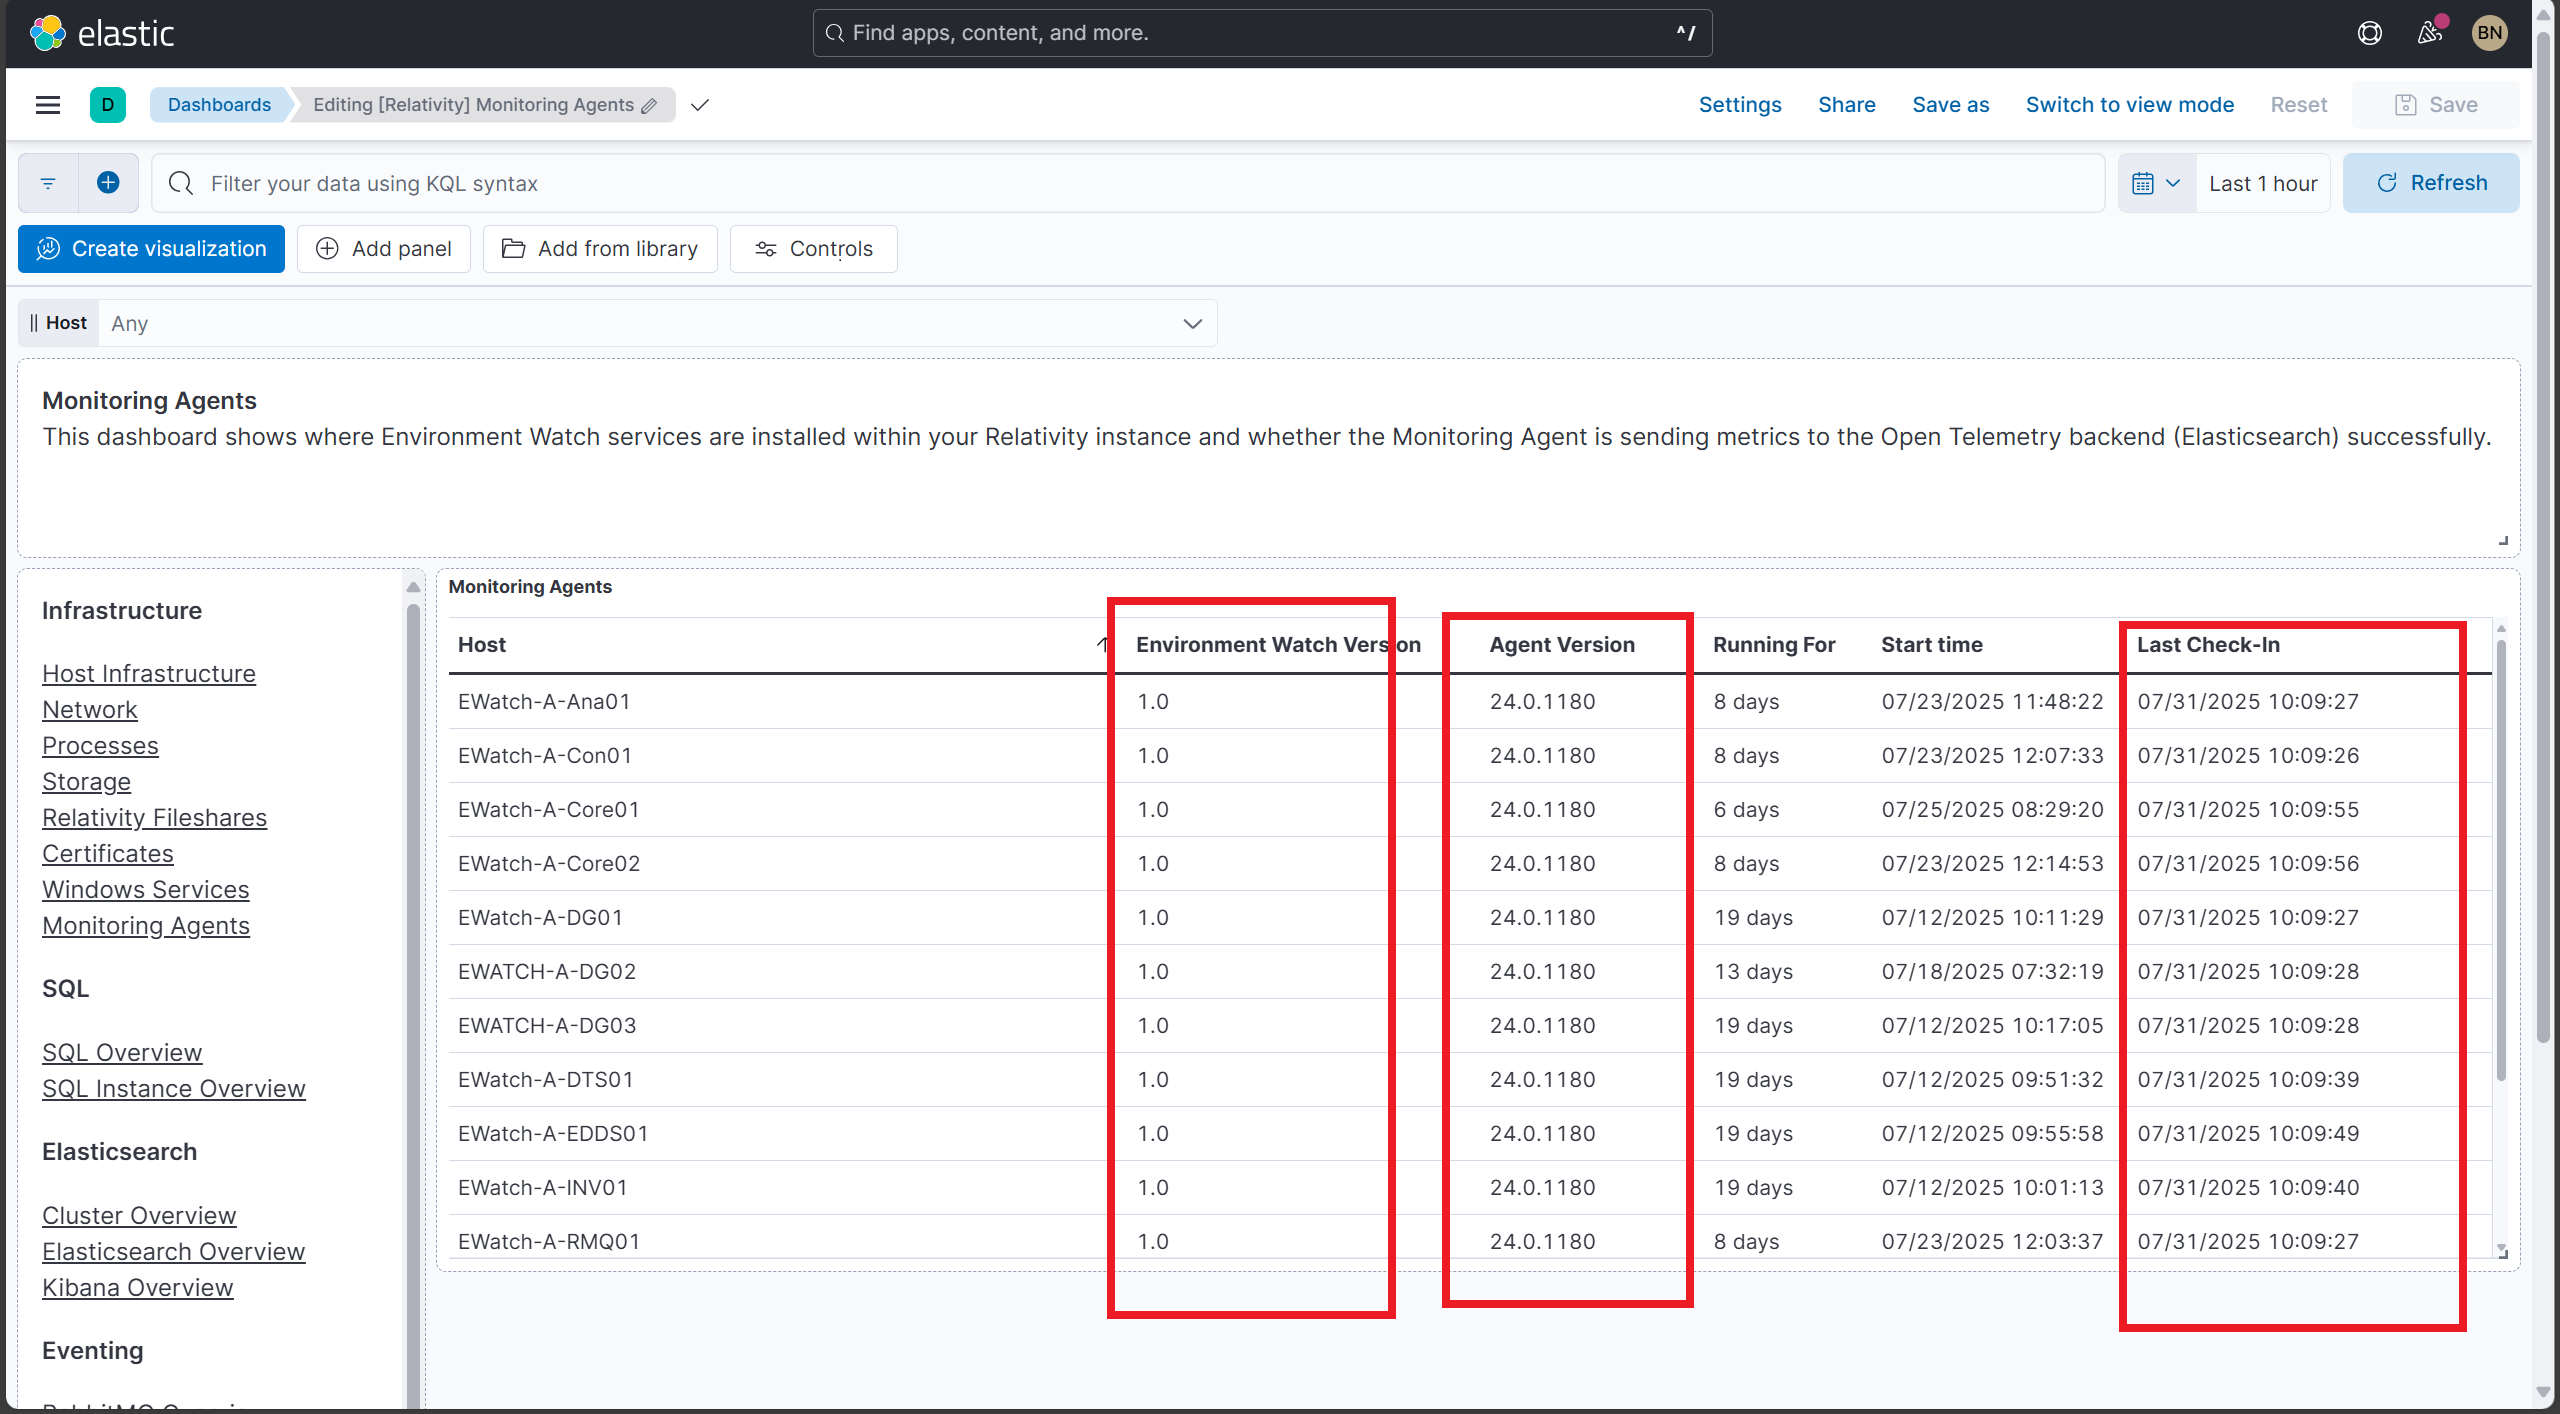
Verify Hosts and Agent versions
Ensure hosts and agent versions are correctly displayed.
Steps:
- Login to Kibana.
- Open the "Monitoring Agent" dashboard.
Expected Result:
- Host column lists multiple hosts.
- Agent Version is the same for all hosts.
- Last Modified Date column shows timestamp to verify installation time.
Verify that the agent version is consistent across all nodes to ensure uniform monitoring capabilities.
Screenshot:
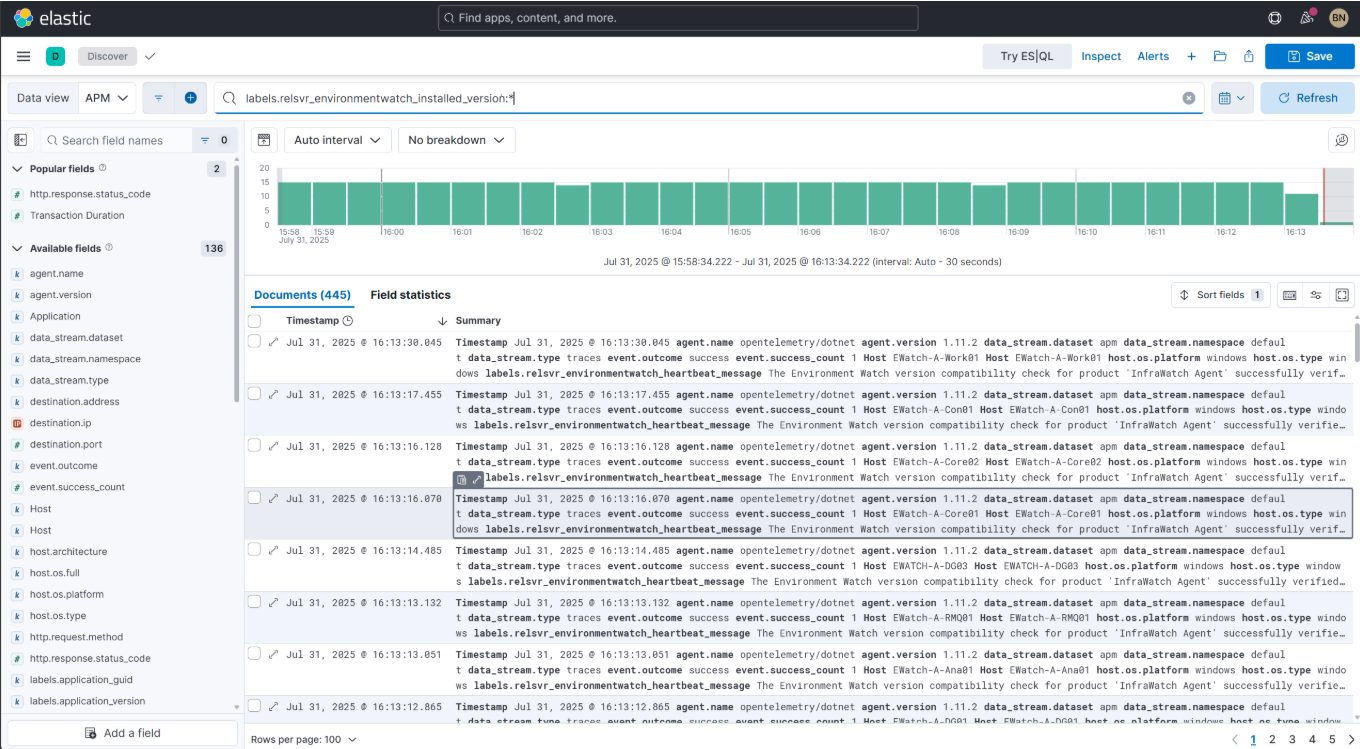
Verify data in Discover
Ensure dashboard data is reflected in Discover.
Steps:
- Login to Kibana.
- Open the dashboard and hover over the top right corner of the Monitoring Agents table to reveal the Explore in Discover option.
- Click Explore in Discover.
Expected Result:
- Data is visible in Discover.
Screenshot: