Feedback
Post-Install Verification for Elastic Cluster Health
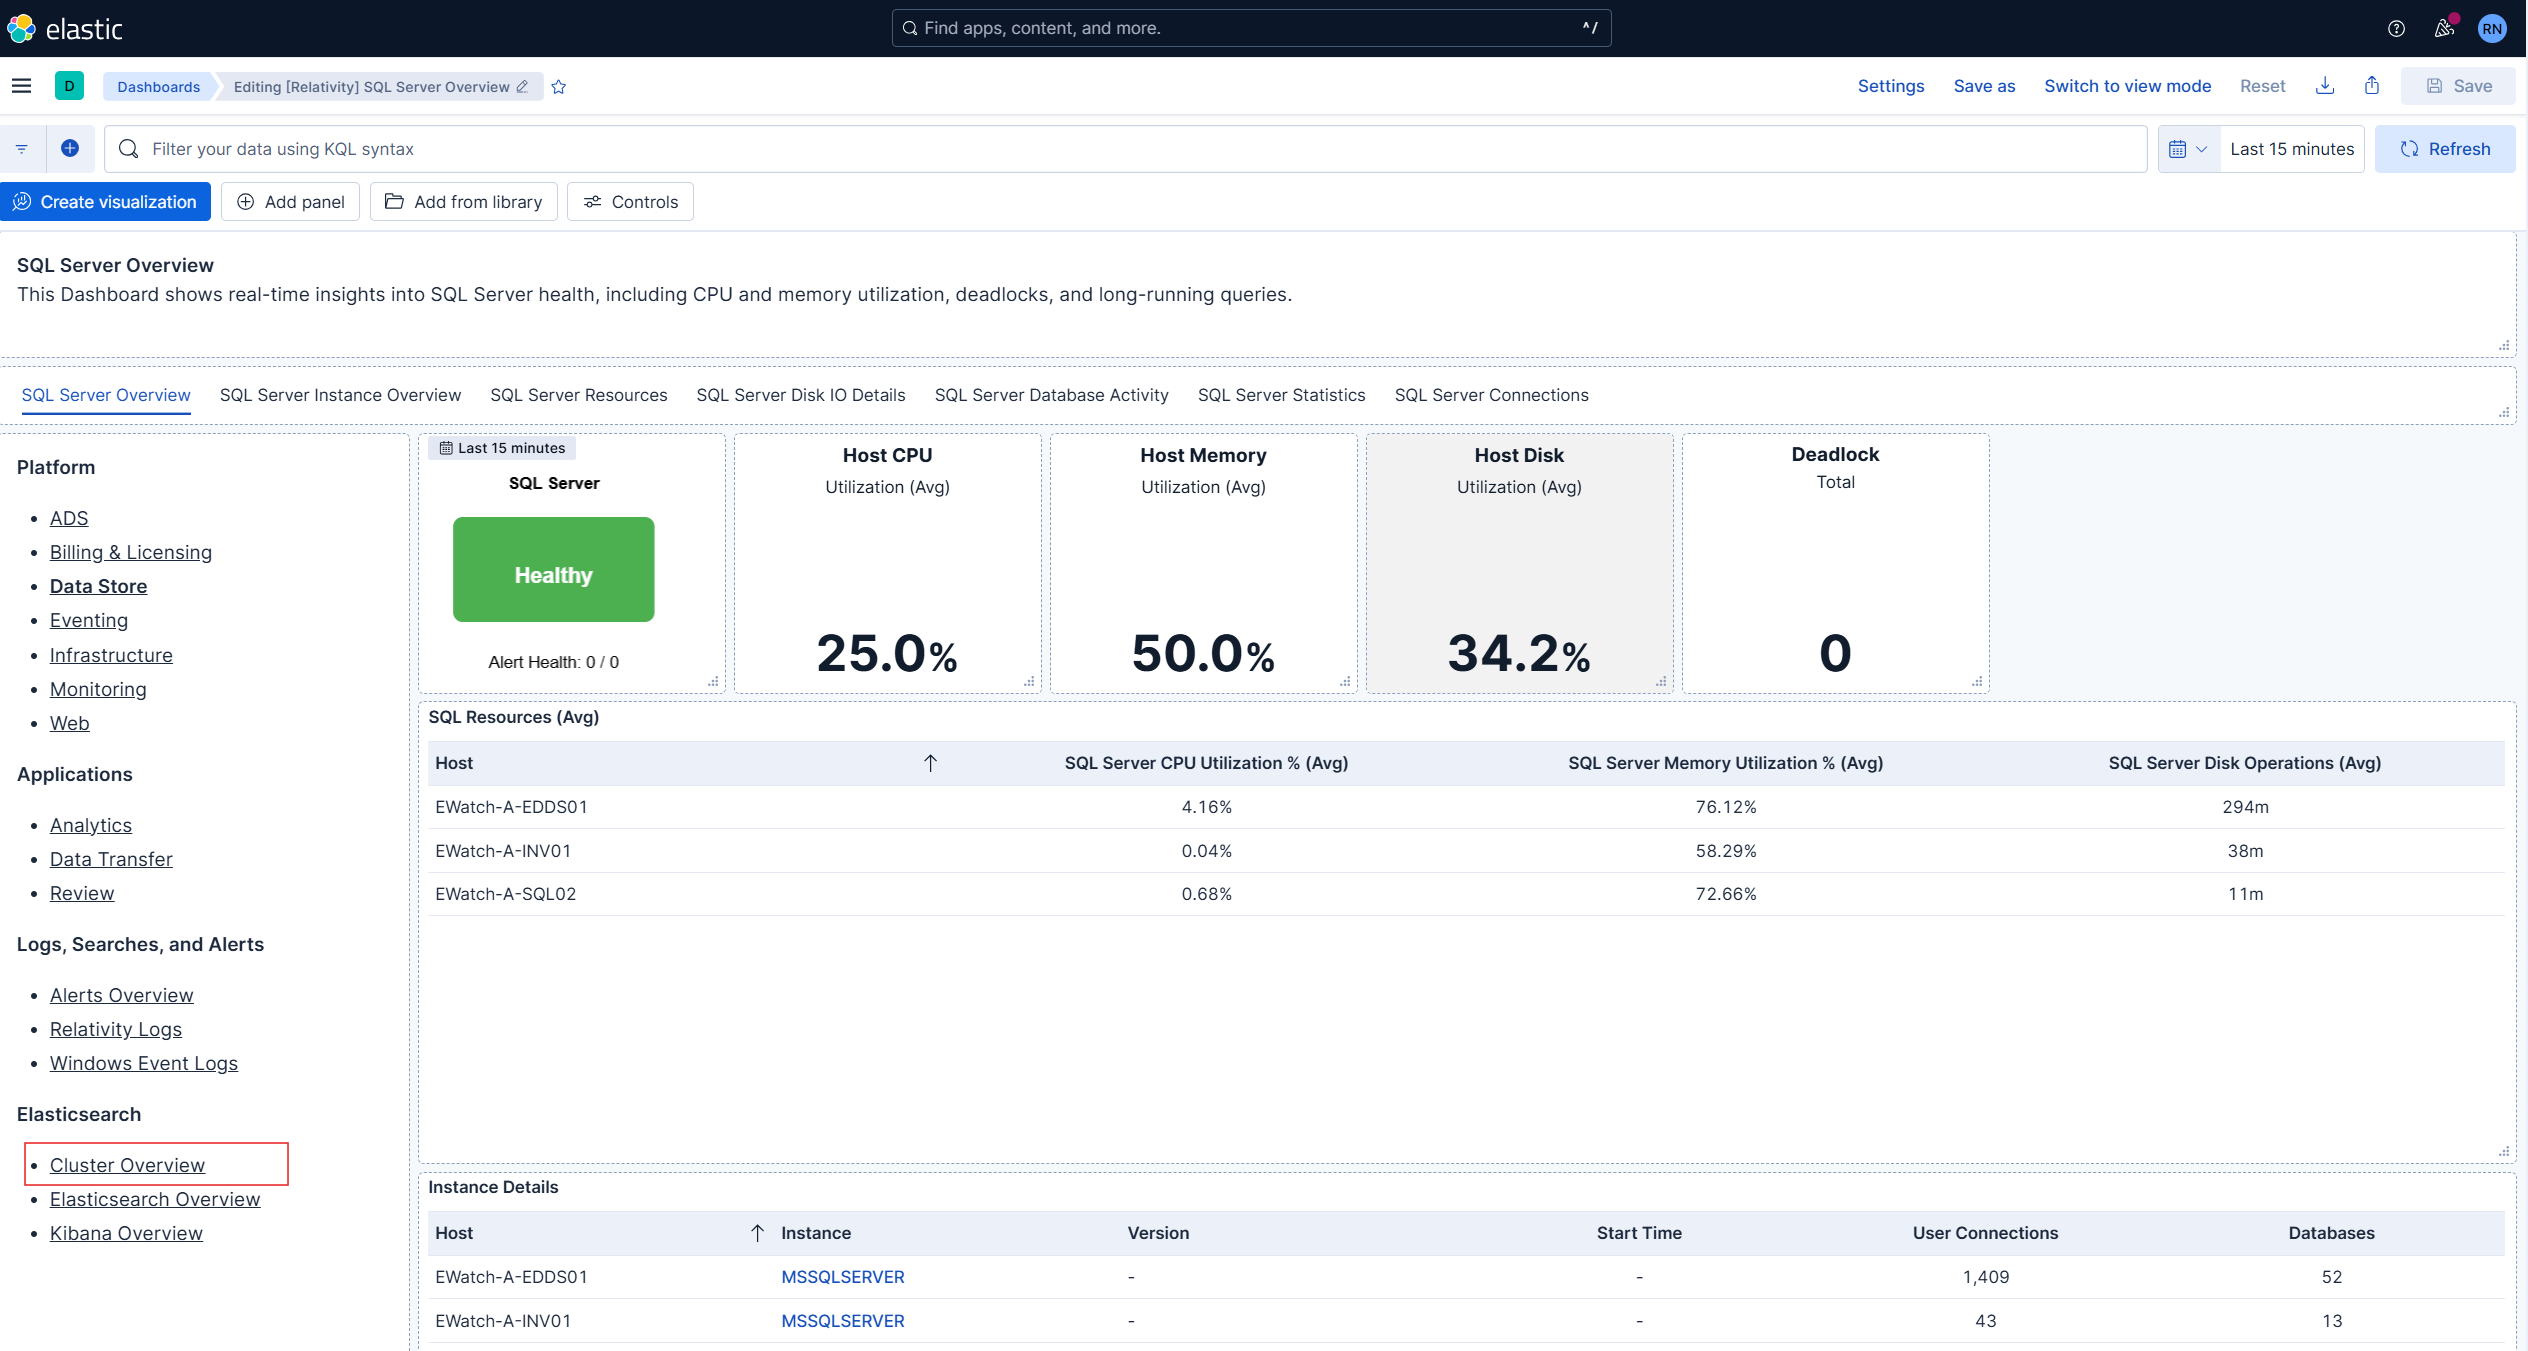
Verify that the dashboard exists
Navigate to the Elasticsearch cluster health monitoring dashboard.
Steps:
- Login to Kibana.
- Navigate to Dashboards
- Use the search bar to search for
Monitoring Agentsand open the dashboard - Click on Cluster Overview.
- Alternatively, visit this direct link: http://<hostname_or_ip>:5601/app/monitoring#
Expected Result:
- Successfully access the Elasticsearch monitoring dashboard.
- Cluster health panels and metrics are visible.
- Dashboard loads without errors.
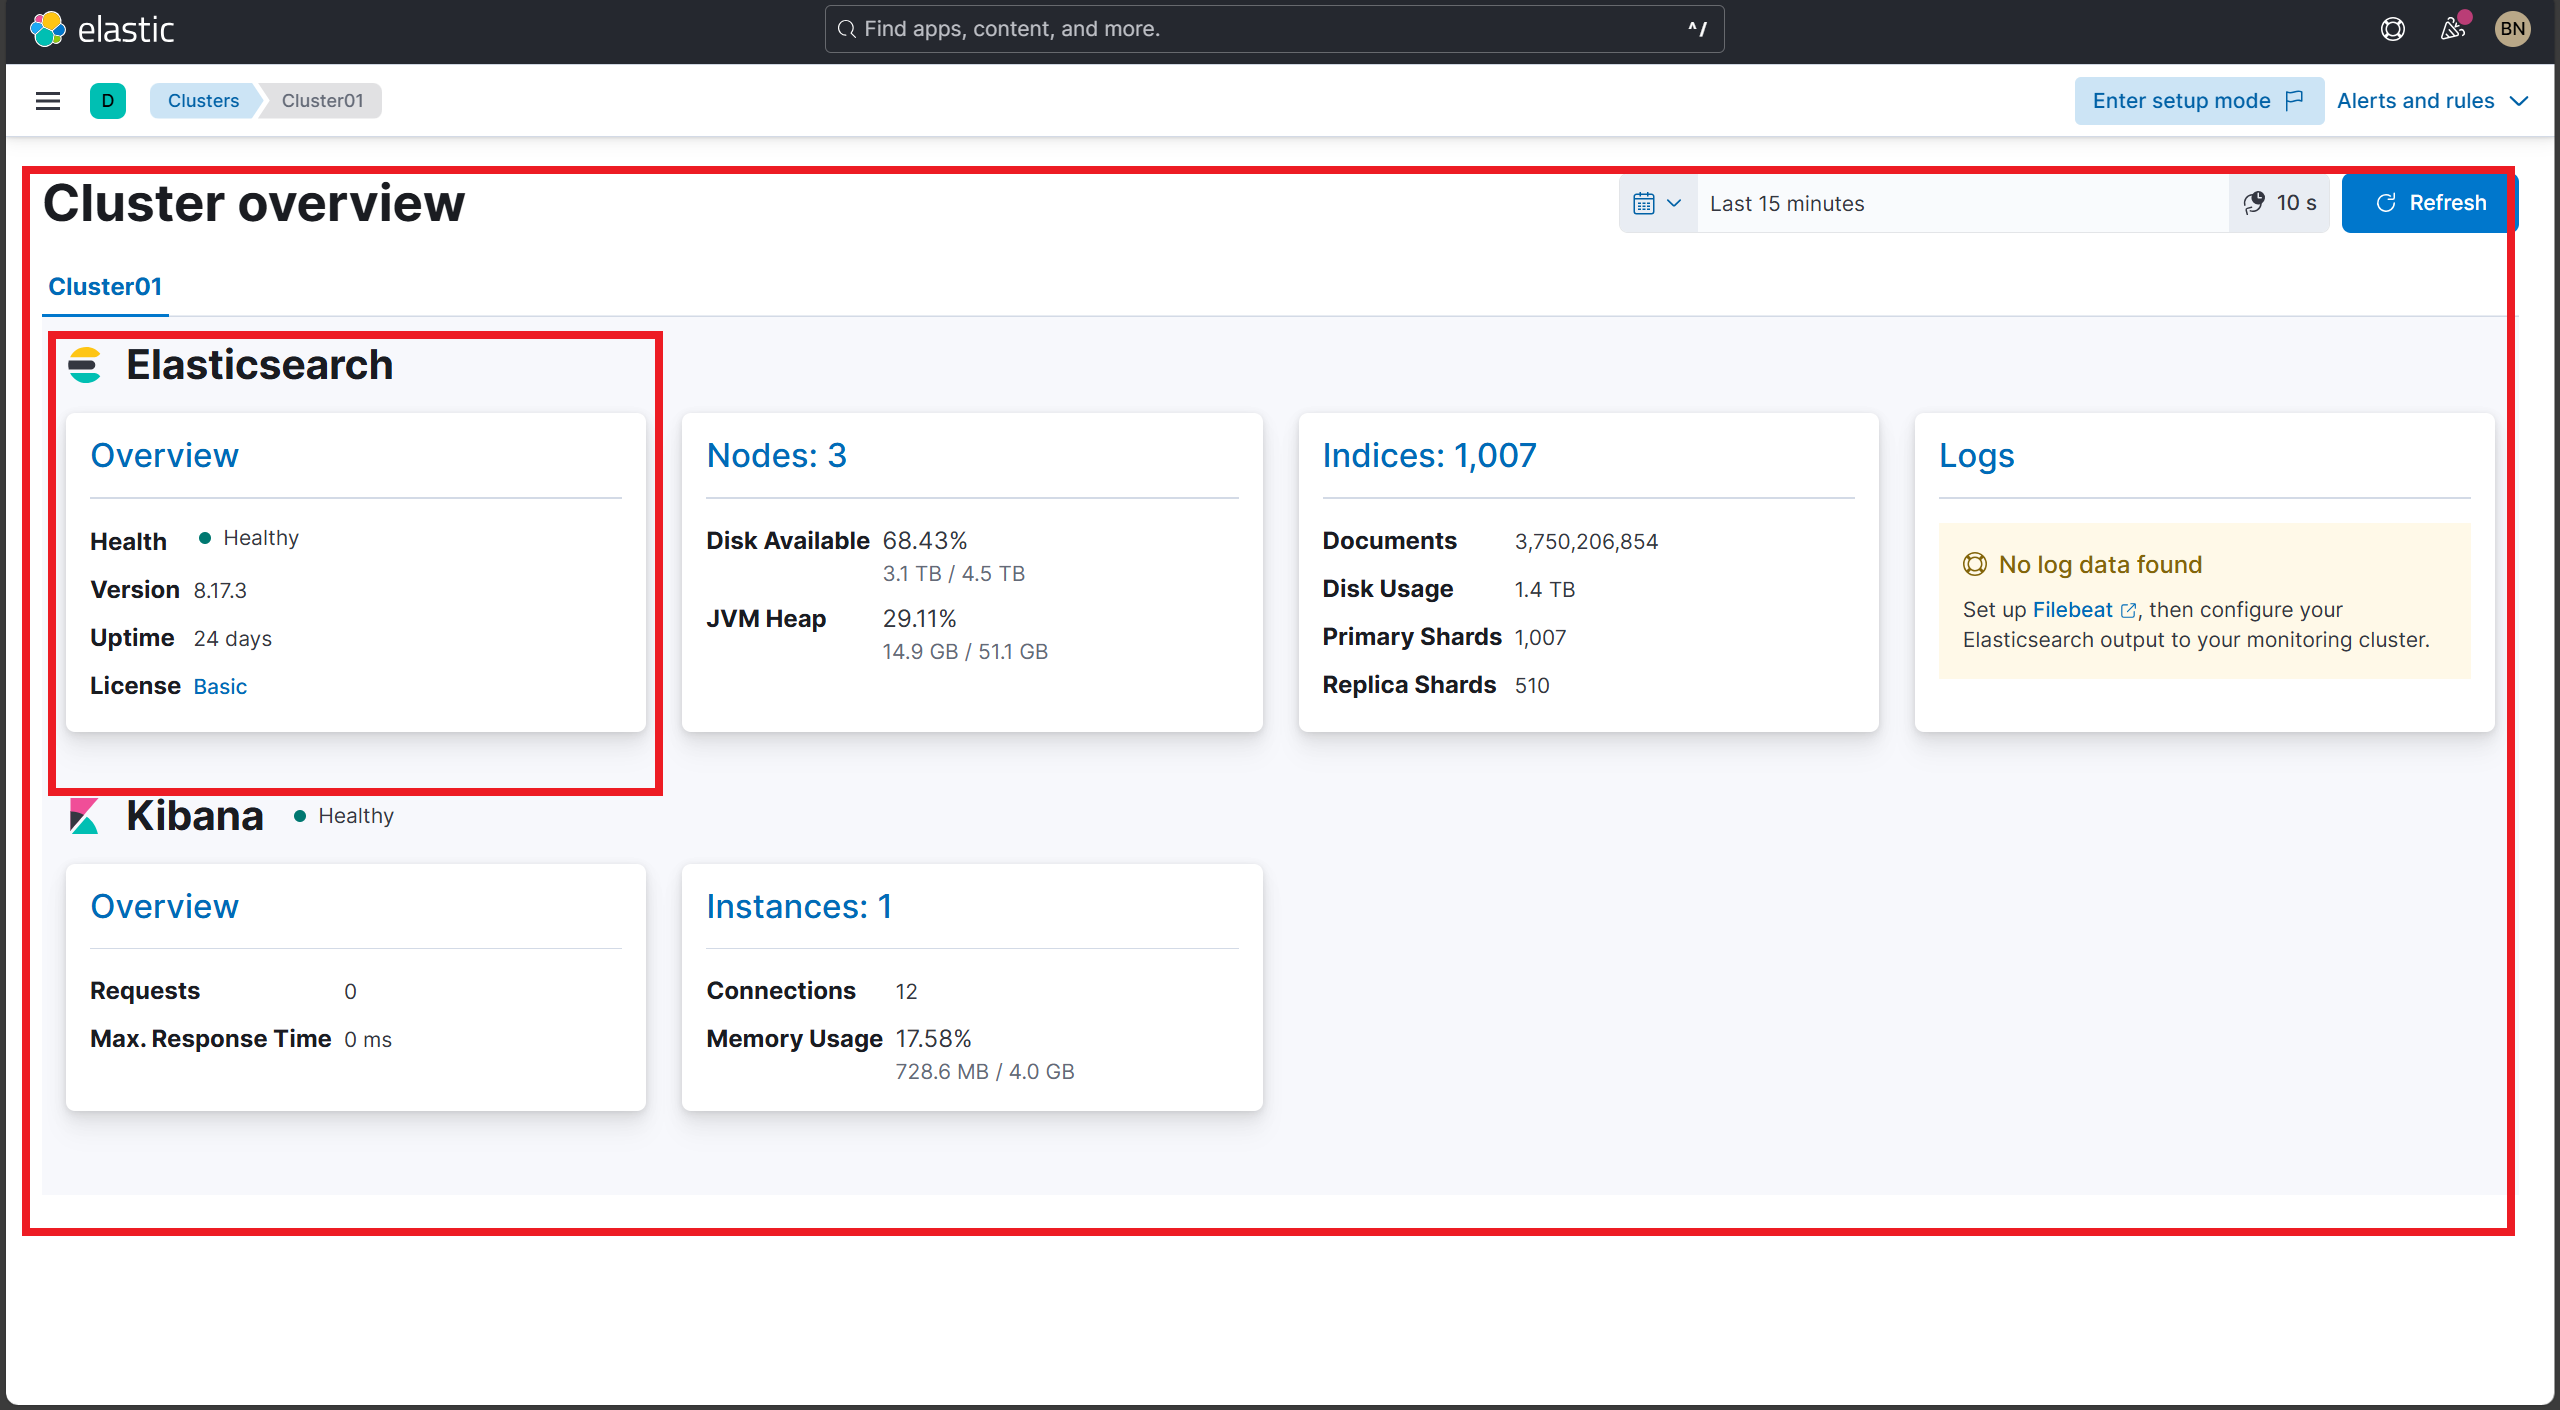
Verify cluster health summary
Confirm cluster health status, total nodes, shards, indices, and document count are displayed and accurate.
Steps:
- Locate the Cluster Health Summary panel.
- Validate:
- Cluster status (Green, Yellow, Red) — expect Green for healthy cluster.
- Number of nodes.
- Number of indices.
- Total shards and unassigned shards.
- Total documents.
- Data size.
Expected Result:
- Under any Data Store Dashboard, click on Cluster Overview link.
- Verify cluster health is Green (Healthy).
- Nodes, shards, indices, and documents display current, non-zero values.
- No unassigned shards.
- Data size is displayed accurately.
Screenshot:
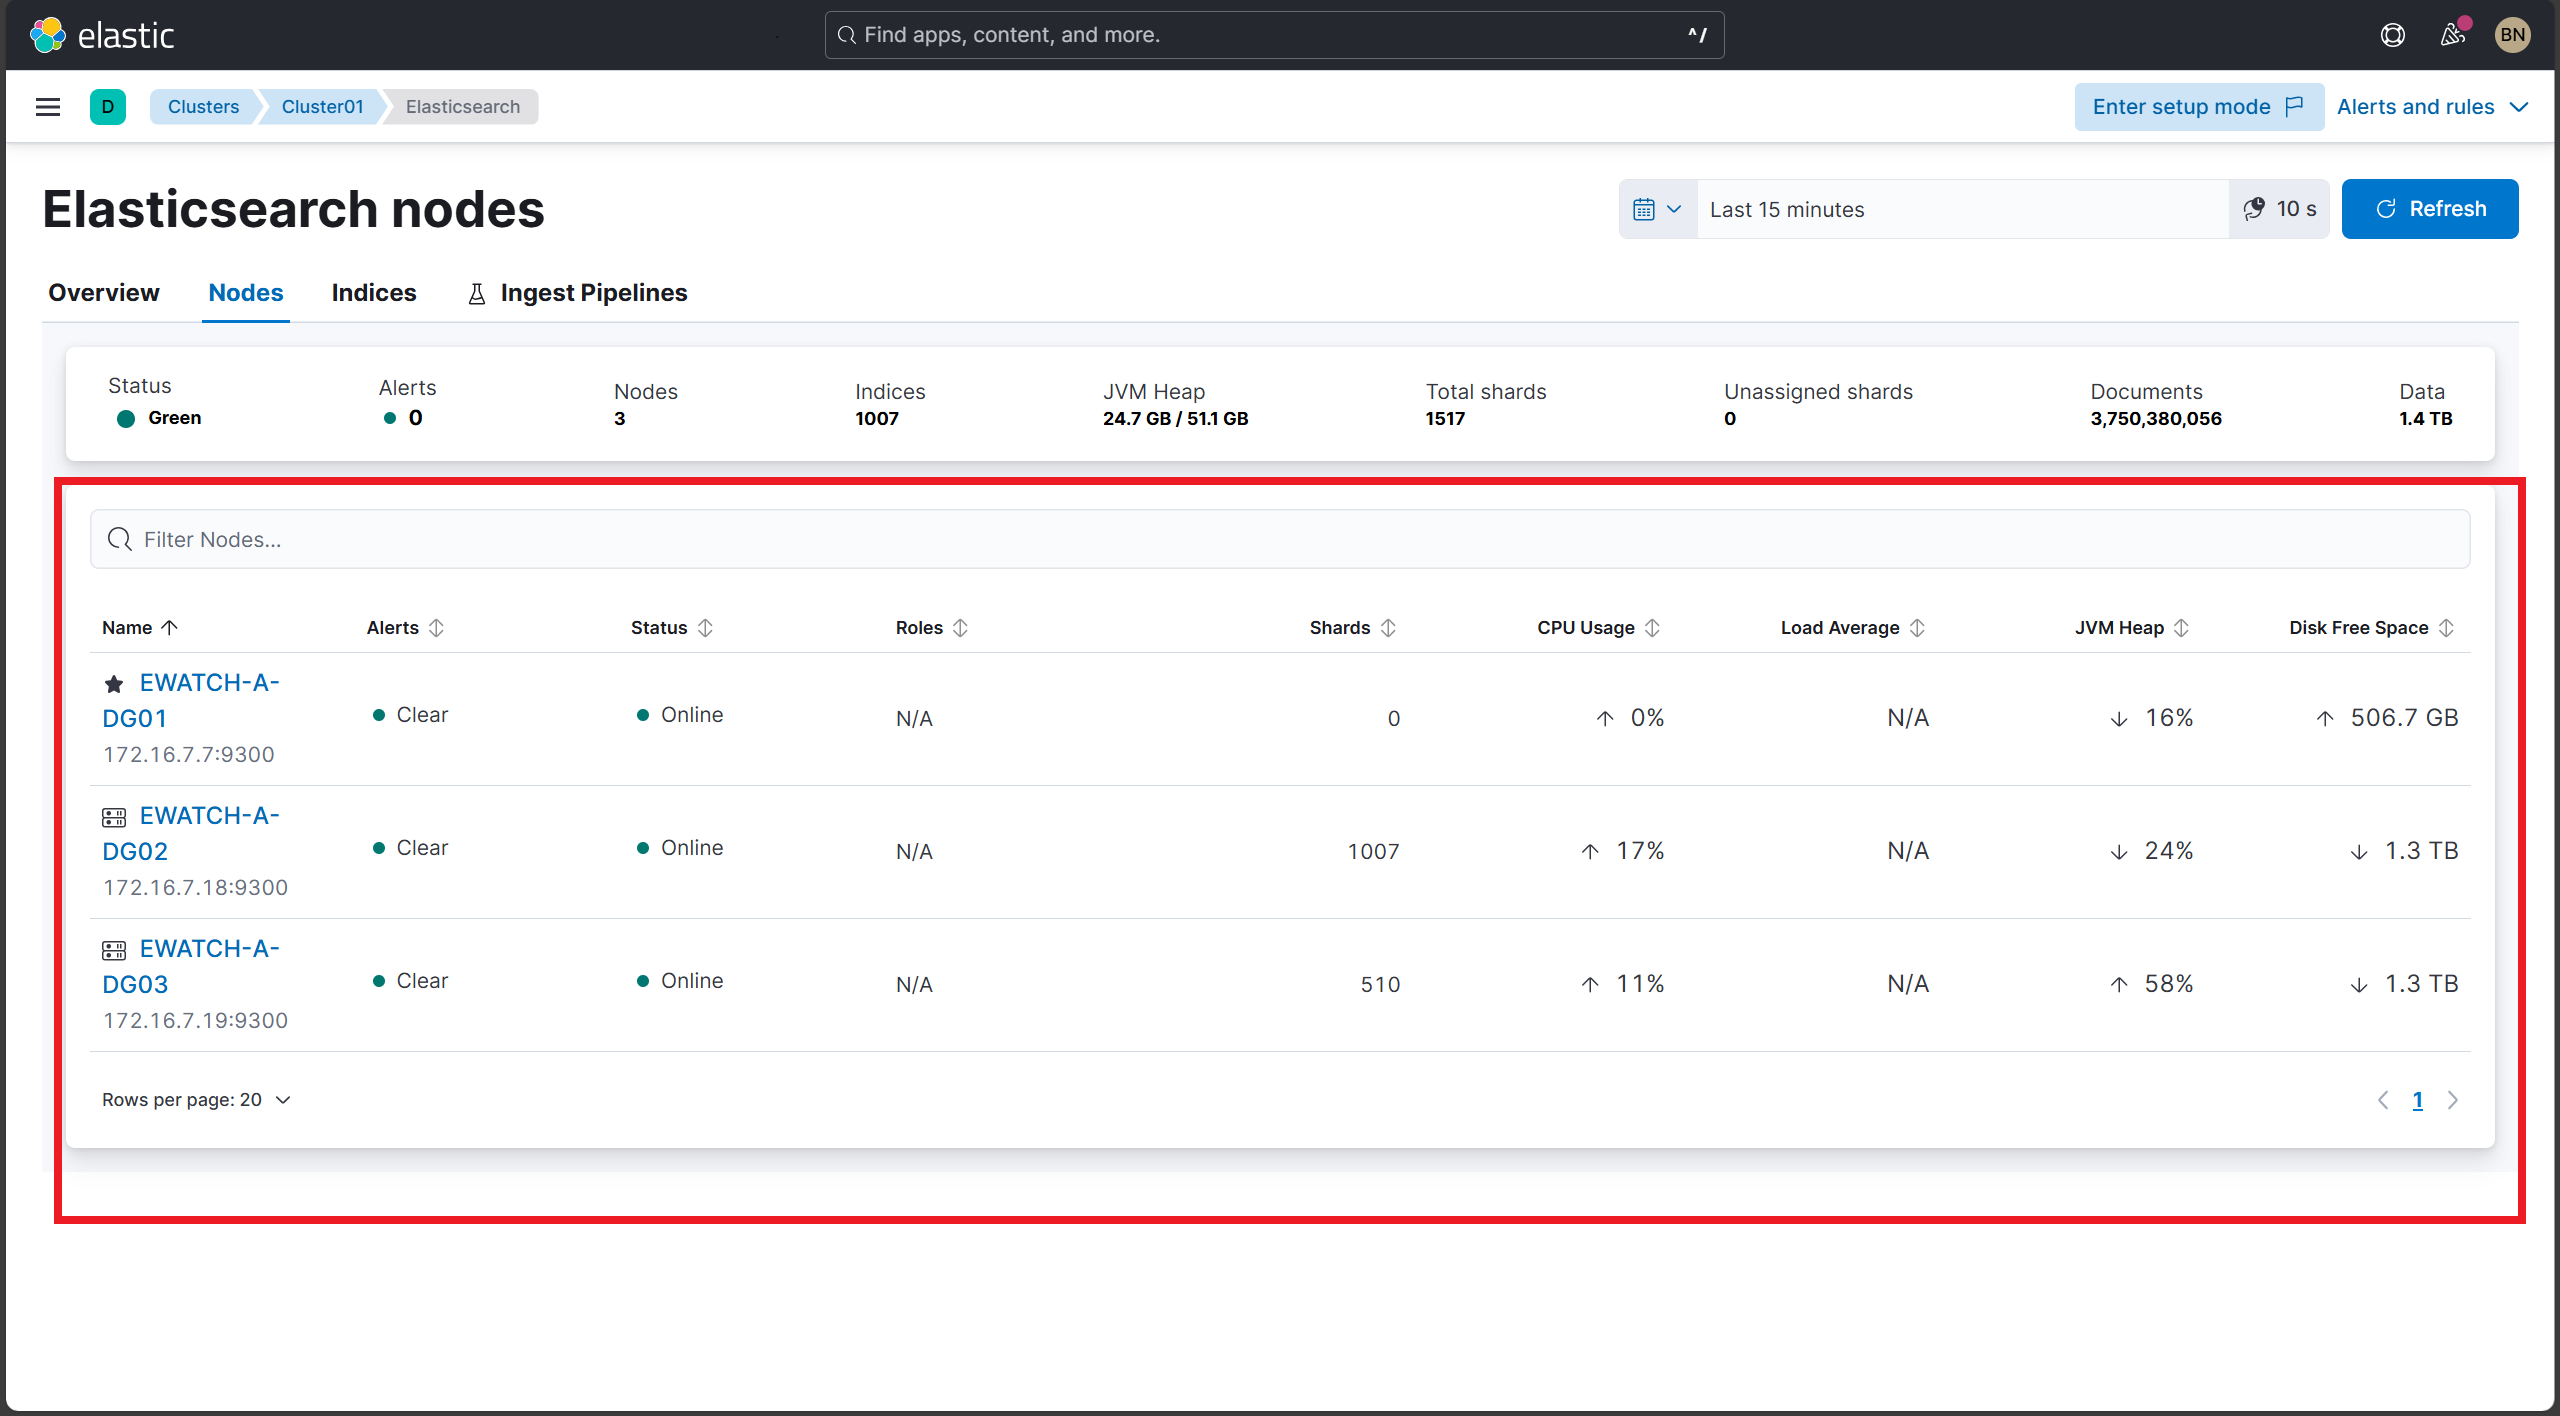
Verify node metrics
Ensure node-level metrics such as CPU usage, JVM heap usage, and disk space are reported per node.
Steps:
- Open the Node Metrics or Elasticsearch Nodes panel.
- Confirm each node shows:
- Status (Online).
- CPU usage (percentage).
- JVM heap usage (percentage).
- Disk free space.
- Load Average (may be unavailable, verify if data present).
Expected Result:
- All nodes listed.
- CPU, JVM heap %, and disk free space values present.
- Load average may show as N/A if unsupported but should be monitored for future inclusion.
Screenshot:
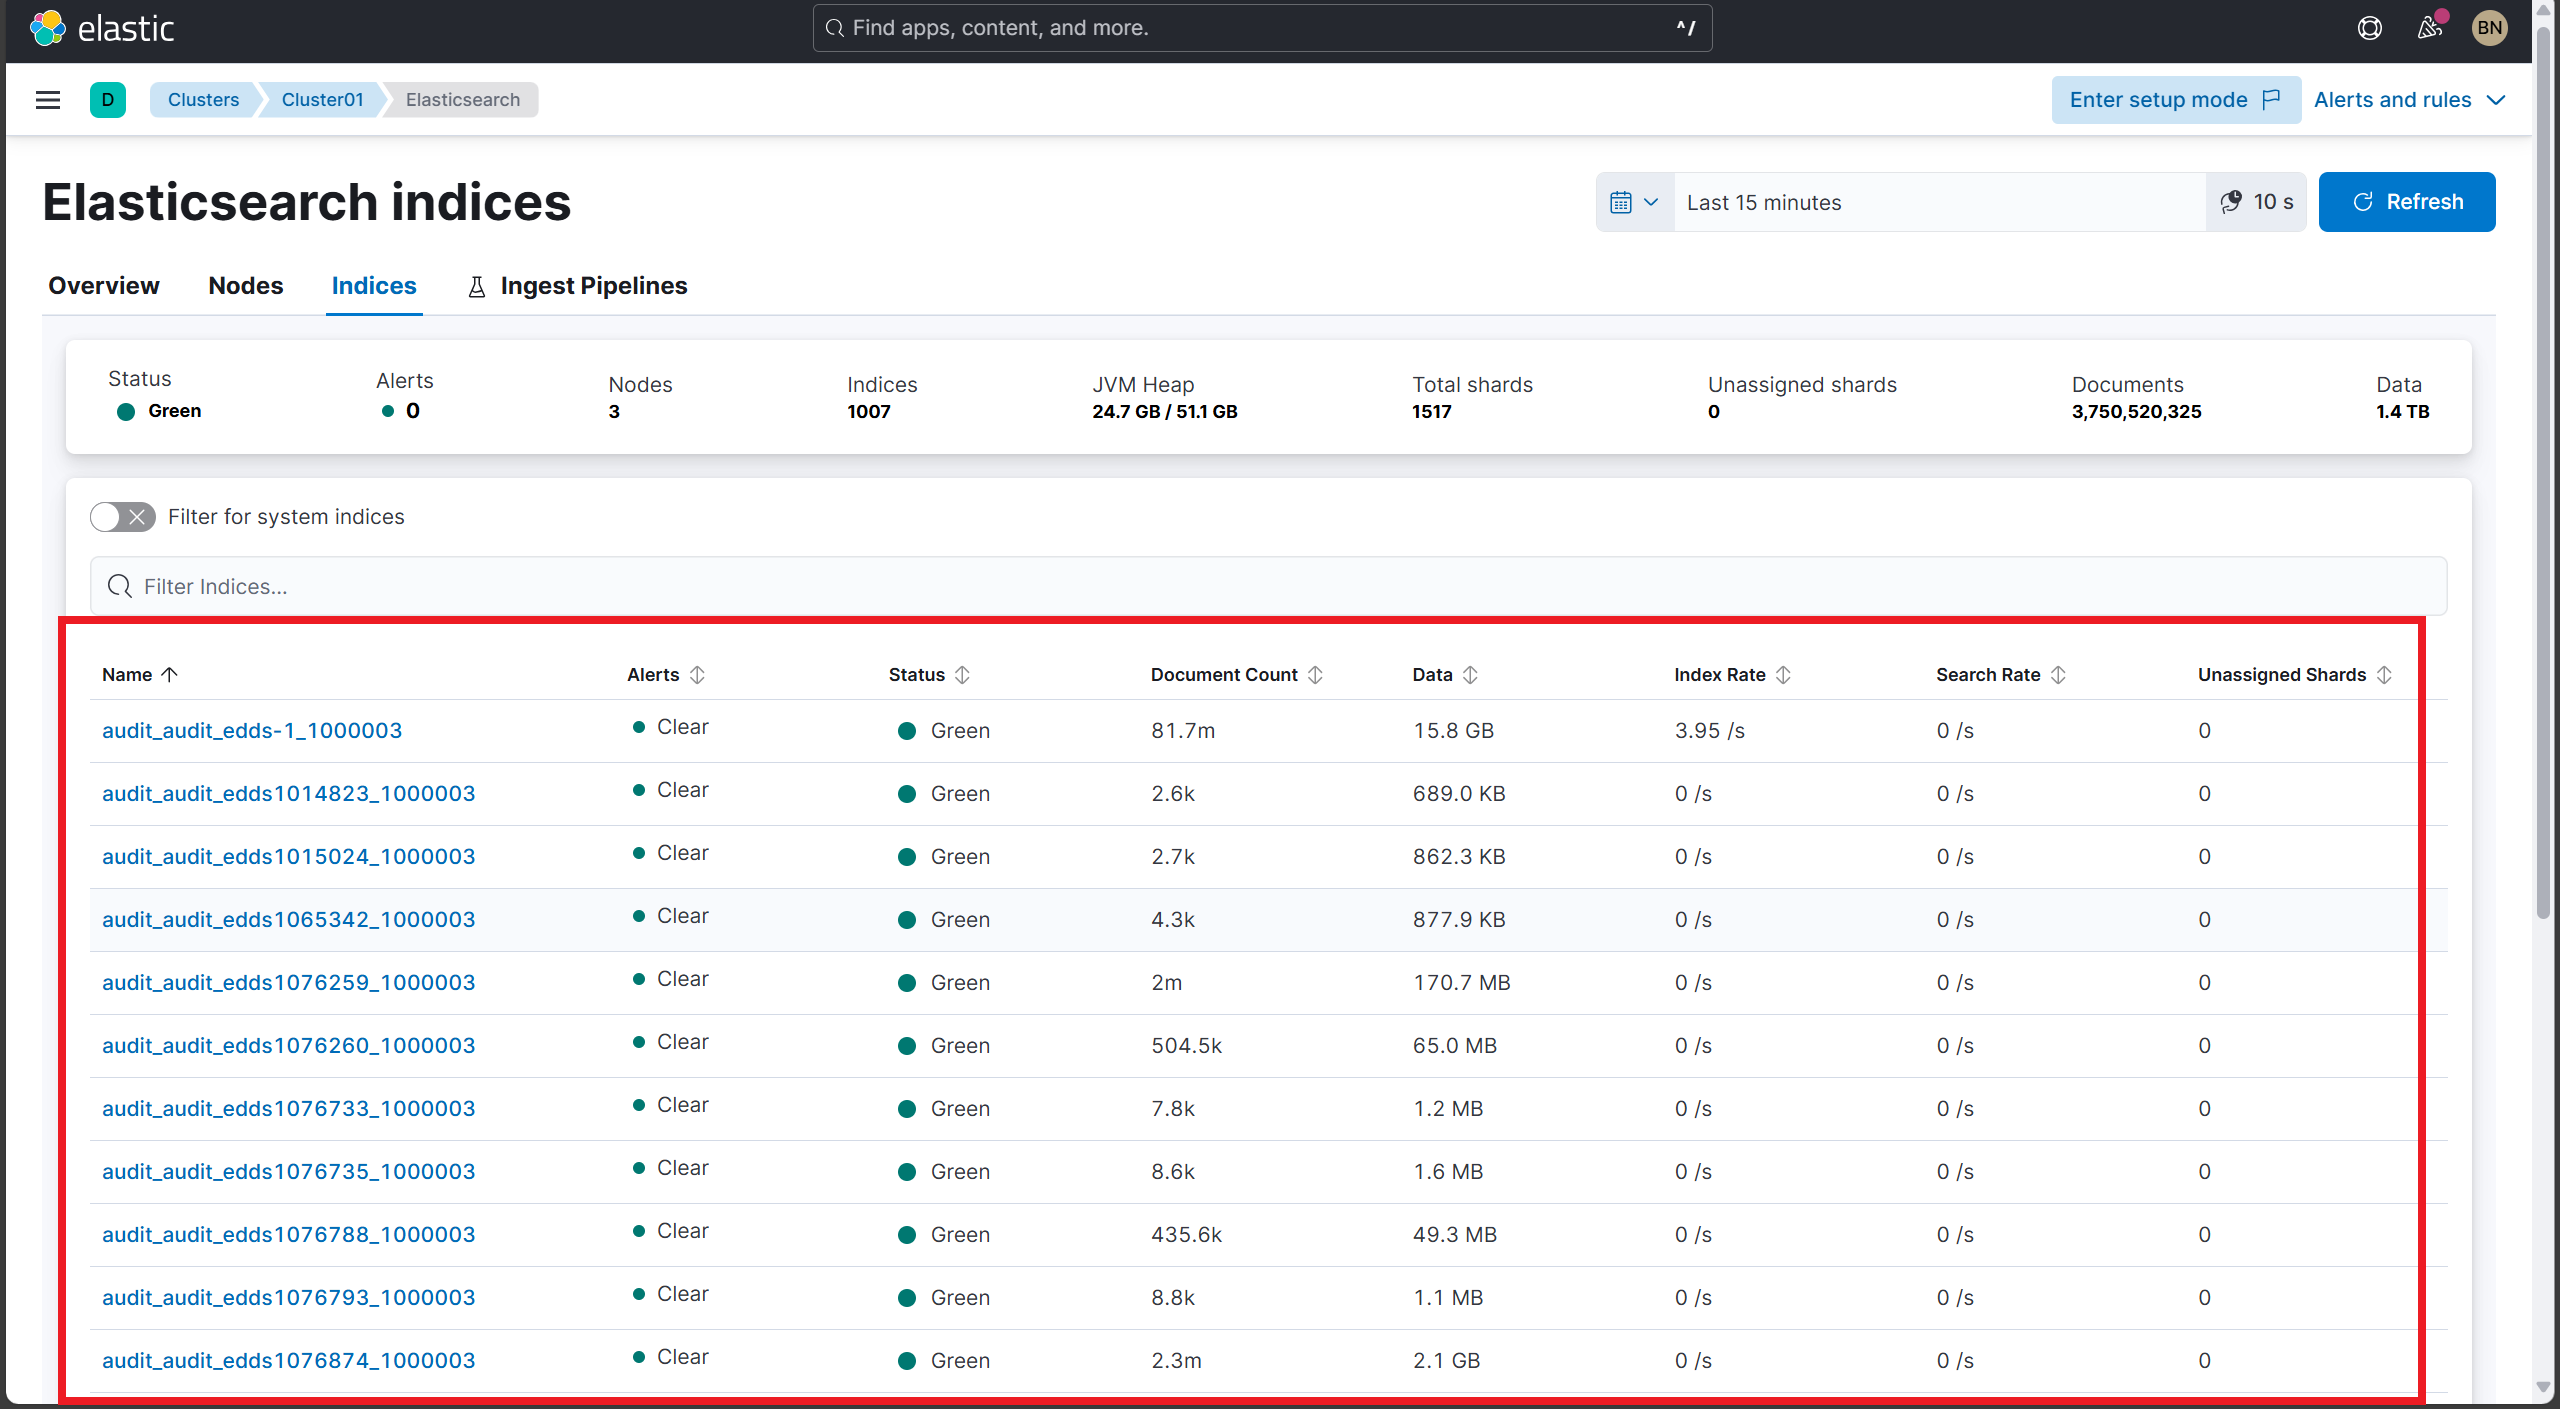
Verify index statistics
Validate index-level metrics including document counts, data size, indexing rate, and search rate.
Steps:
- Open the Indices panel.
- Review per-index data such as:
- Document count.
- Data size.
- Indexing rate (docs per second).
- Search rate (queries per second).
- Unassigned shards (should be zero).
- Check for any alerts or warnings on indices.
Expected Result:
- Per-index document counts and data sizes are populated.
- Indexing and search rates update regularly.
- No unassigned shards.
- Alerts show clear or no issues on indices.
Screenshot:
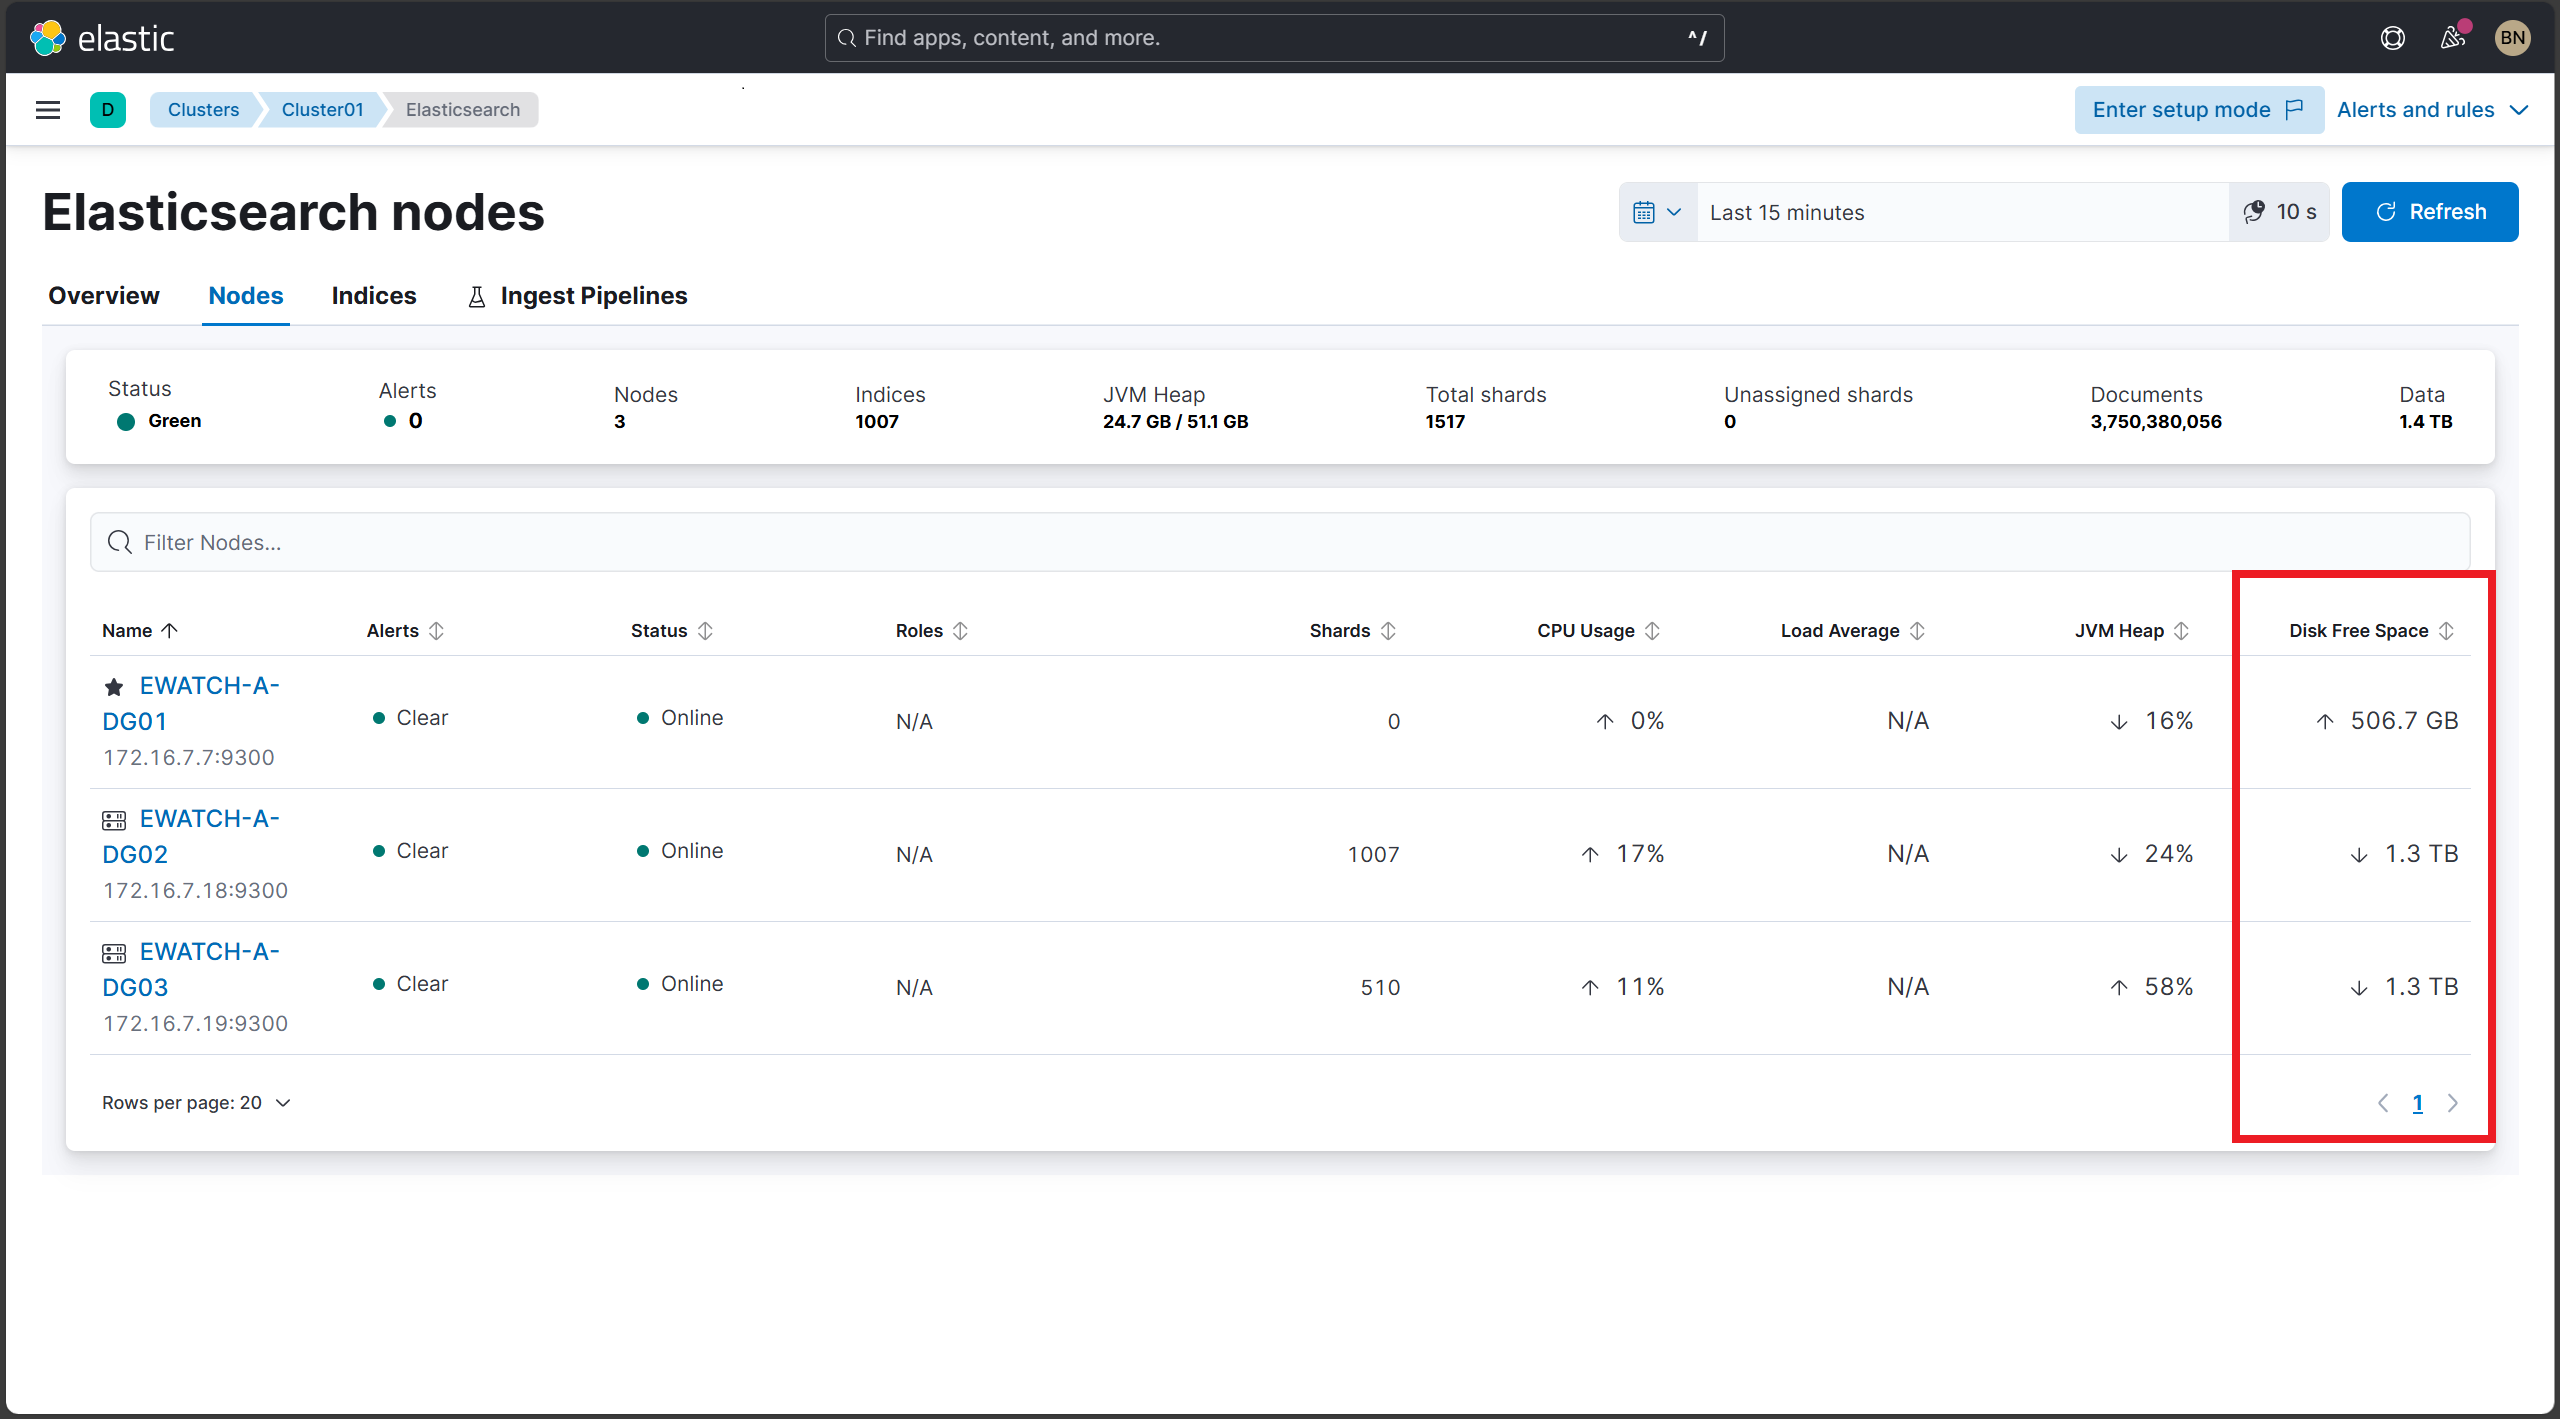
Verify disk and storage utilization
Ensure disk free space and usage metrics are visible for each node.
Steps:
- Check disk free space shown per node in the Node Metrics panel.
- Confirm reported disk free space aligns with expectations.
Expected Result:
- Disk free space values displayed for all nodes.
- No fields marked as N/A for disk metrics.
Screenshot: