Feedback
Post-Install Verification for Alerts
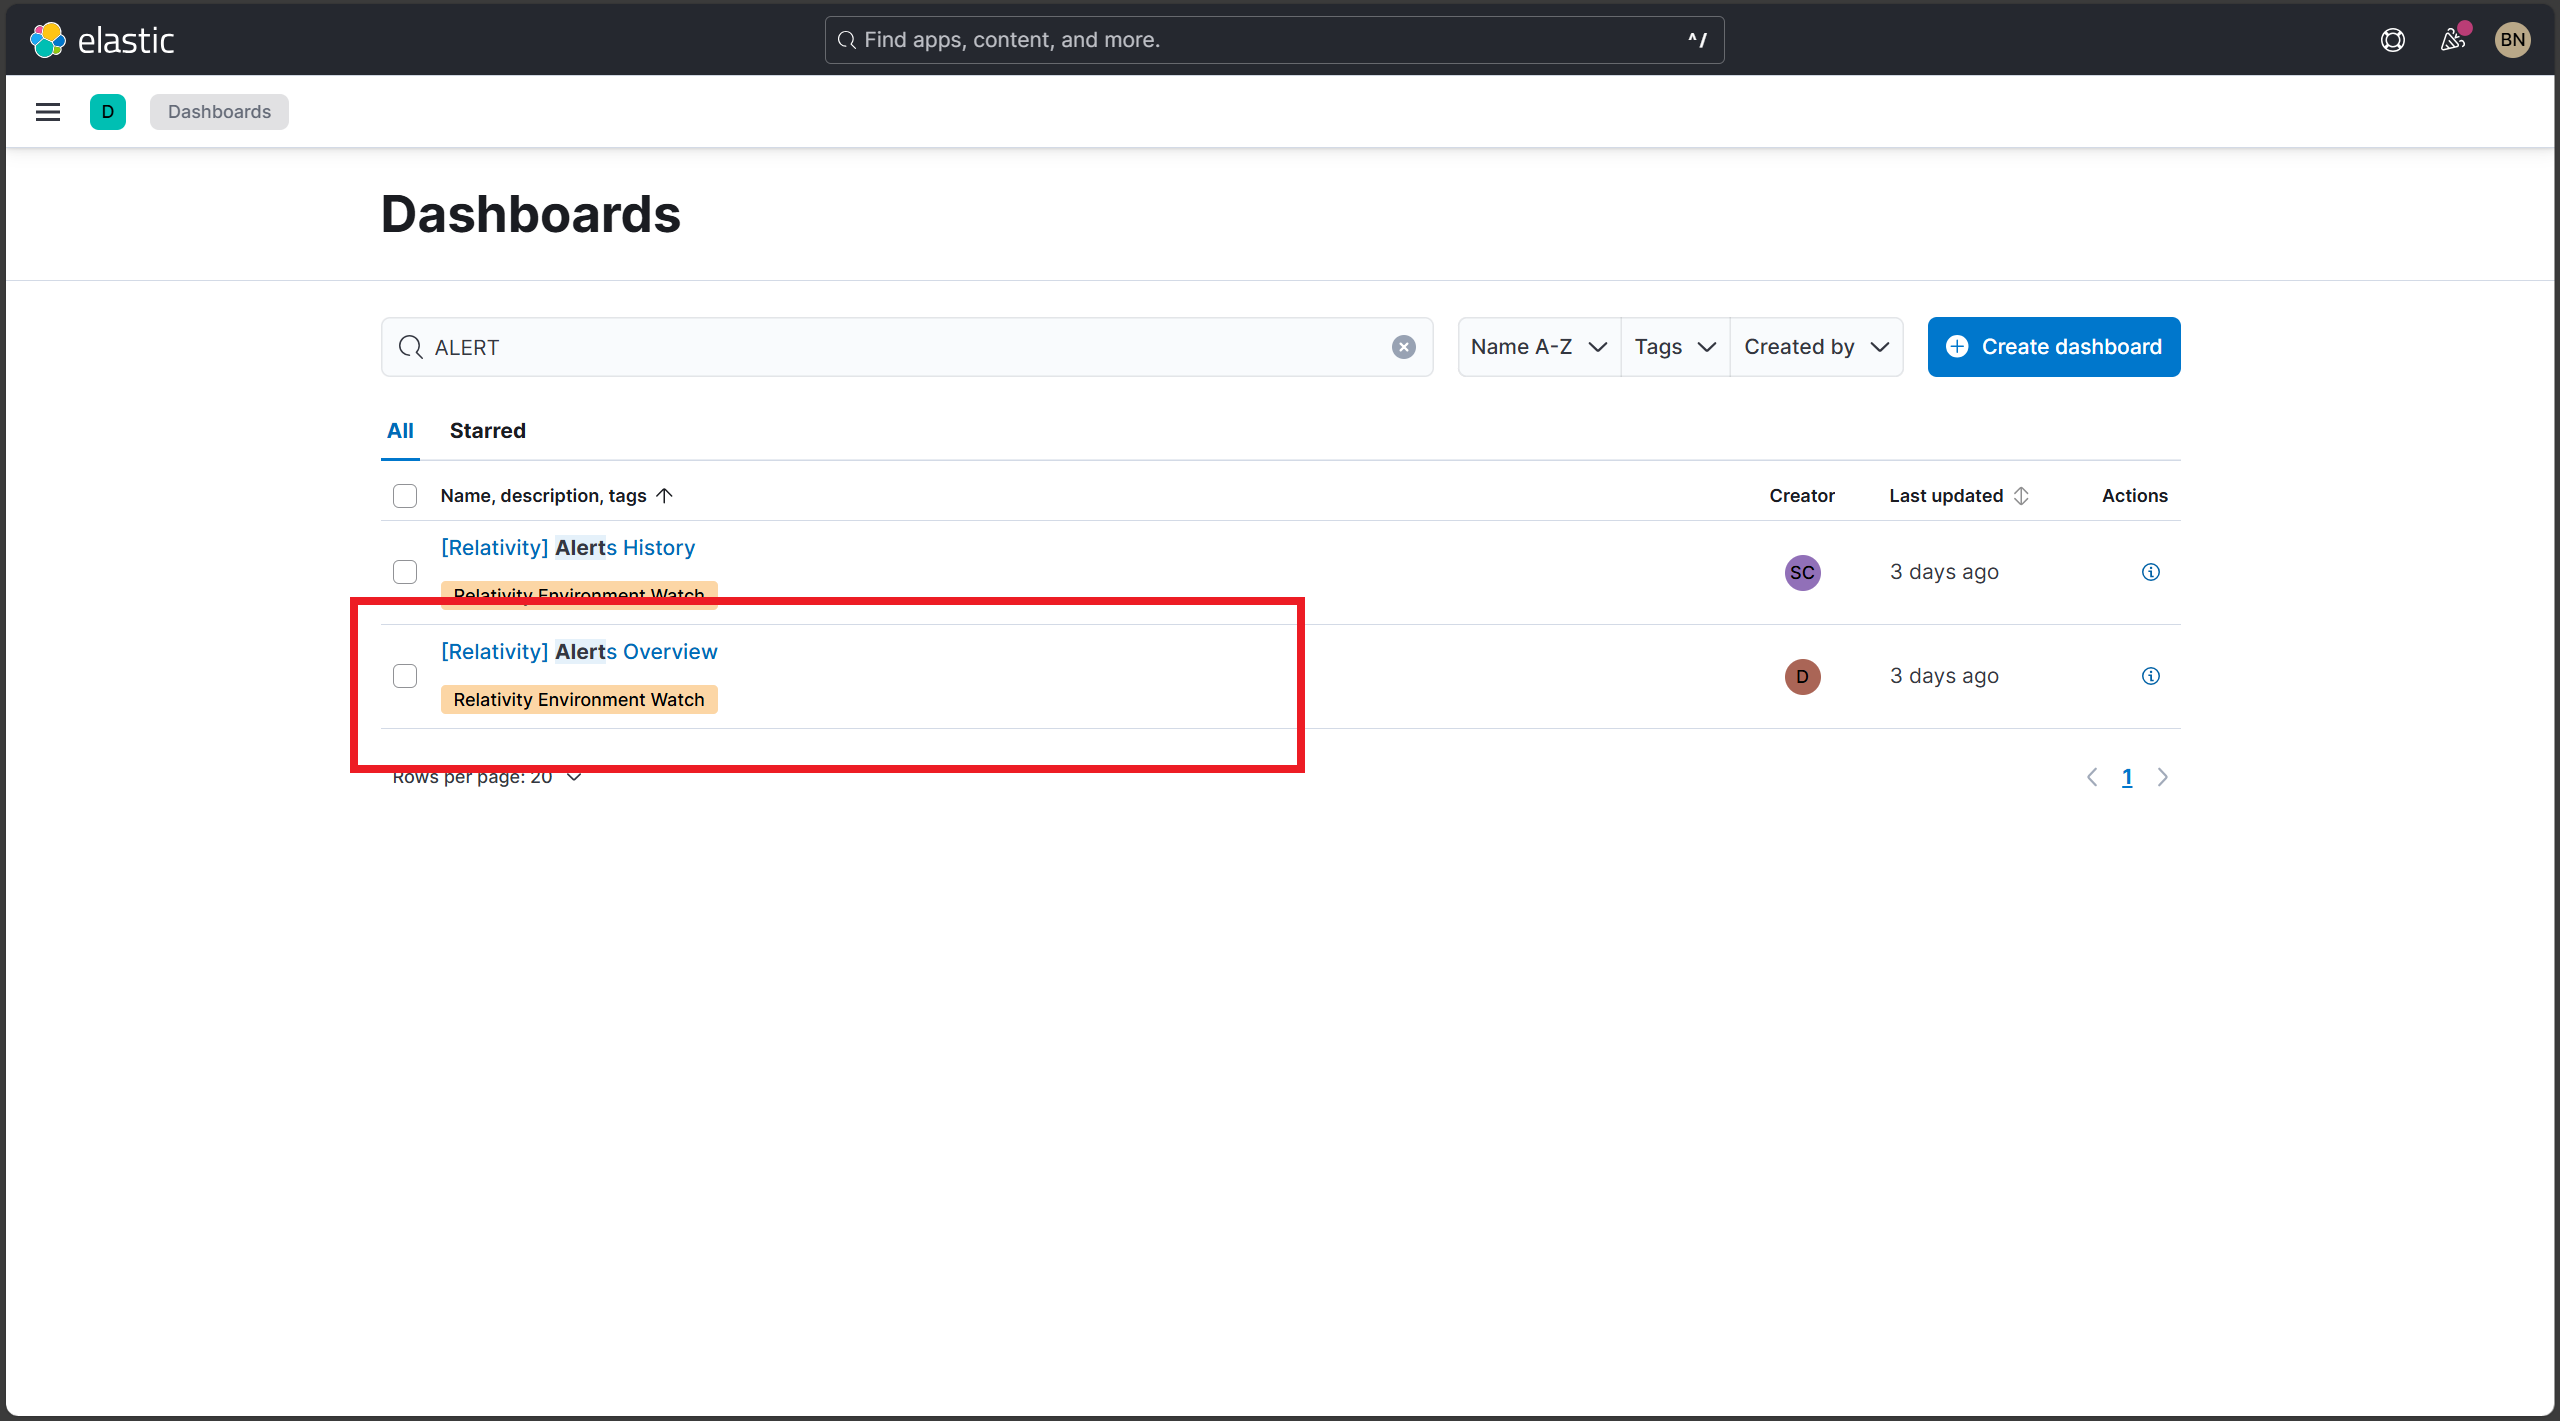
Verify that the dashboard exists
Ensure that the [Relativity] Alerts Overview dashboard is successfully installed and visible in Kibana.
Steps:
- Open Microsoft Edge.
- Navigate to Kibana.
- In Kibana, go to Dashboards.
- Use the search bar to search for
Alerts Overview. - Select [Relativity] Alerts Overview from the results.
Expected Result:
- [Relativity] Alerts Overview appears in the dashboard list.
- The dashboard is accessible without errors.
Screenshot:
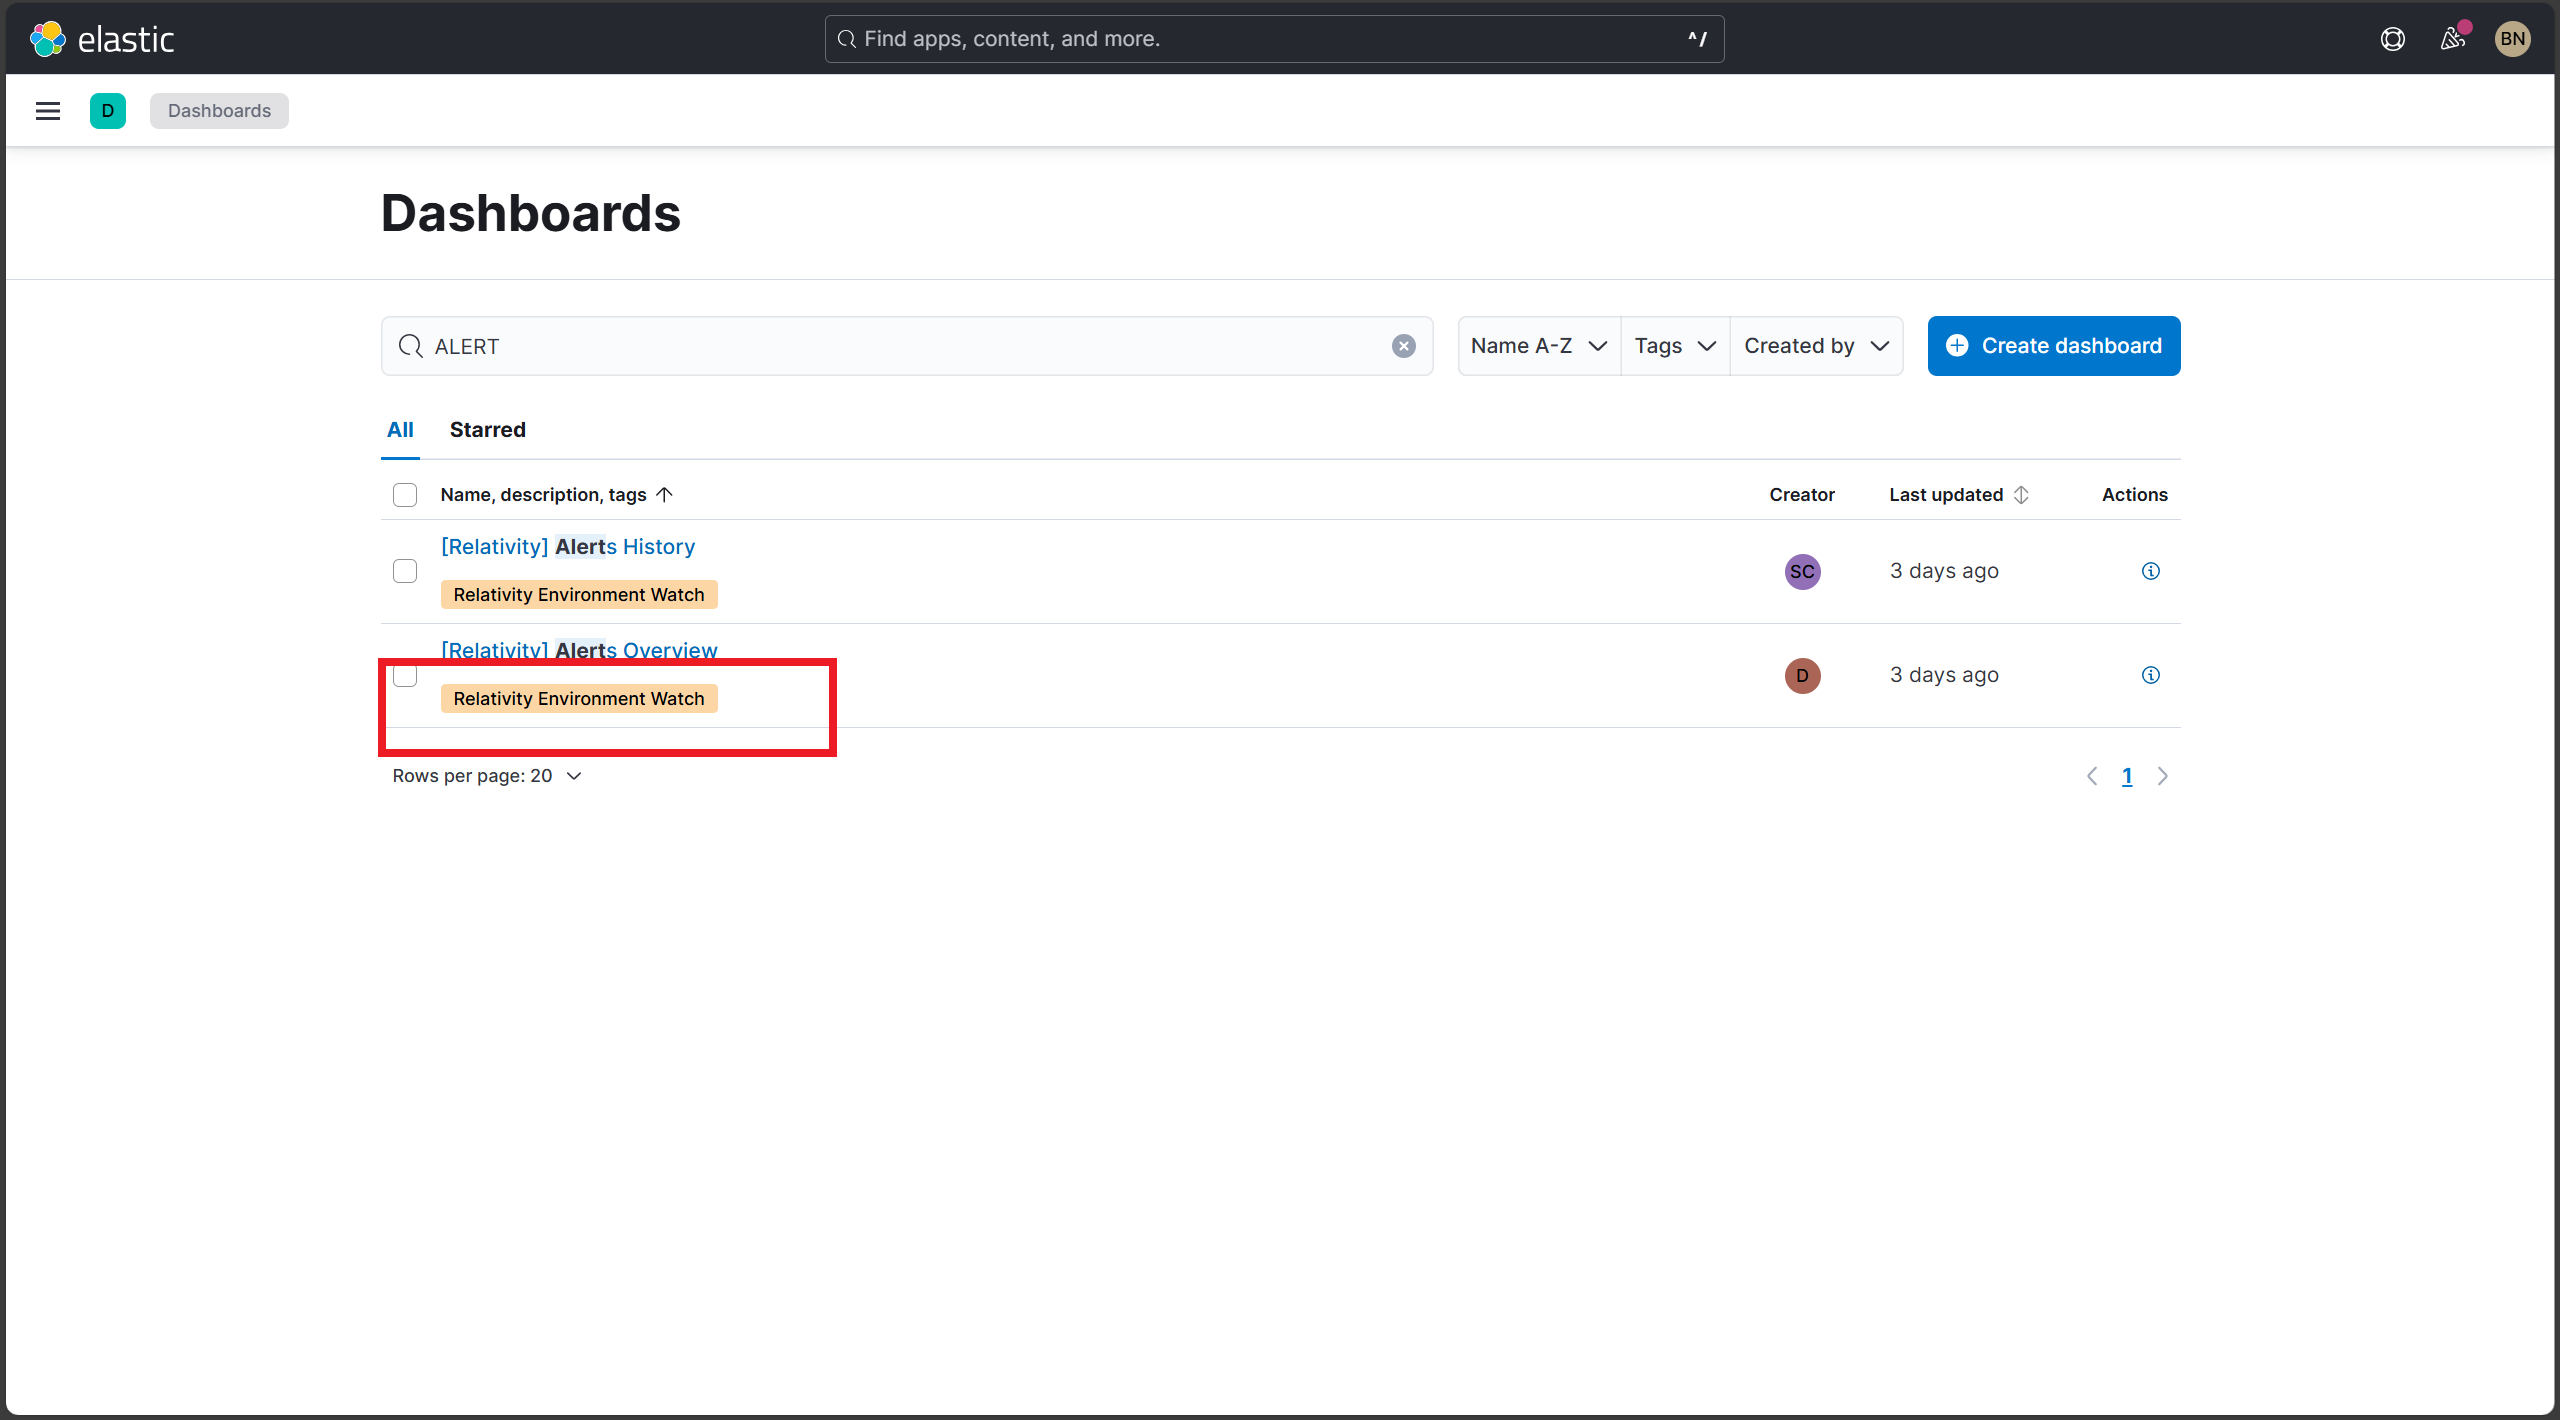
Verify the dashboard tag
Confirm that the correct tag is applied to the dashboard for proper categorization.
Steps:
- In Kibana, go to Dashboards.
- Search for
Alerts Overviewand select [Relativity] Alerts Overview. - Verify that the tag Relativity Environment Watch is displayed.
Expected Result:
- The dashboard includes the Relativity Environment Watch tag.
Screenshot:
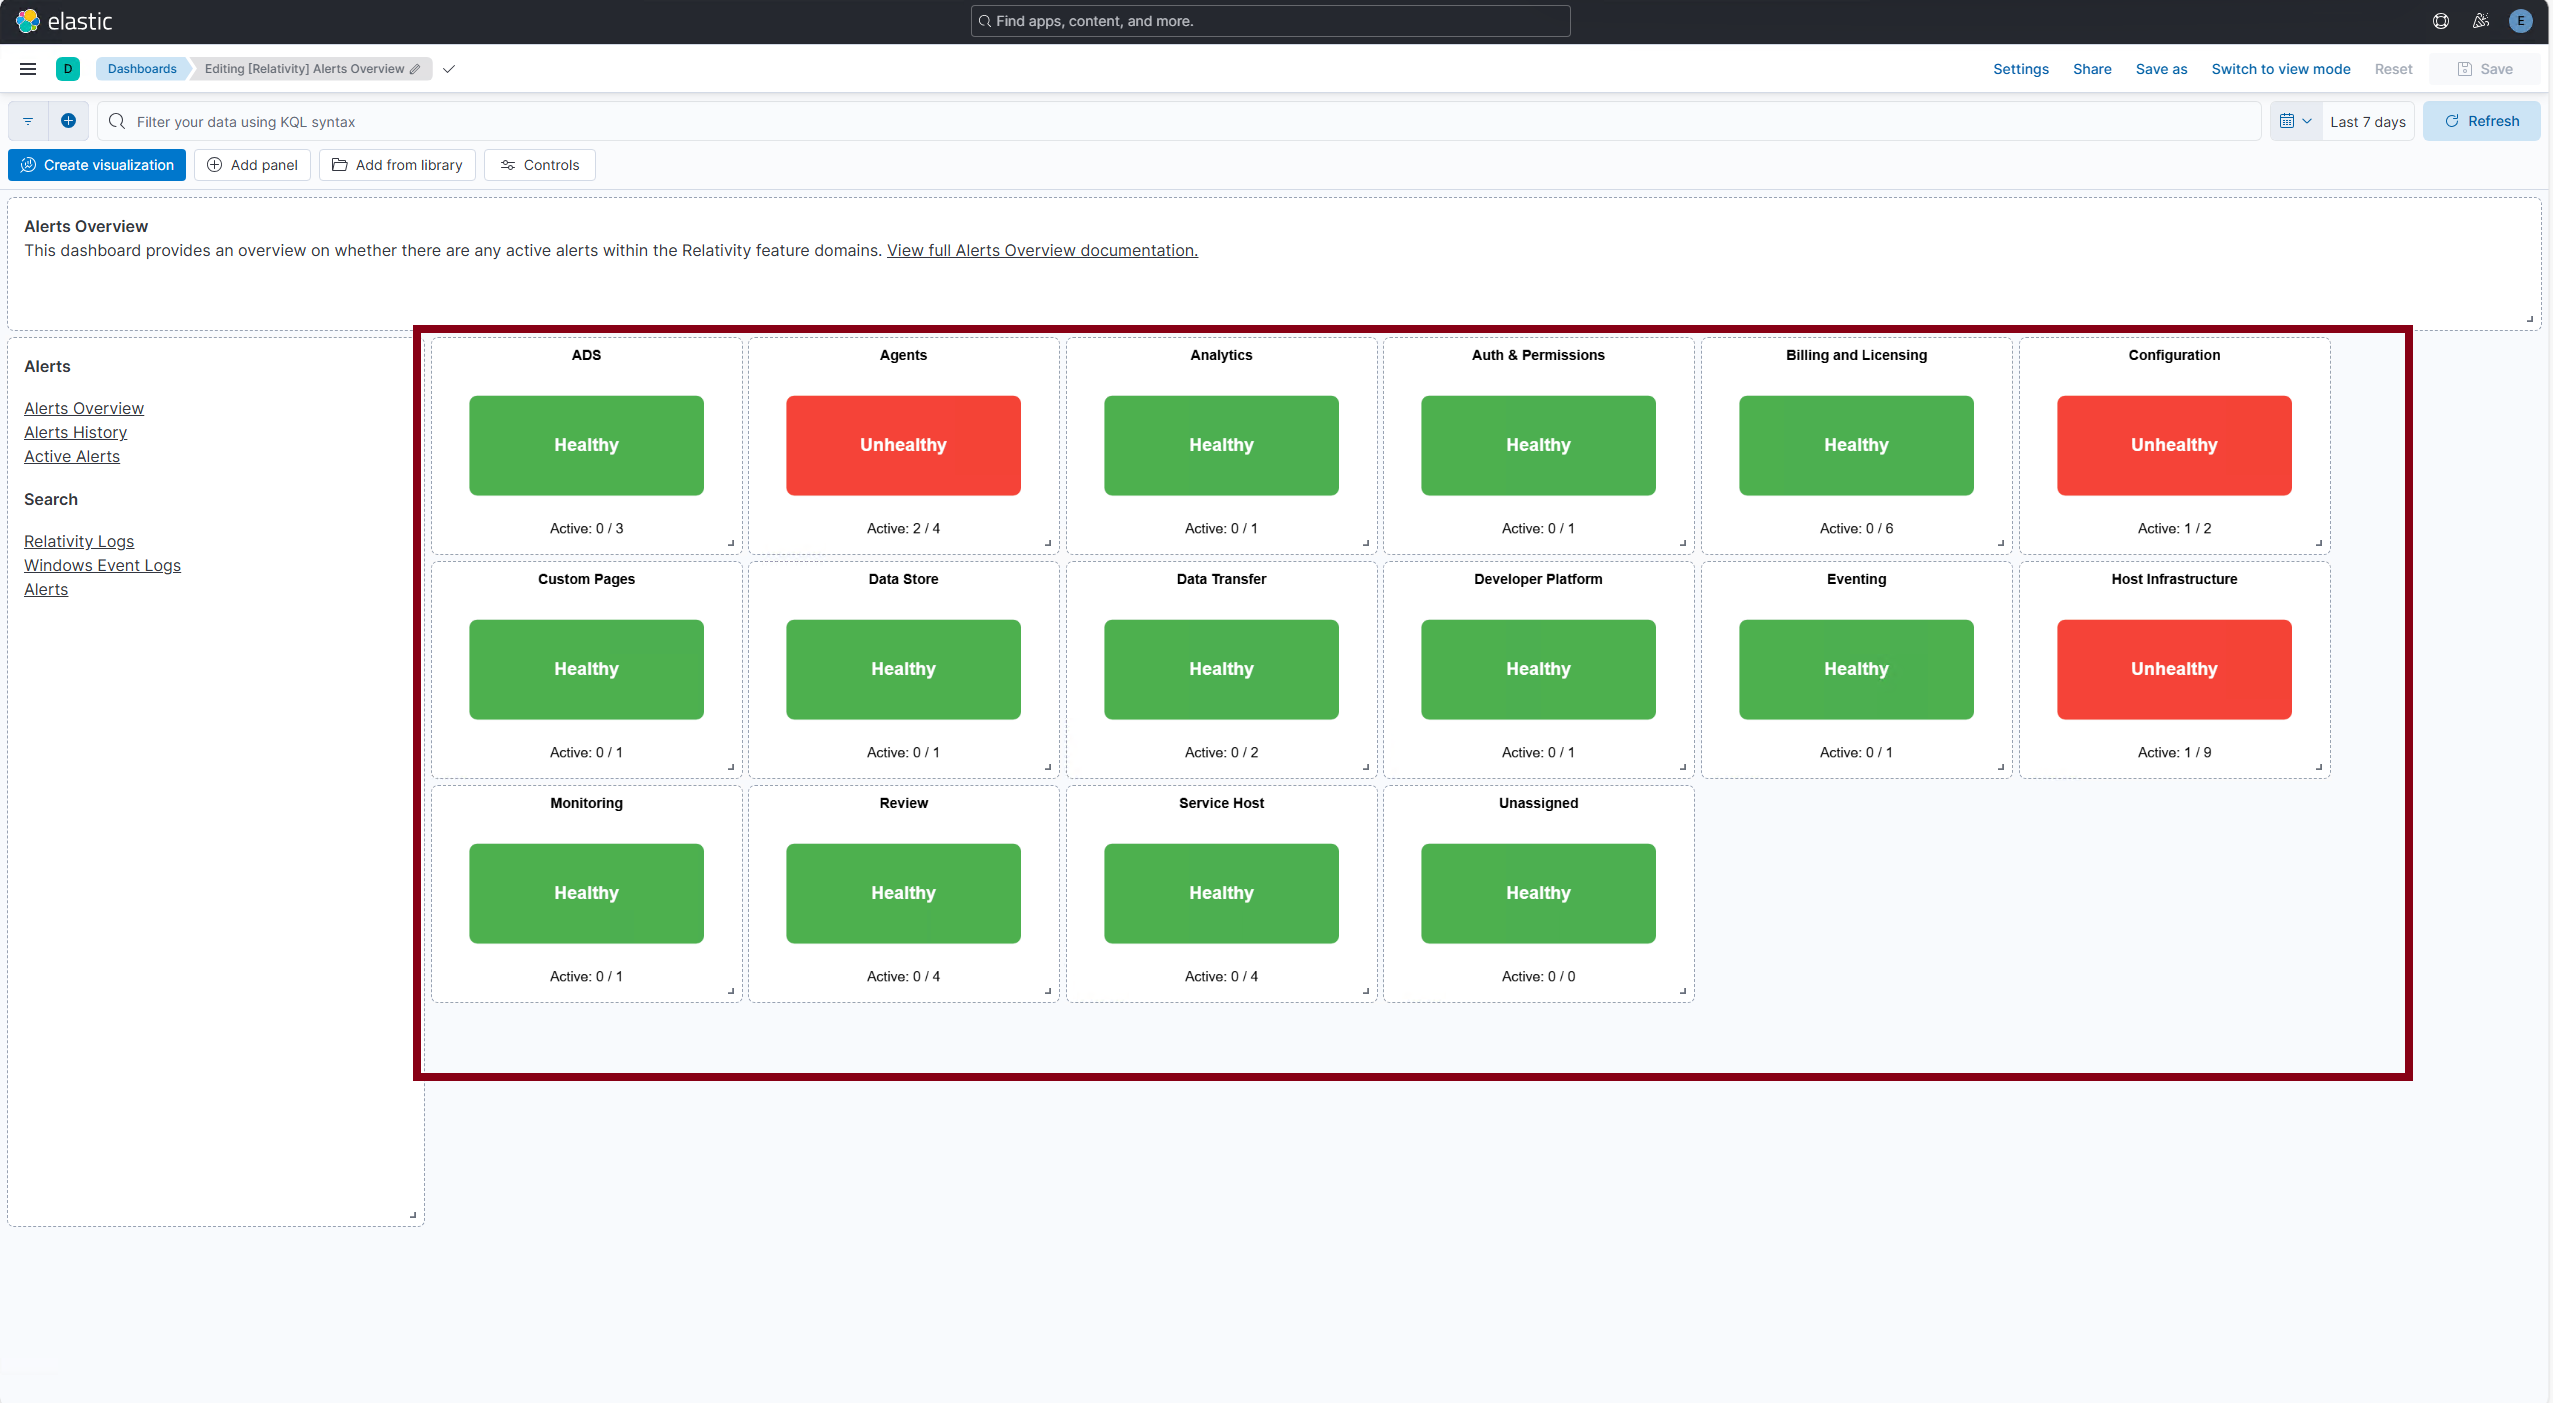
Verify that health indicators are displayed
Ensure that the health indicators section is visible at the top of the dashboard and follows the correct layout.
Steps:
- Click into [Relativity] Alerts Overview dashboard.
- Confirm that the health indicators appear at the top of the main content area.
- Confirm all tiles include a title, subtitle ("Healthy"), and color status.
Expected Result:
- Health indicators are present and aligned at the top.
- All indicators include:
- Title (e.g., "Agents", "Monitoring")
- Subtitle: Healthy
- Color: Green or Red based on alert state.
Screenshot:
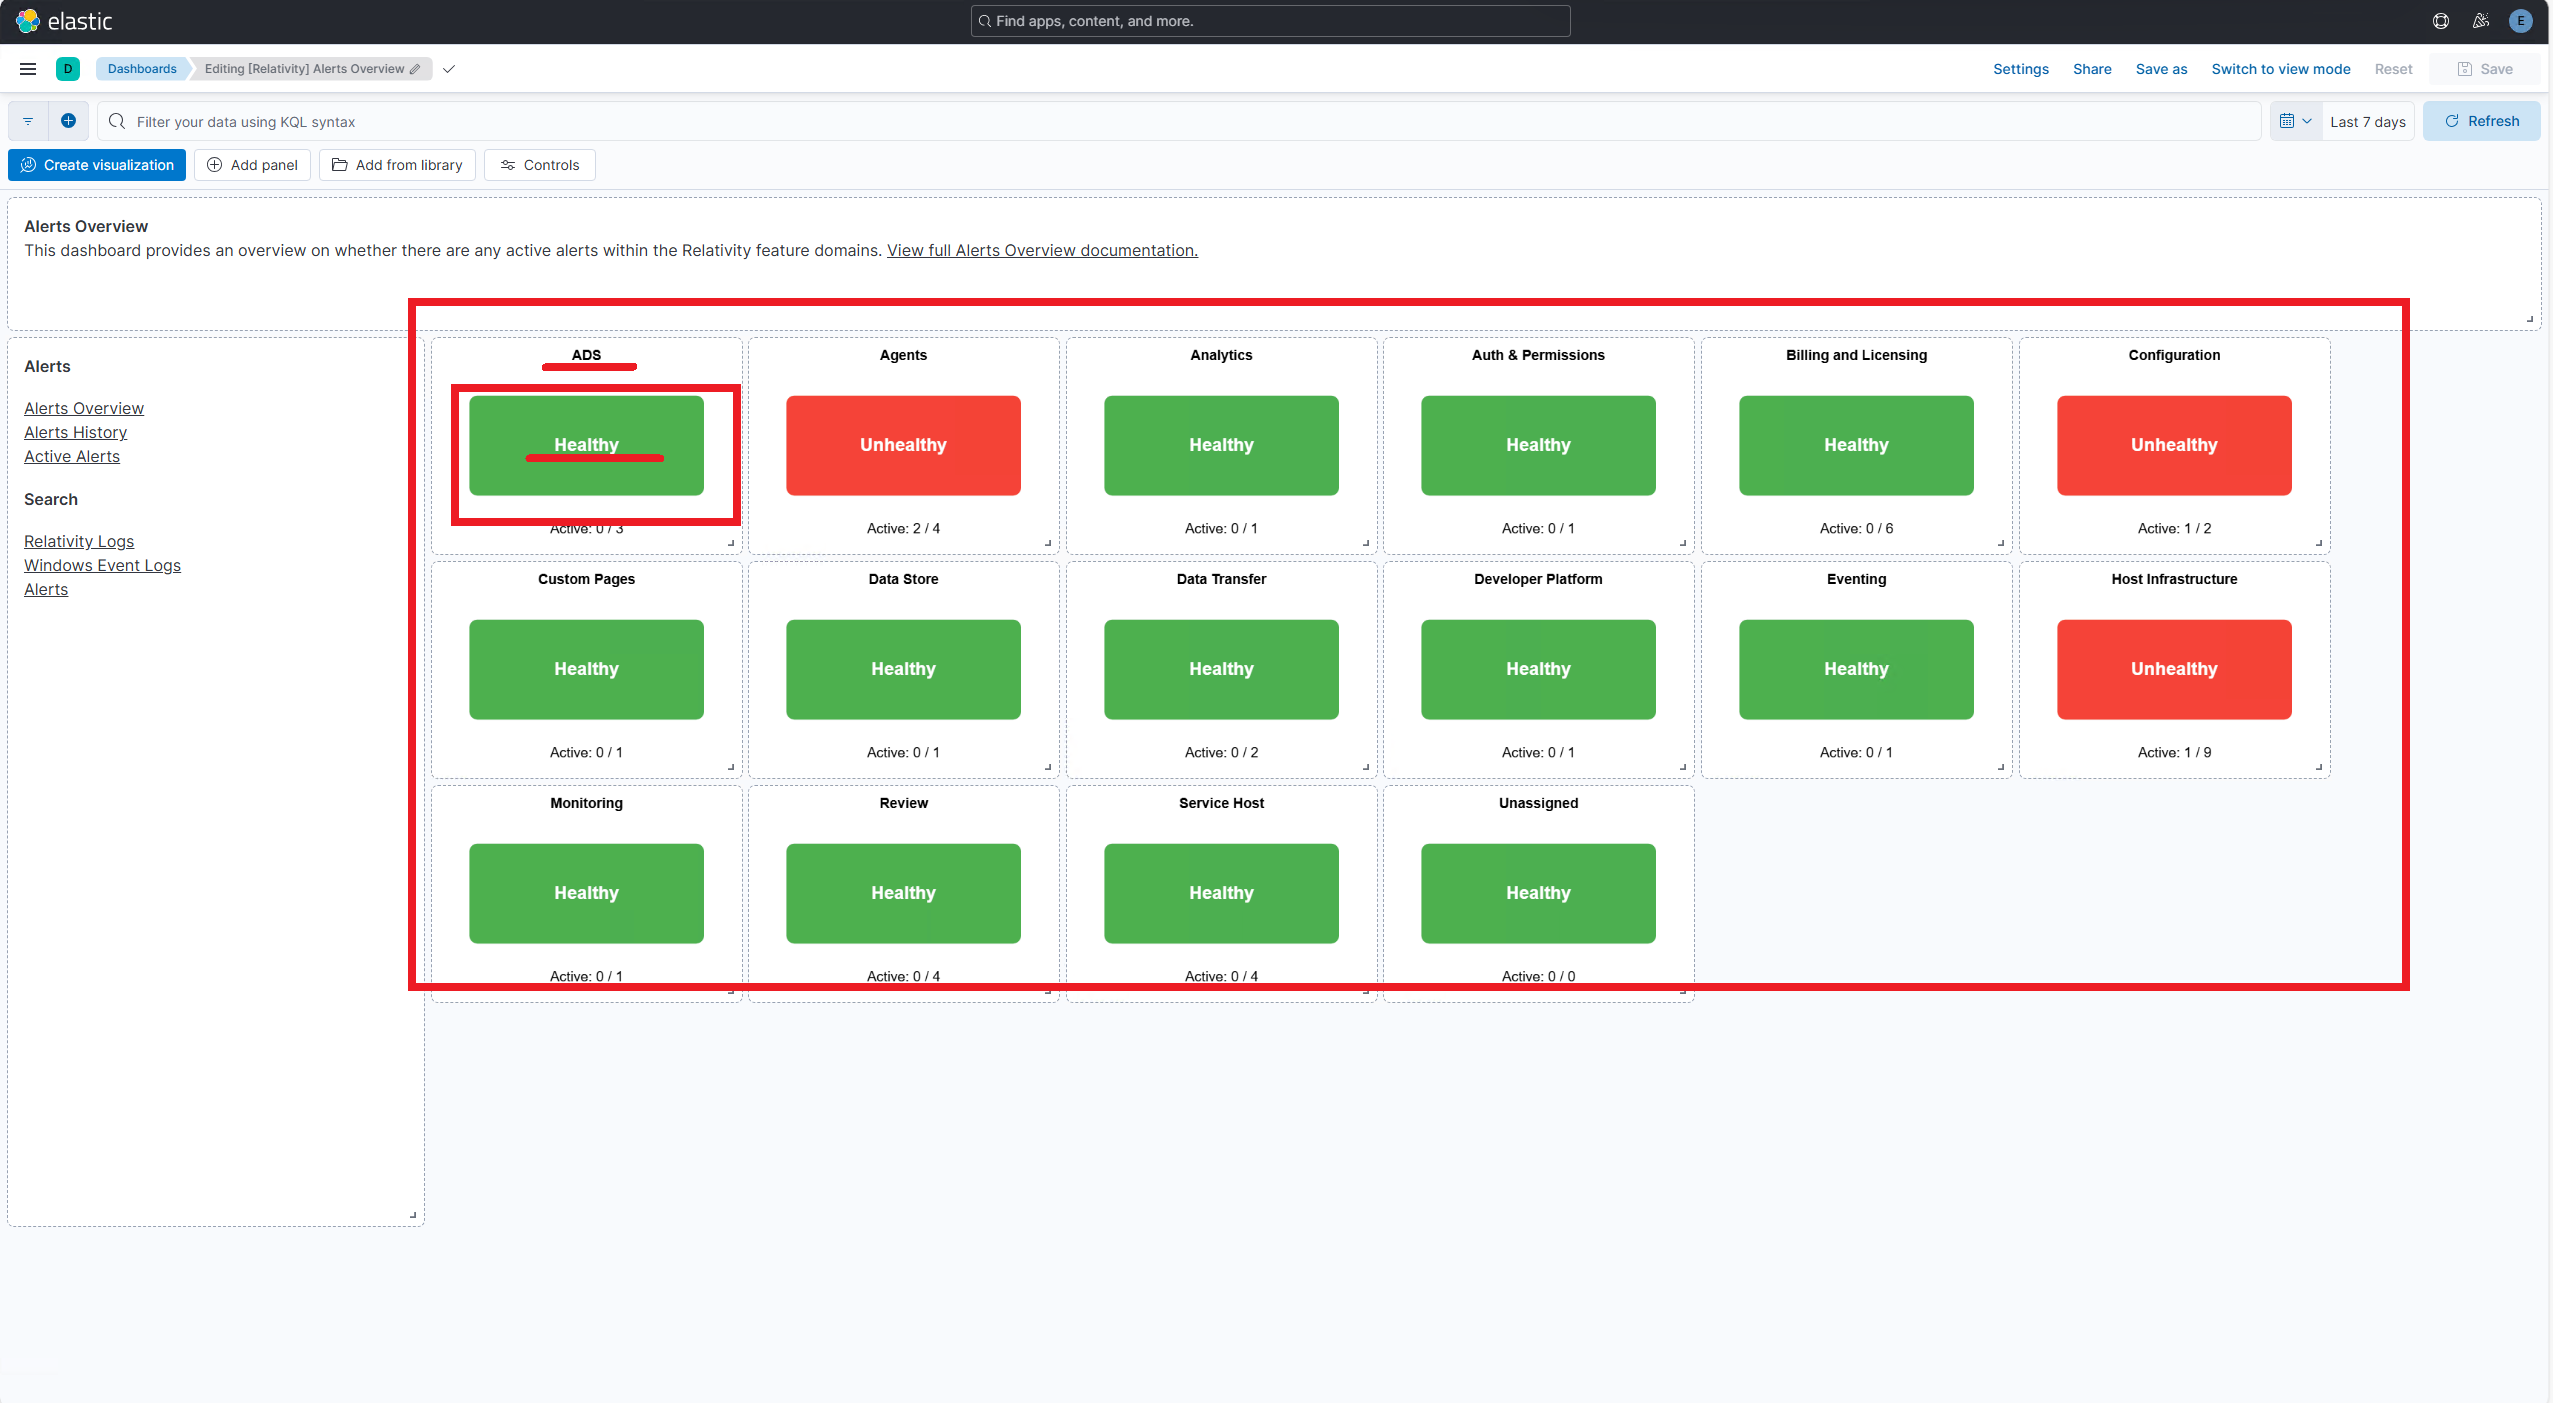
Verify individual health indicator status
Verify the status and formatting of each health indicator tile, based on alert-driven logic and the color coding conventions.
Steps:
- Open the [Relativity] Alerts Overview dashboard.
- Locate each of the following indicators and confirm the title, subtitle, and color.
Expected Result:
- Green = No active alerts (Healthy)
- Red = Active alerts present (Unhealthy)
- Grey = Monitoring data not available (N/A)
After the initial startup period (typically 10-15 minutes), all health indicators should display a Green or Red status. If a health indicator displays N/A (grey), this indicates that monitoring data is not currently available. This typically occurs when the monitoring agent is down or when there is a telemetry or data collection issue. If any health indicators continue to display N/A after the initial startup period: Verify that all required monitoring agents and related services are running. Check for errors or warnings related to monitoring or data collection in the Environment Watch logs. Health indicators will automatically update once monitoring data becomes available.
Example Screenshot:
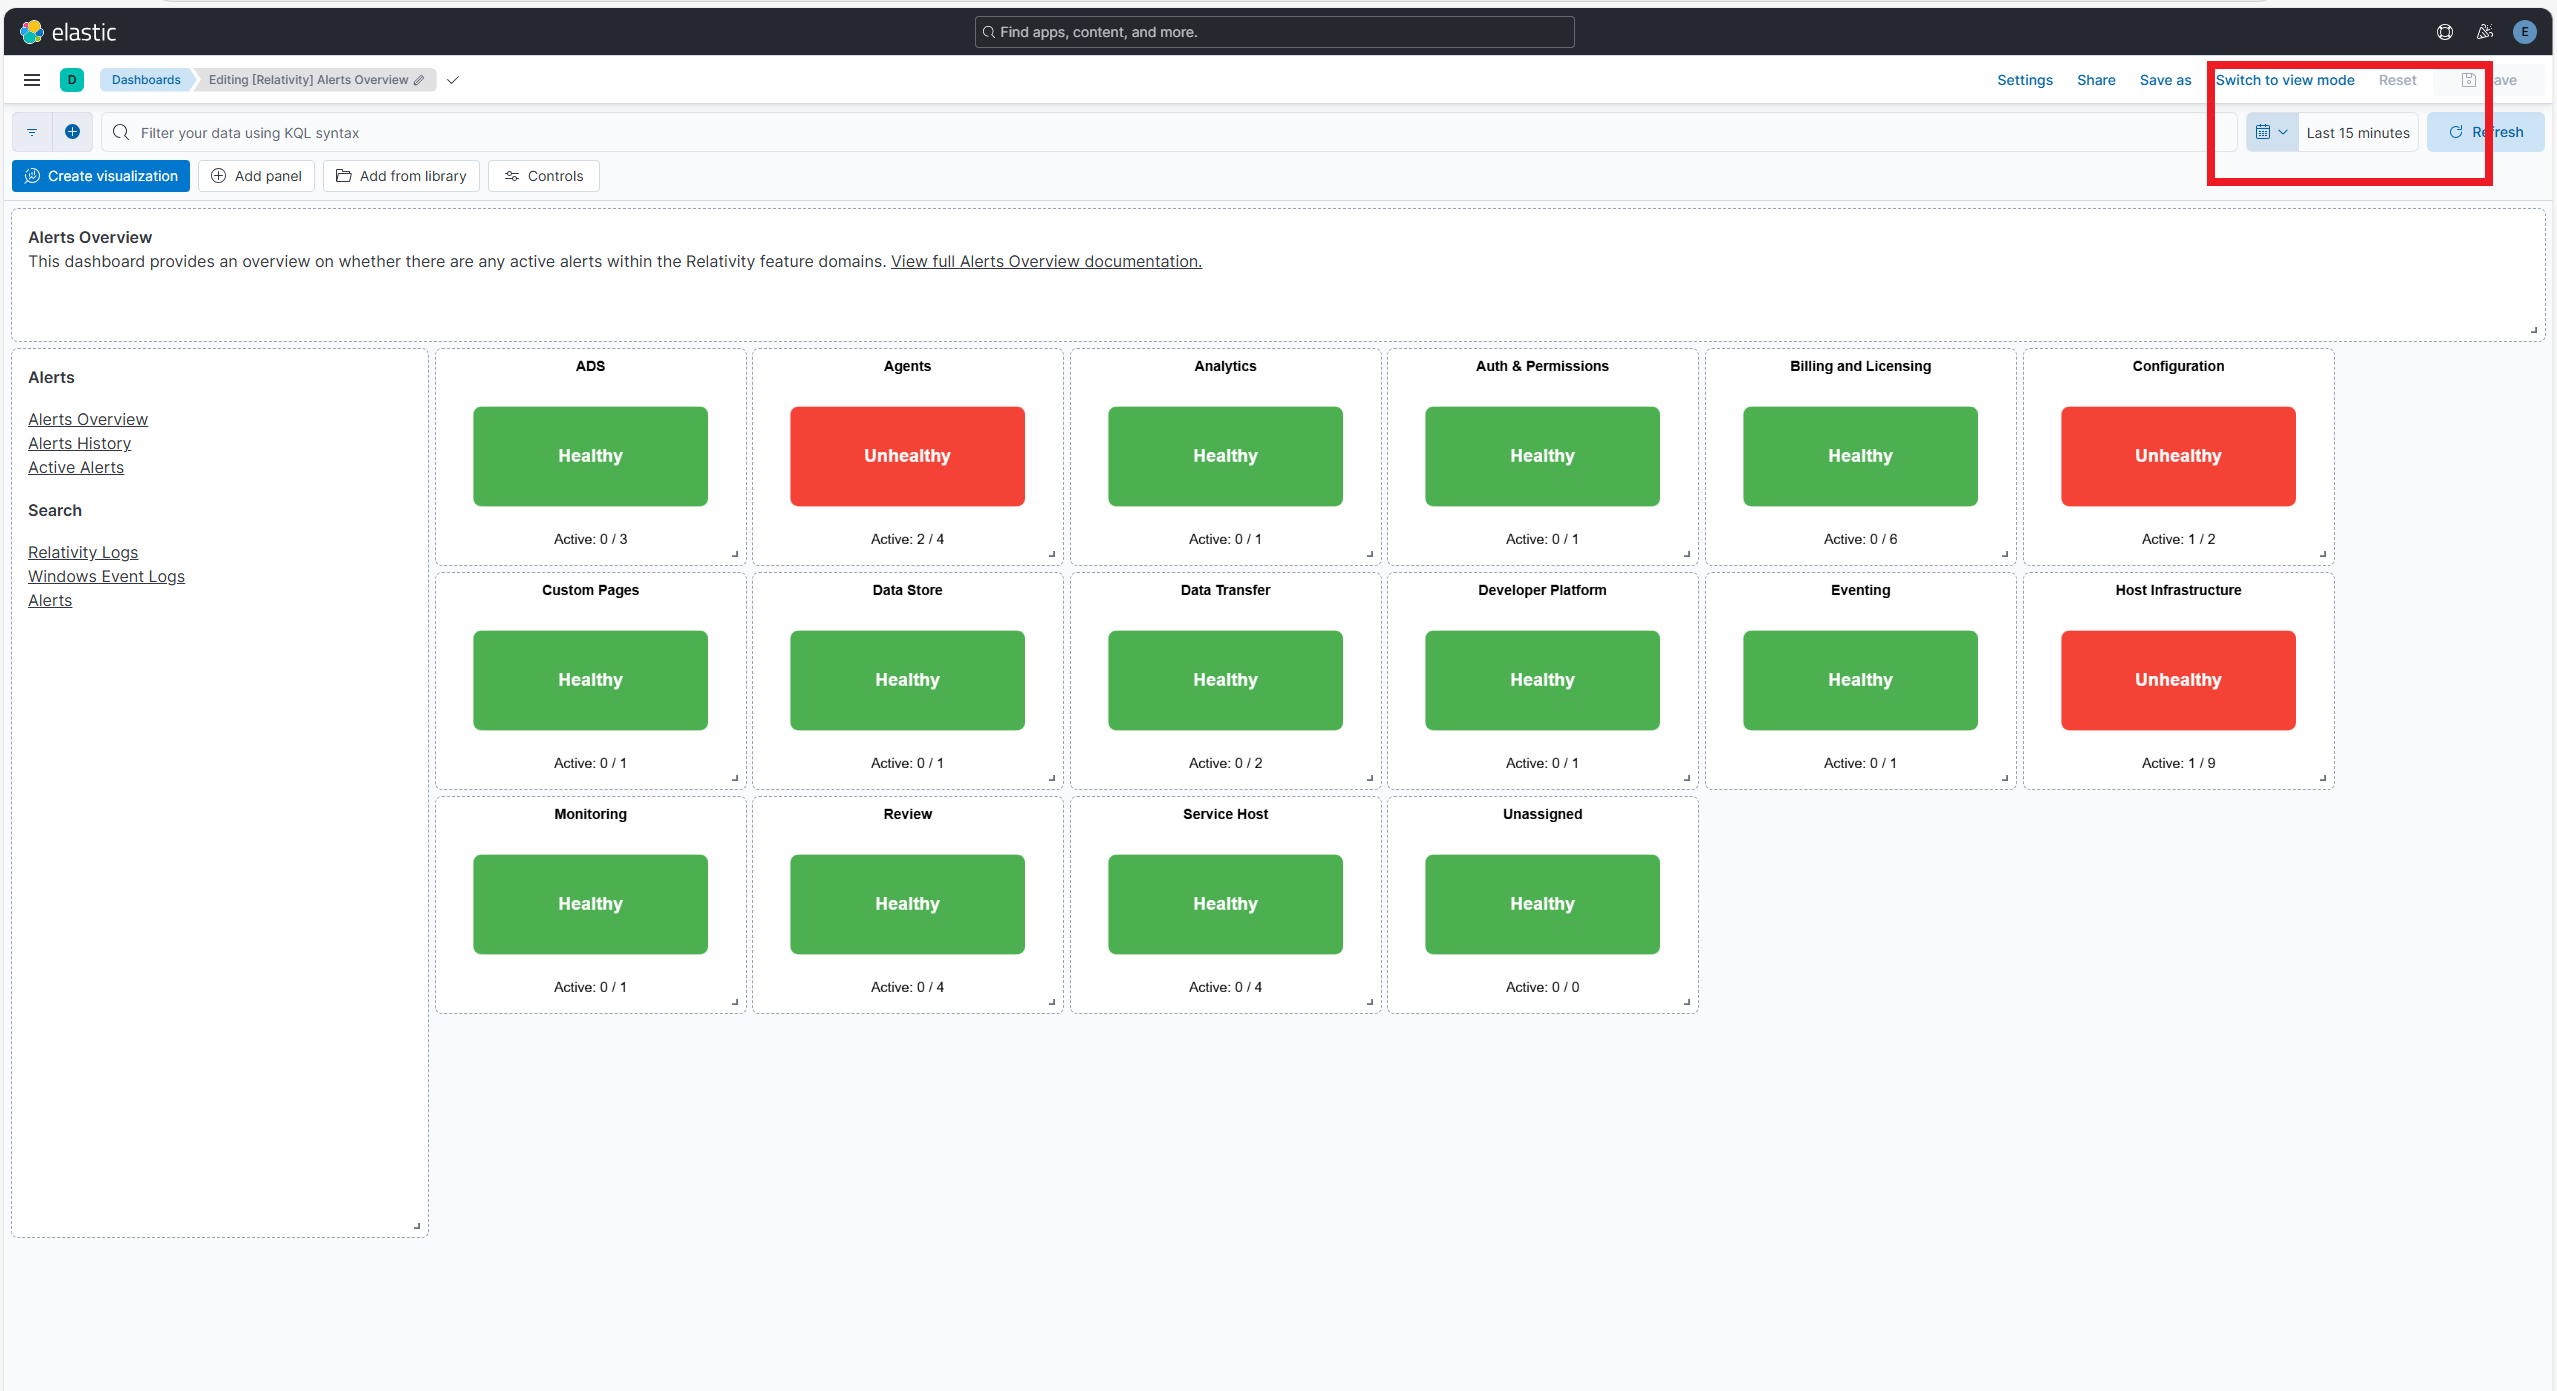
Verify dashboard in a time range
Ensure that the dashboard is using a custom 15-minute time range as required for health indicators.
Steps:
- On the dashboard, navigate to one of the alerts.
- Locate the time filter at the top right.
- Click on the time range selector.
- Select Apply custom time range.
- Set the range to the last 15 minutes.
- Apply changes.
Expected Result:
- The time range reflects the last 15 minutes.
- Health indicators update dynamically based on this range.
Screenshot: