


Feedback
Traces Overview
This dashboard offers a centralized view of distributed traces collected from all monitored components in the Relativity environment. It highlights trace volume, source distribution, and time-based trends, enabling administrators to analyze request flows, detect latency issues, and troubleshoot performance bottlenecks.
Trace Volume by Host and Server Type
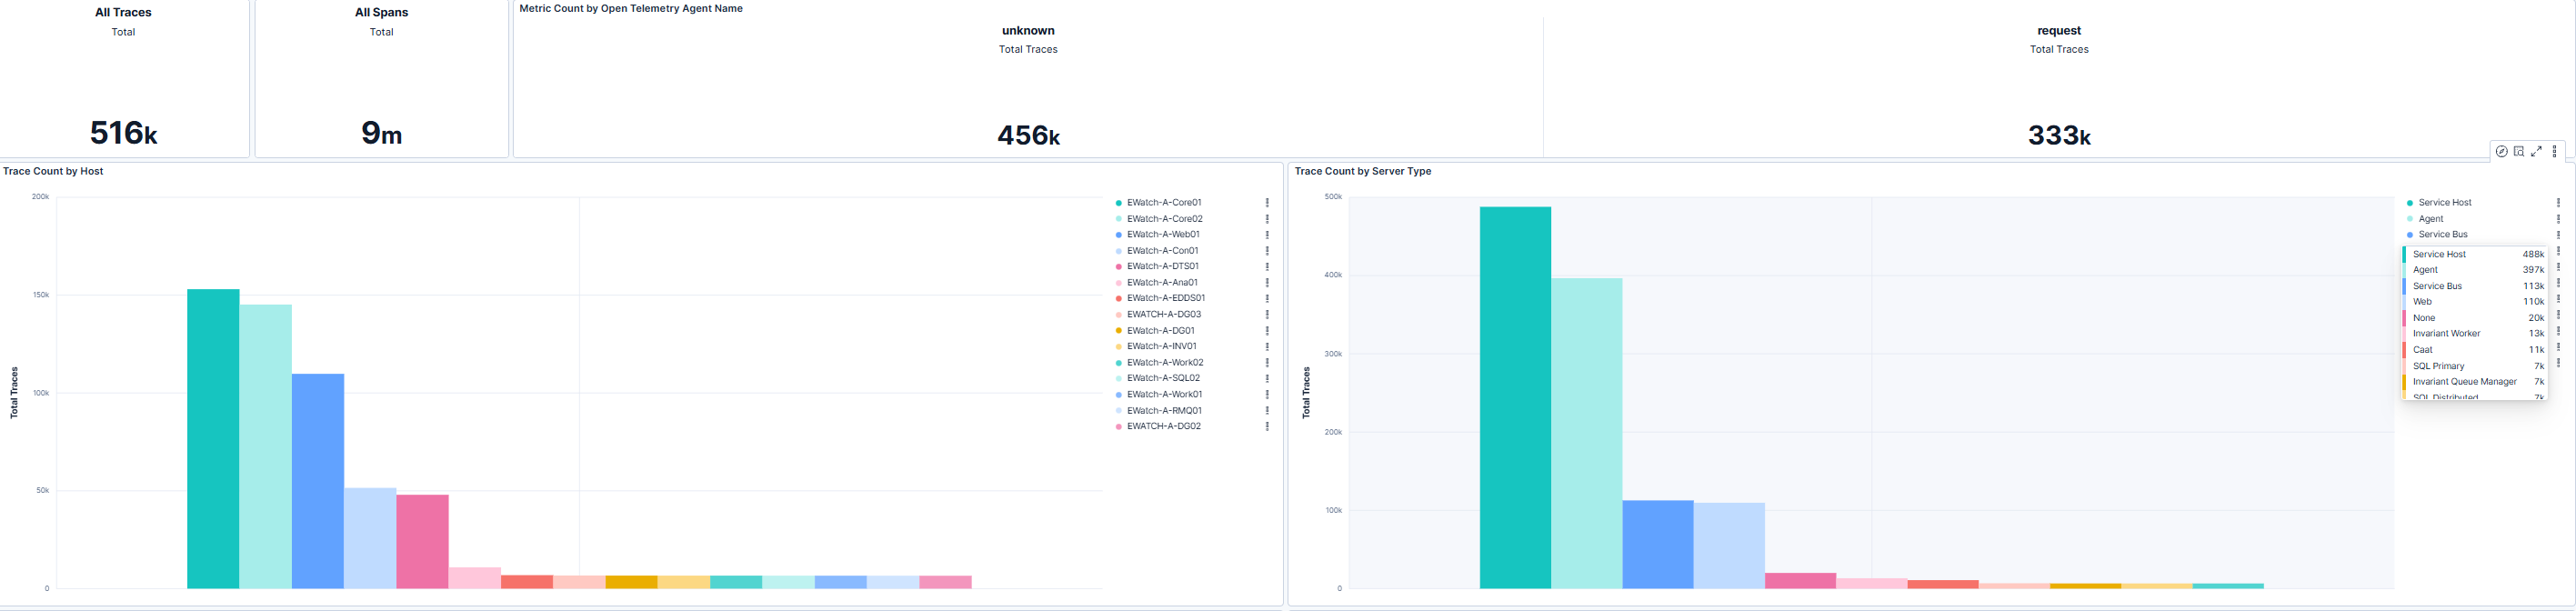
This section displays total trace counts along with breakdowns by host and server type. Relativity administrators can use this view to confirm consistent trace collection across all monitored systems and identify gaps or anomalies. High trace counts on specific hosts or server roles may indicate heavy workloads or potential performance hotspots. Reviewing these patterns helps ensure that all critical components are properly instrumented for distributed tracing.
Trace Source Distribution and Time-Based Trends
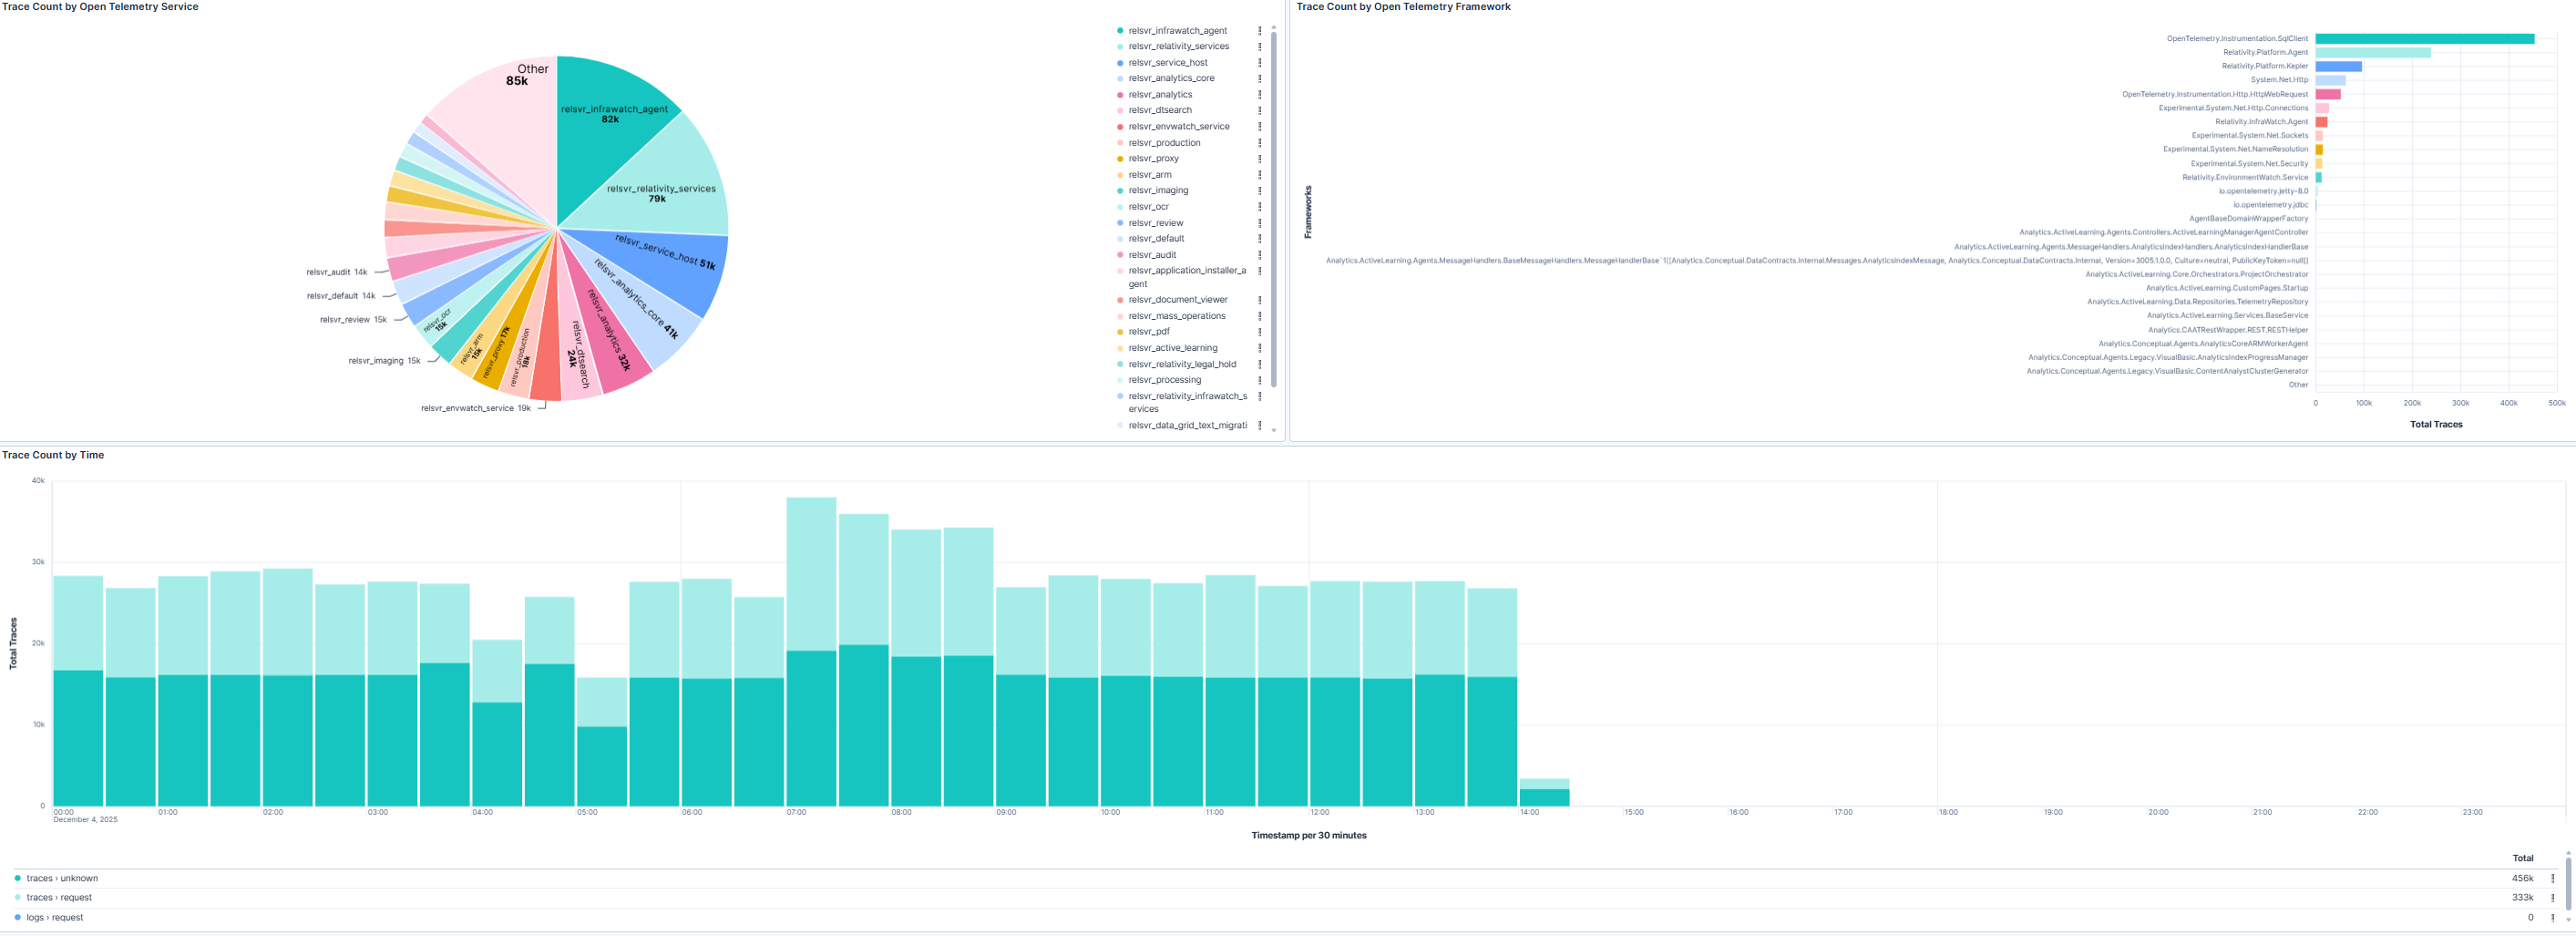
This section provides insights into trace sources by telemetry agent and framework, along with a time-based trend chart. The pie chart highlights which agents and frameworks contribute the most traces, while the bar chart shows the top trace-producing namespaces. The trend chart enables relativity administrators to detect spikes or drops in trace activity that may signal system instability, configuration issues, or workload changes. These insights support root-cause analysis and proactive performance optimization.
Use Cases
| Use Case | Description |
|---|---|
| Validate trace coverage | Confirm that traces are consistently collected across all hosts and services. |
| Detect anomalies | Identify sudden changes in trace volume that may indicate latency or monitoring issues. |
| Analyze request flows | Use trace data to understand multi-service interactions and pinpoint bottlenecks. |
| Support troubleshooting | Correlate trace patterns with system events to resolve complex performance problems. |