


Feedback
SQL Server Resources
This dashboard provides insights into SQL Server resource utilization at the process level. It helps monitor CPU, memory, and I/O performance across SQL Server processes to identify bottlenecks, resource contention, and performance trends.
SQL Resource Utilization
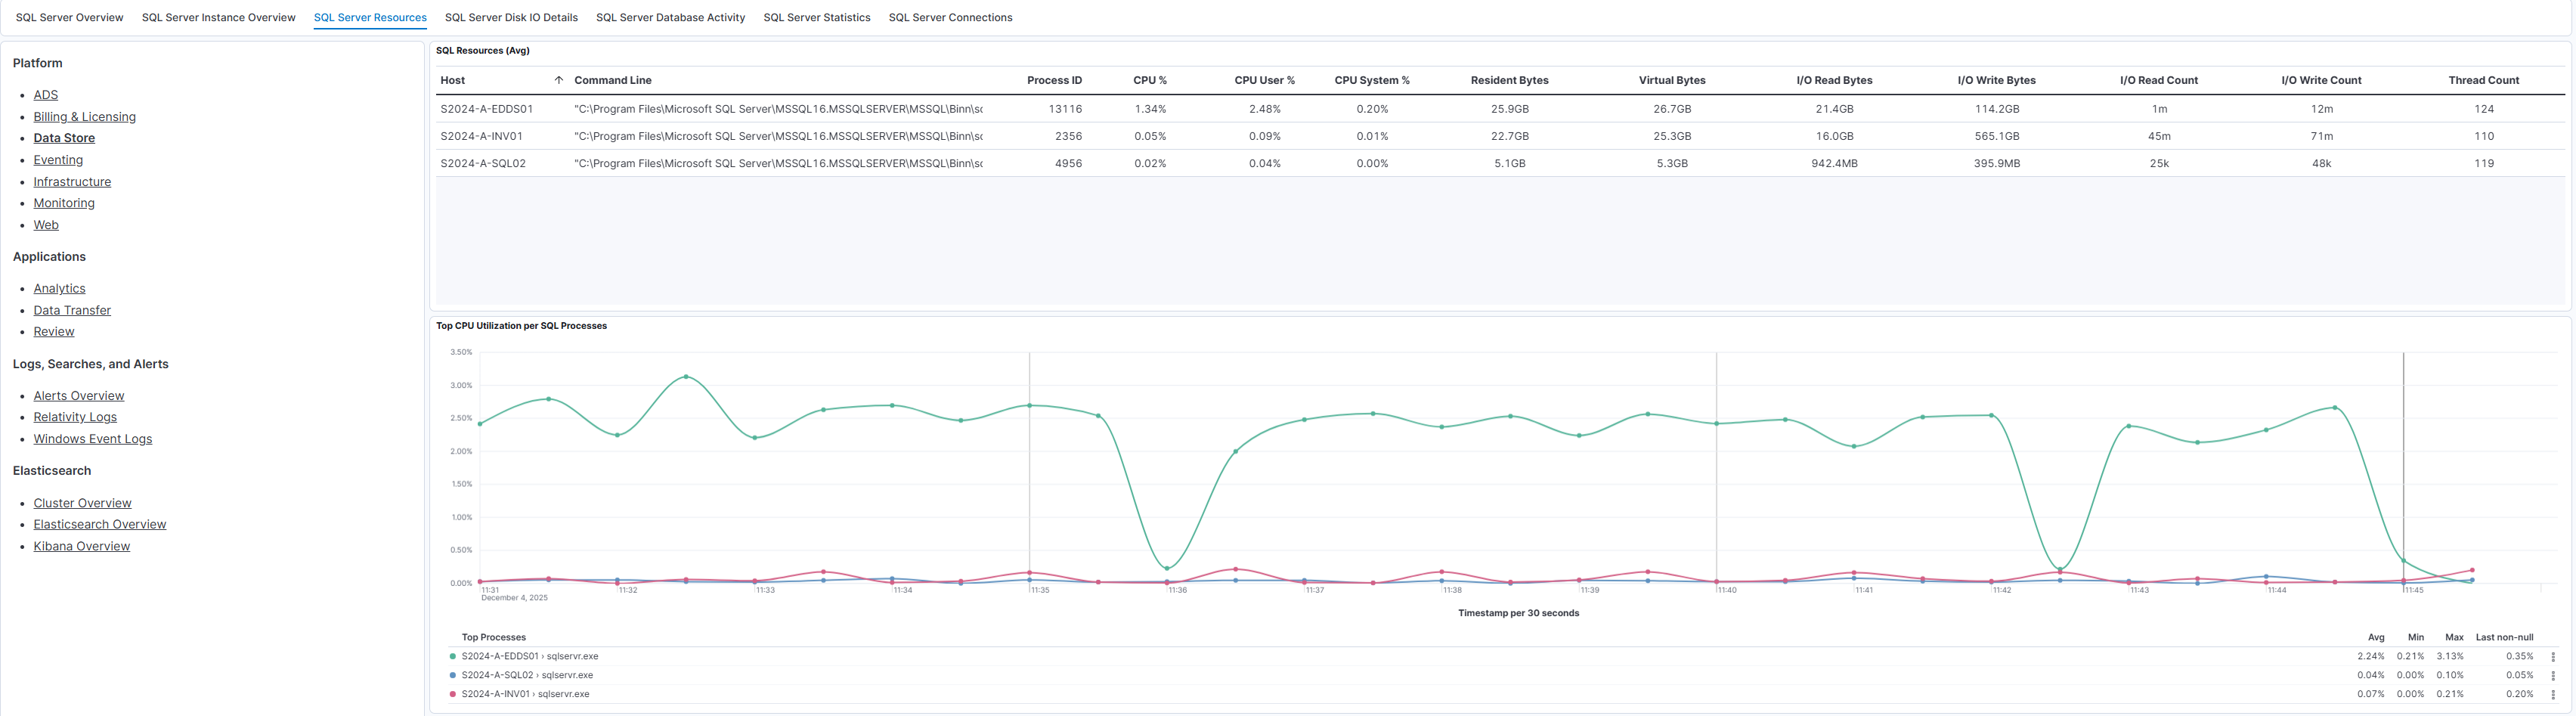
This dashboard displays SQL Server process-level statistics including CPU, memory, and I/O metrics. The top section lists SQL process IDs, command lines, and associated usage metrics. Graphs below show:
- CPU utilization trends per SQL server process over time.
- Memory usage trends indicating resident and virtual bytes. These visualizations help pinpoint which SQL Server processes consume the most CPU or memory and track their utilization patterns.
SQL I/O Performance (Read and Write Bytes)
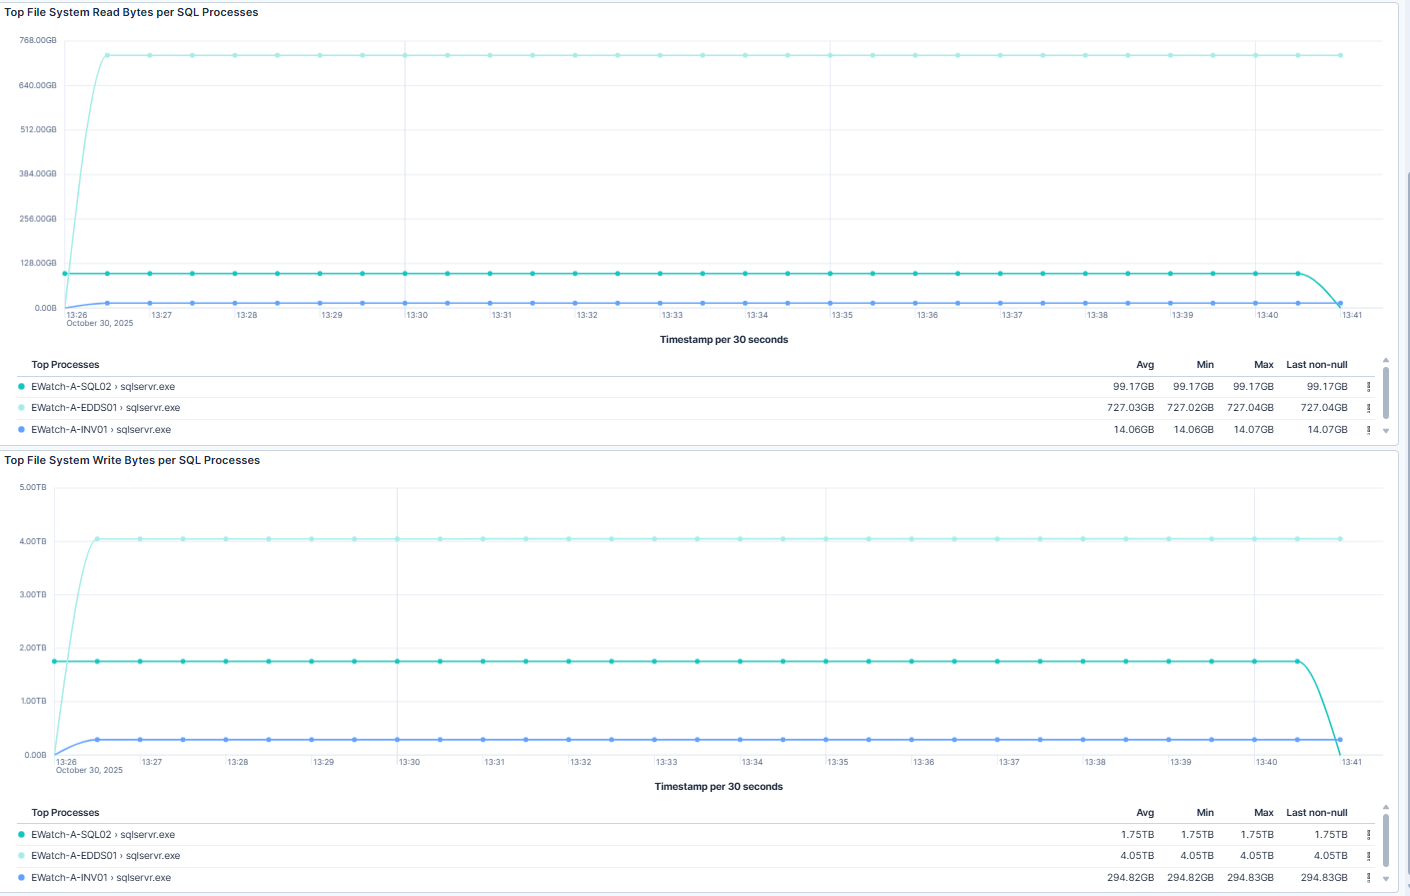
This dashboard shows system I/O throughput trends for SQL Server processes:
- Top System Read Bytes graph — tracks read activity (e.g., data retrieval from disk).
- Top System Write Bytes graph — tracks write activity (e.g., data commits and logs). These graphs help assess disk performance, detect potential I/O bottlenecks, and monitor read/write behavior over time.
Use Cases
| Use Case | Description |
|---|---|
| Monitor SQL Server resource usage | Monitor SQL Server process-level CPU and memory utilization for performance tuning. |
| Detect abnormal I/O patterns | Detect abnormal I/O patterns that may indicate storage performance issues. |
| Identify resource-heavy instances | Identify resource-heavy SQL Server instances for workload optimization. |