


Feedback
SQL Server Disk I/O Details
This dashboard provides visibility into SQL Server database disk performance by tracking read/write throughput and latency metrics. It helps you identify bottlenecks, monitor trends, and troubleshoot performance issues related to disk activity in your SQL instances.
Read and write throughput
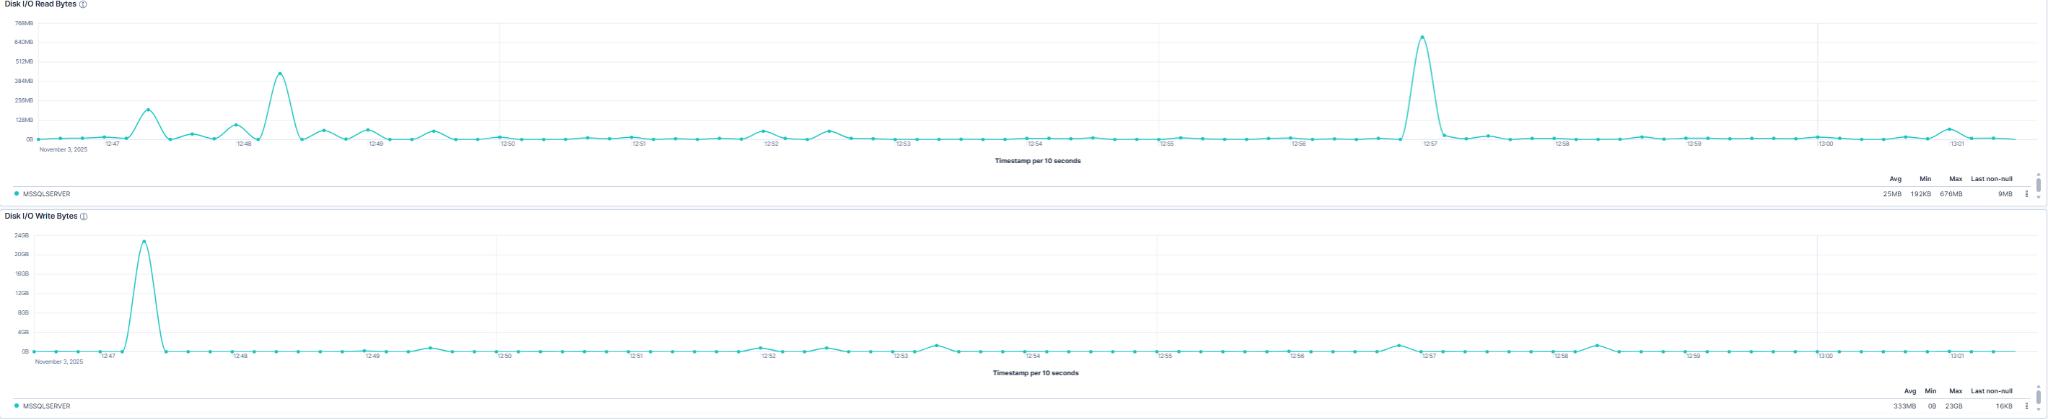
This dashboard shows how many bytes the SQL Server reads from and to disk.
- Read Bytes - Total Data Retrieved From Disk.
- Write Bytes - Total Data Written to Disk.
Read and write latency
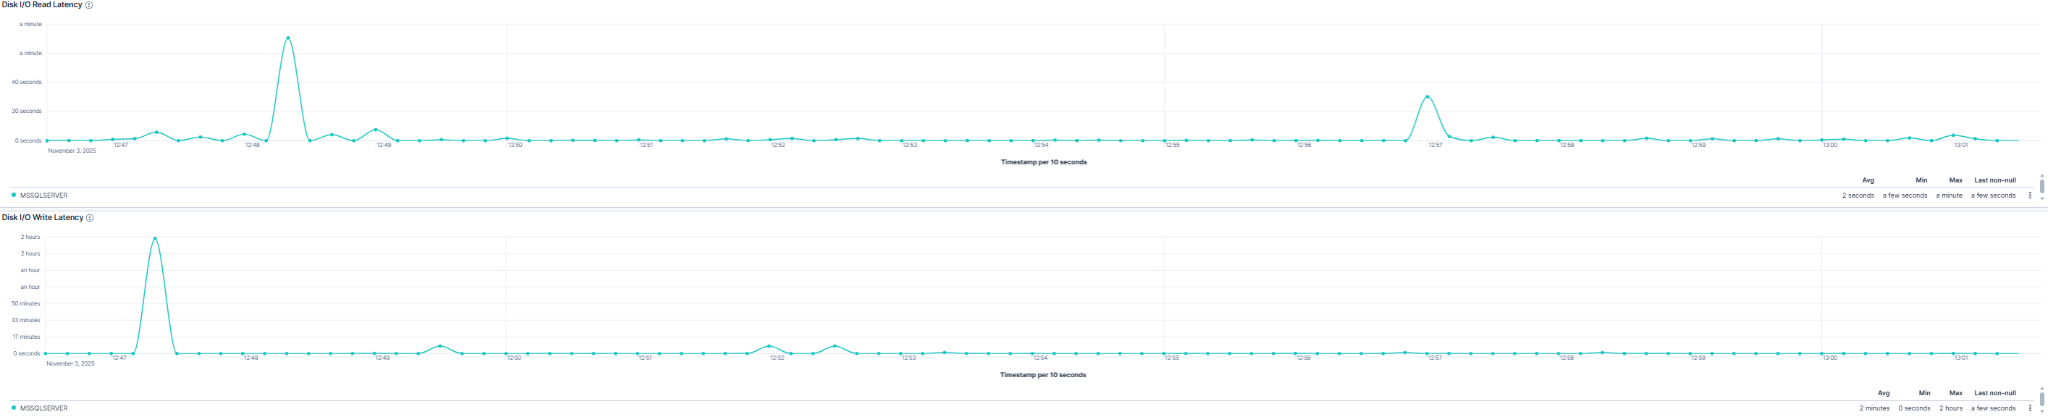
This panel shows the time each read or write operation needs to finish.
- Read Latency - Delay Before the Server Accesses Data on Disk.
- Write Latency - Delay Before the Server Commits Data to Disk.
Use cases
| Use Case | Description |
|---|---|
| Performance troubleshooting | Correlate latency spikes with query execution, indexing, or backup jobs. |
| Capacity planning | Track growing throughput to plan storage expansion or optimization. |
| Health monitoring | Detect unusual or sustained I/O that could reduce SQL Server responsiveness. |
| Root-cause analysis | Combine throughput and latency data to confirm or rule out storage issues. |