


Feedback
Monitoring Agents
This dashboard provides visibility into all Environment Watch (EW) agents installed across your Relativity instance. This dashboard confirms that each host is properly running the Environment Watch service and sending telemetry data to the OpenTelemetry backend (Elasticsearch). This verification is critical during post-installation checks. If any host fails to appear or shows missing metrics, it indicates that the Environment Watch service is not running on that host. Without an active service, metrics will not be collected or reported, impacting the monitoring of system health and performance. Ensuring all agents appear in this dashboard is a key validation step for a successful Environment Watch installation. For detailed post-installation verification steps, see the Environment Watch Post-Install Verification Guide.
Monitoring Agents Overview
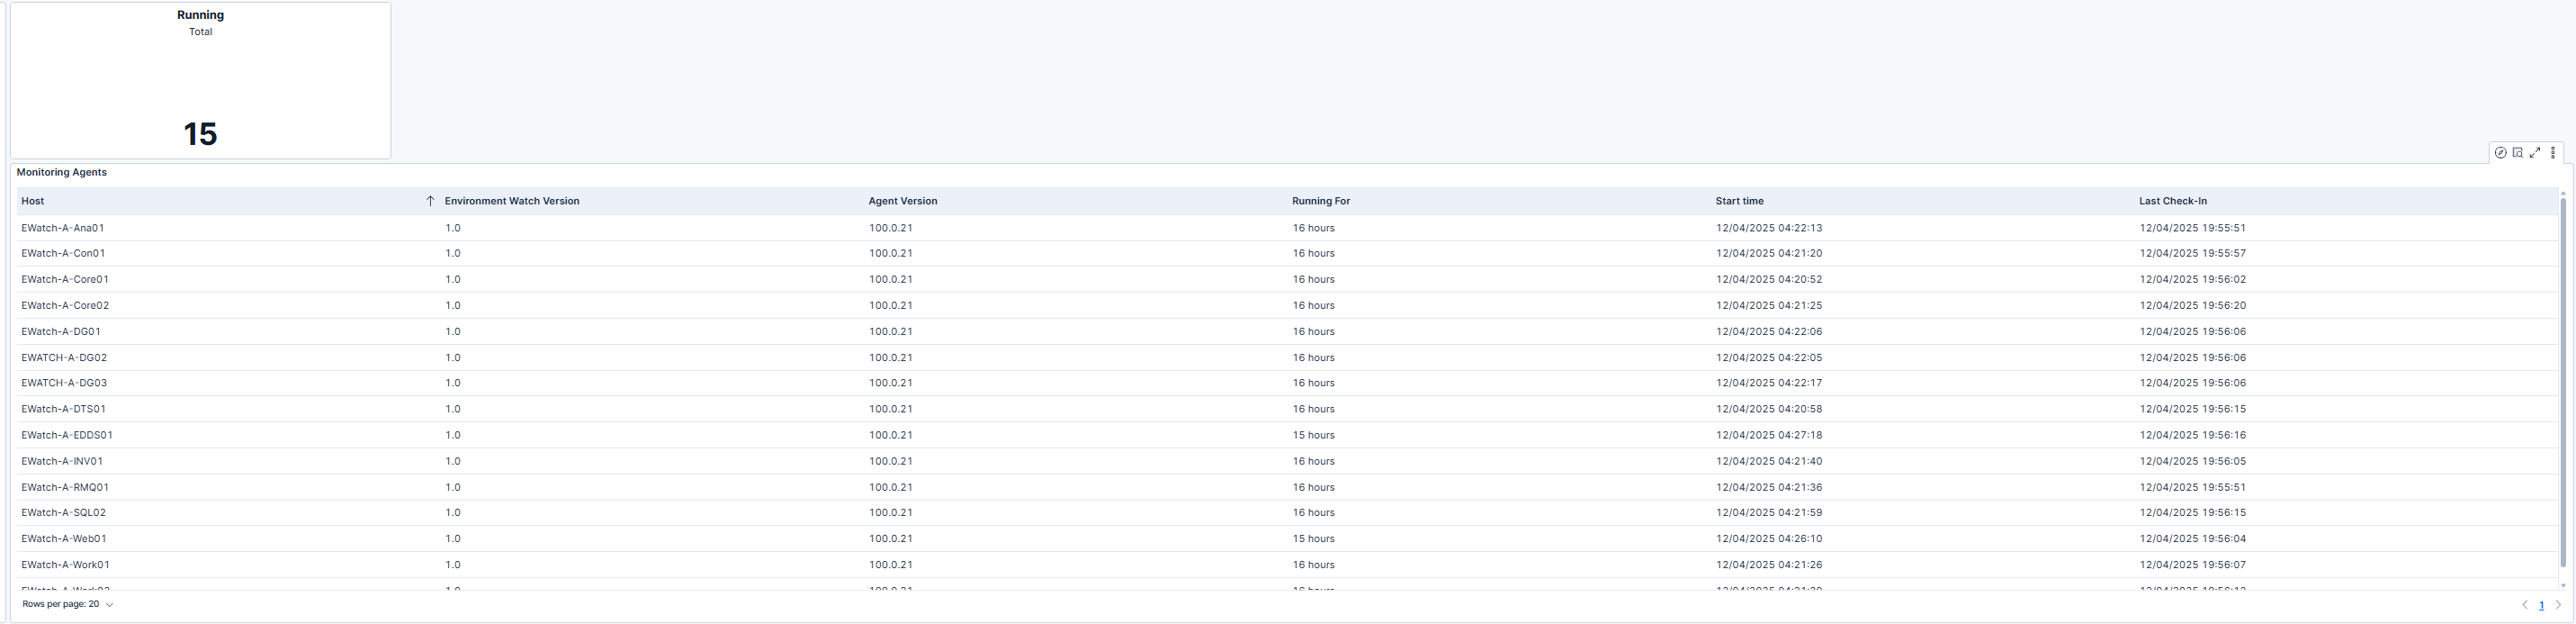
This view lists all Relativity hosts where the Environment Watch Monitoring Agent is installed, along with key operational metrics that confirm connectivity and uptime. The table includes the Host, Environment Watch Version, Agent Version, Running For duration, Start Time, and Last Check-In fields. The Running For and Last Check-In columns provide quick insight into whether each agent is actively sending metrics to the OpenTelemetry backend. Regular check-ins indicate healthy communication between the agent and Elasticsearch, ensuring that monitoring data is being collected in real time. This visibility helps administrators validate that all monitoring agents are online and functioning as expected.
Use Cases
| Use Case | Description |
|---|---|
| Verify post-installation setup | After installing Environment Watch, use this dashboard to verify successful setup. Missing hosts or outdated check-in times may indicate stopped services or incomplete installation. |
| Monitor ongoing agent health | Use this dashboard during routine monitoring to confirm that all agents are operating correctly. Reviewing Last Check-In timestamps helps detect stalled or disconnected agents early. |
| Troubleshoot metric gaps | When other dashboards show missing or incomplete metrics, use this view to identify inactive or misconfigured agents. Hosts with outdated or missing check-ins highlight where remediation is needed. |